 |
 |
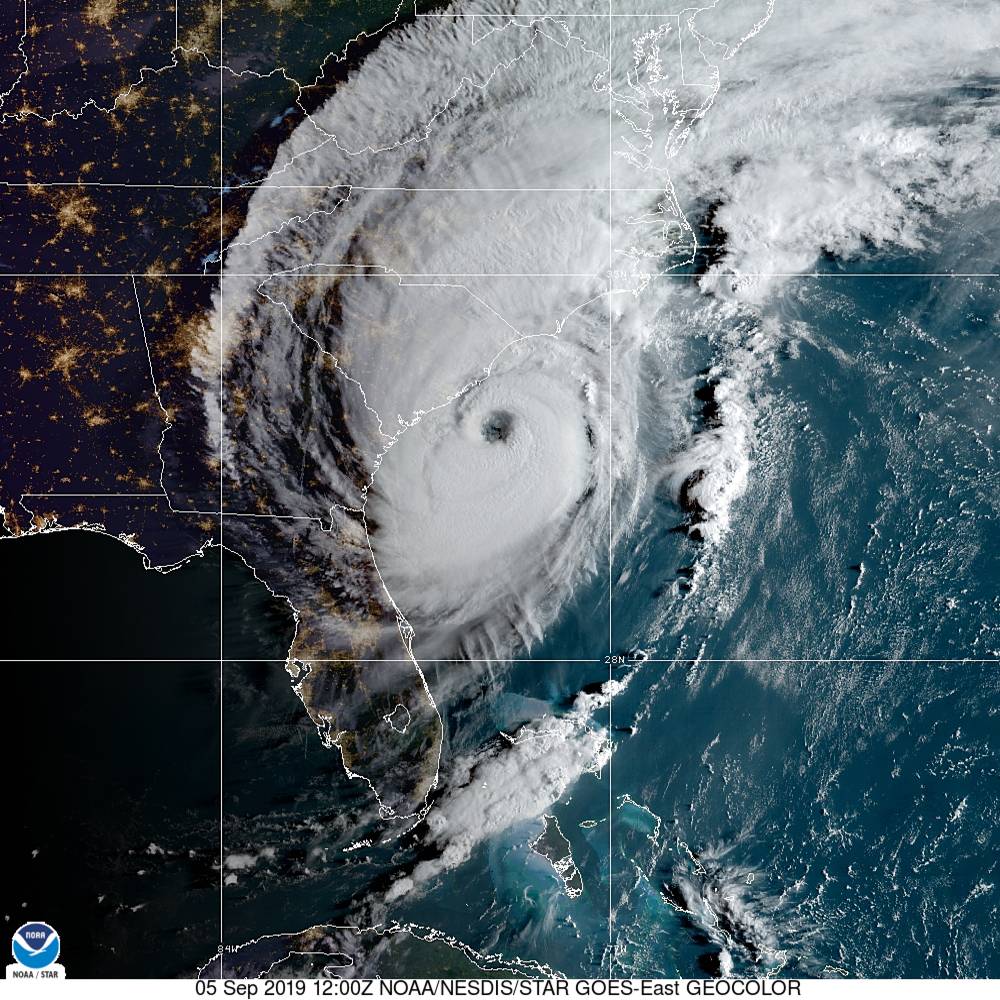
| GOES-16 satellite image at 8 AM EDT on September 5, 2019 showing Hurricane Dorian off the South Carolina coast. | NWS doppler radar imagery from September 1-6, 2019 showing Hurricane Dorian affecting the Southeast U.S. |
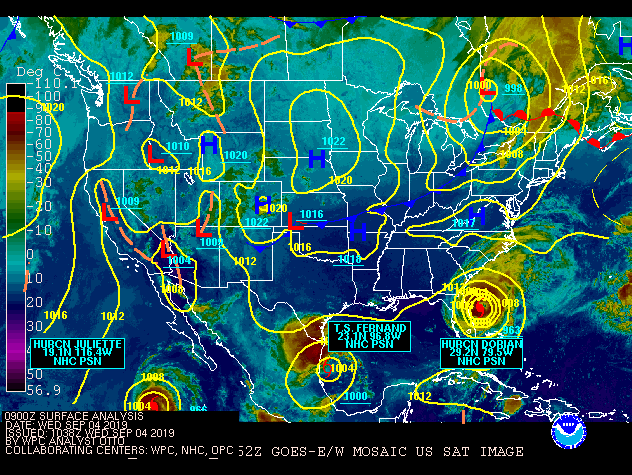
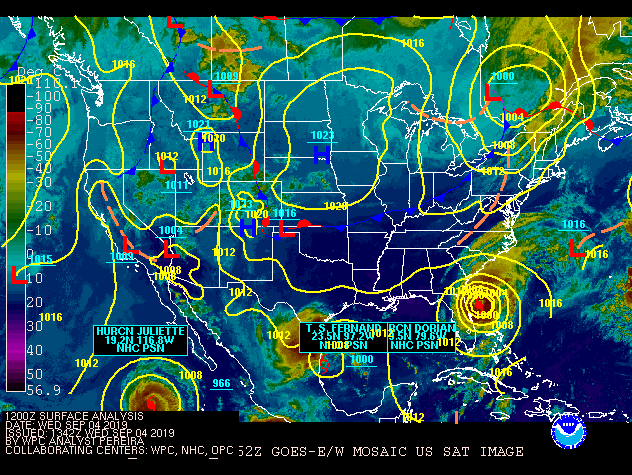
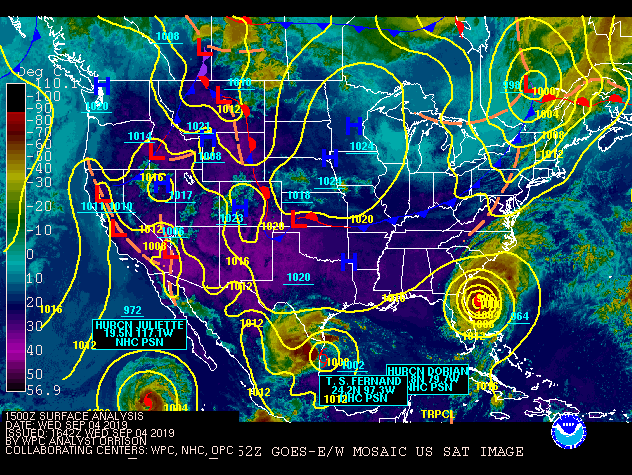
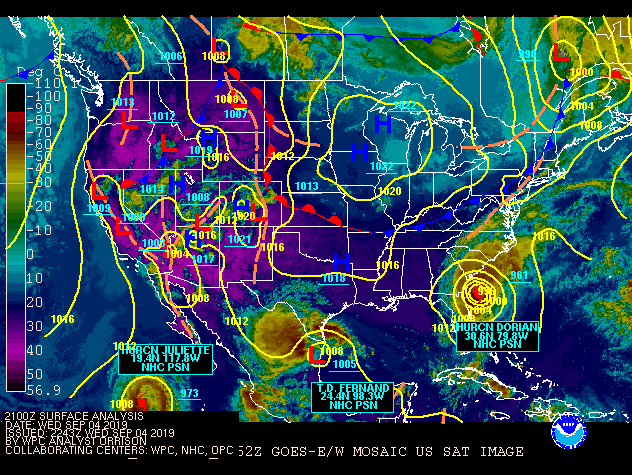
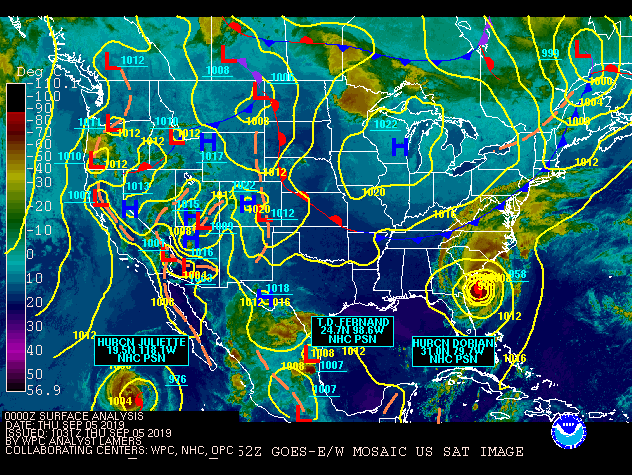
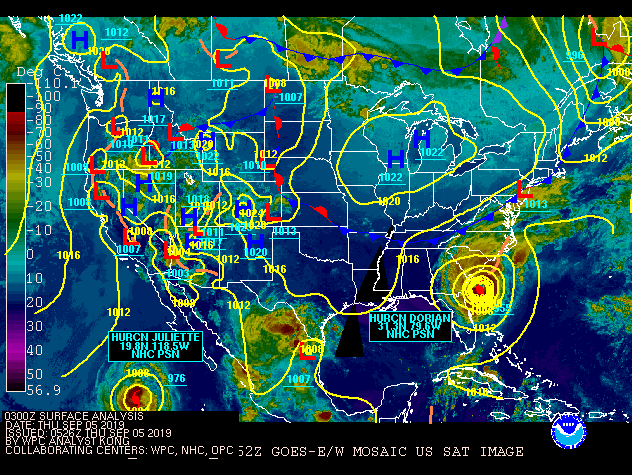
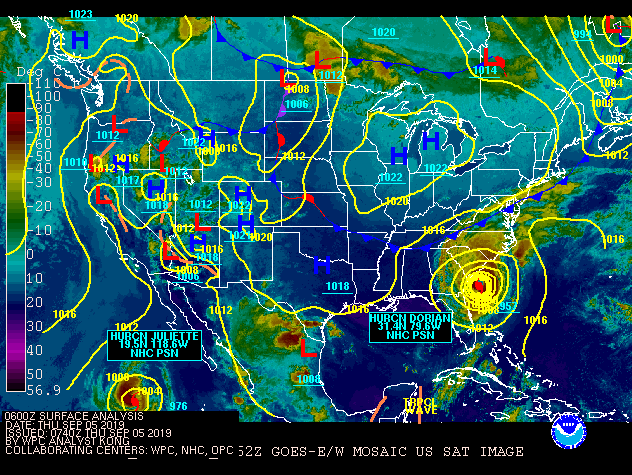
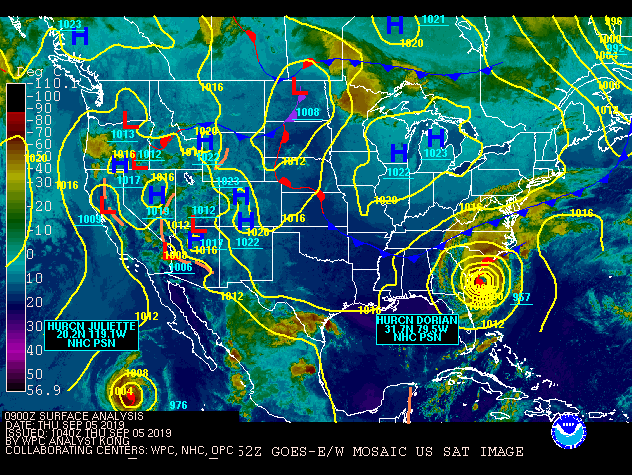
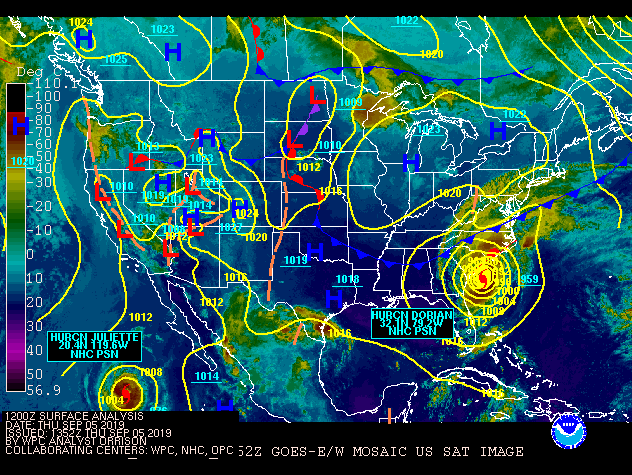
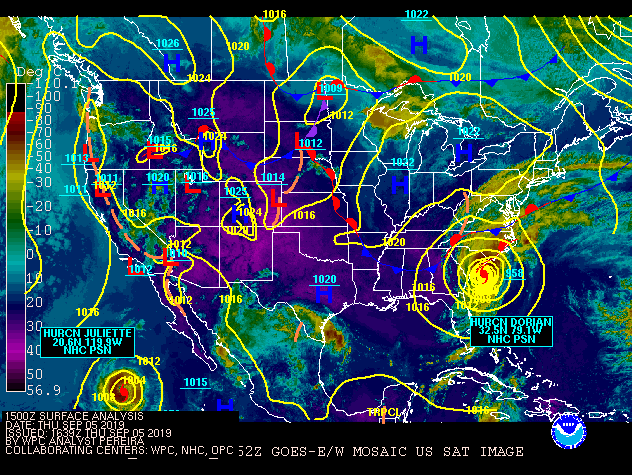
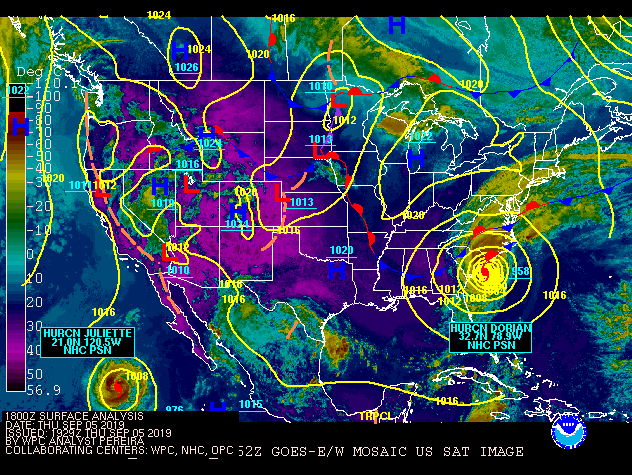
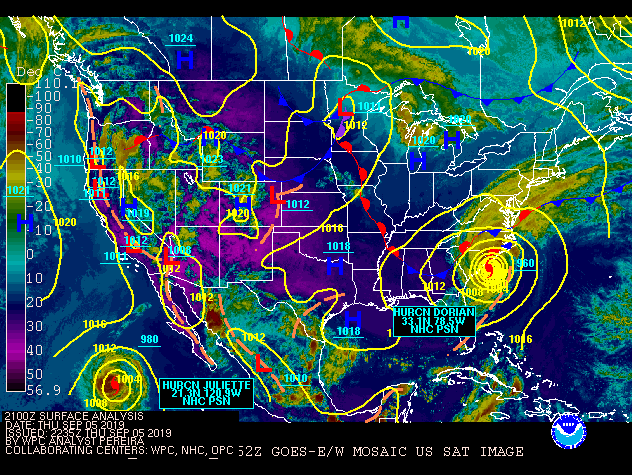
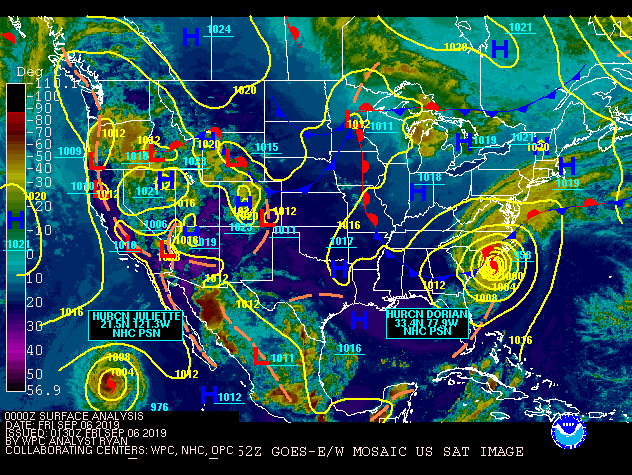
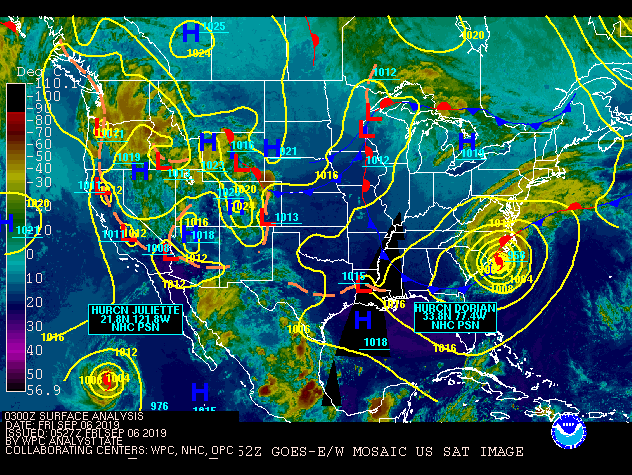
Hurricane Dorian tracked northward off the Georgia coast and then north-northeast just off the South Carolina coast on September 4-5 while intensifying to a Category 3 hurricane with maximum sustained winds near 115 mph (see loop of the Weather Prediction Center's surface analyses below). In fact, the storm moved directly over Buoy 41004 as evidenced by this plot of winds and pressure. The storm caused sustained tropical storm force winds, hurricane force wind gusts, heavy rain and some coastal flooding, especially near the SC coast. Check out our Post-Storm Report which includes meteorological statistics and impacts across southeast SC/GA.


Click on image to enlarge the image and access a listing of wind gust reports
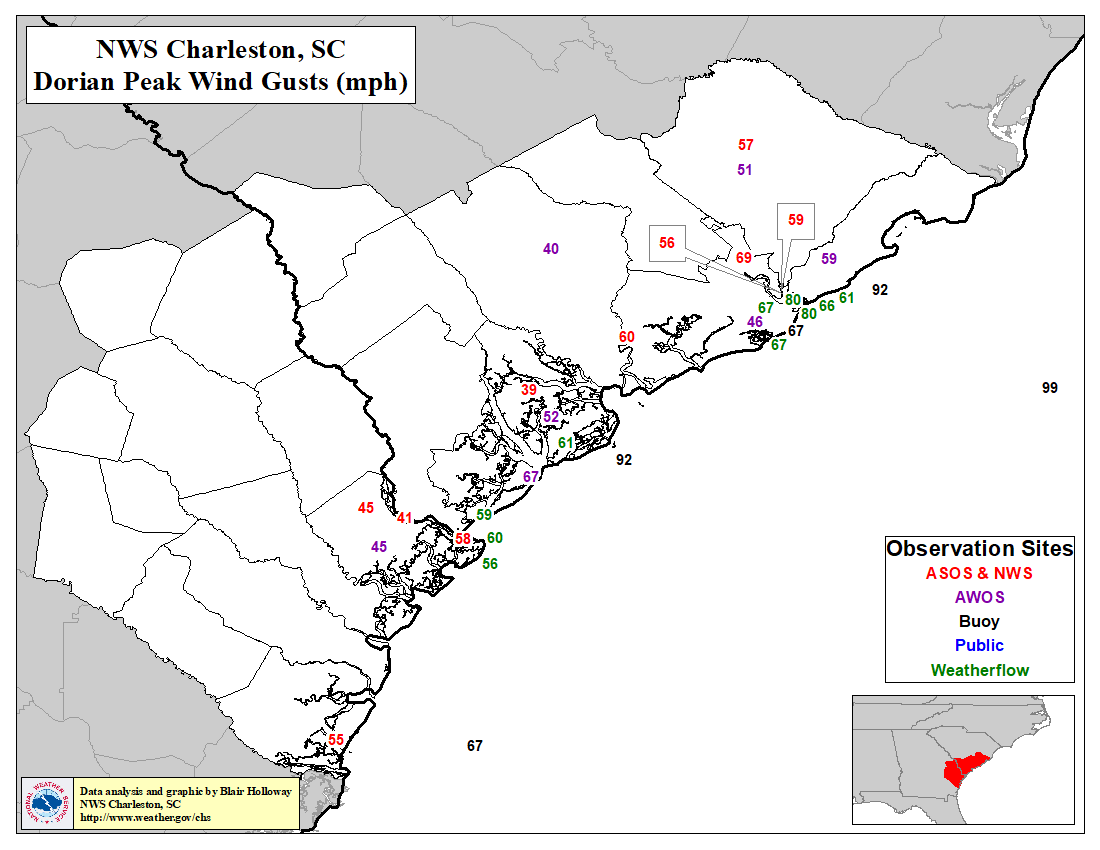
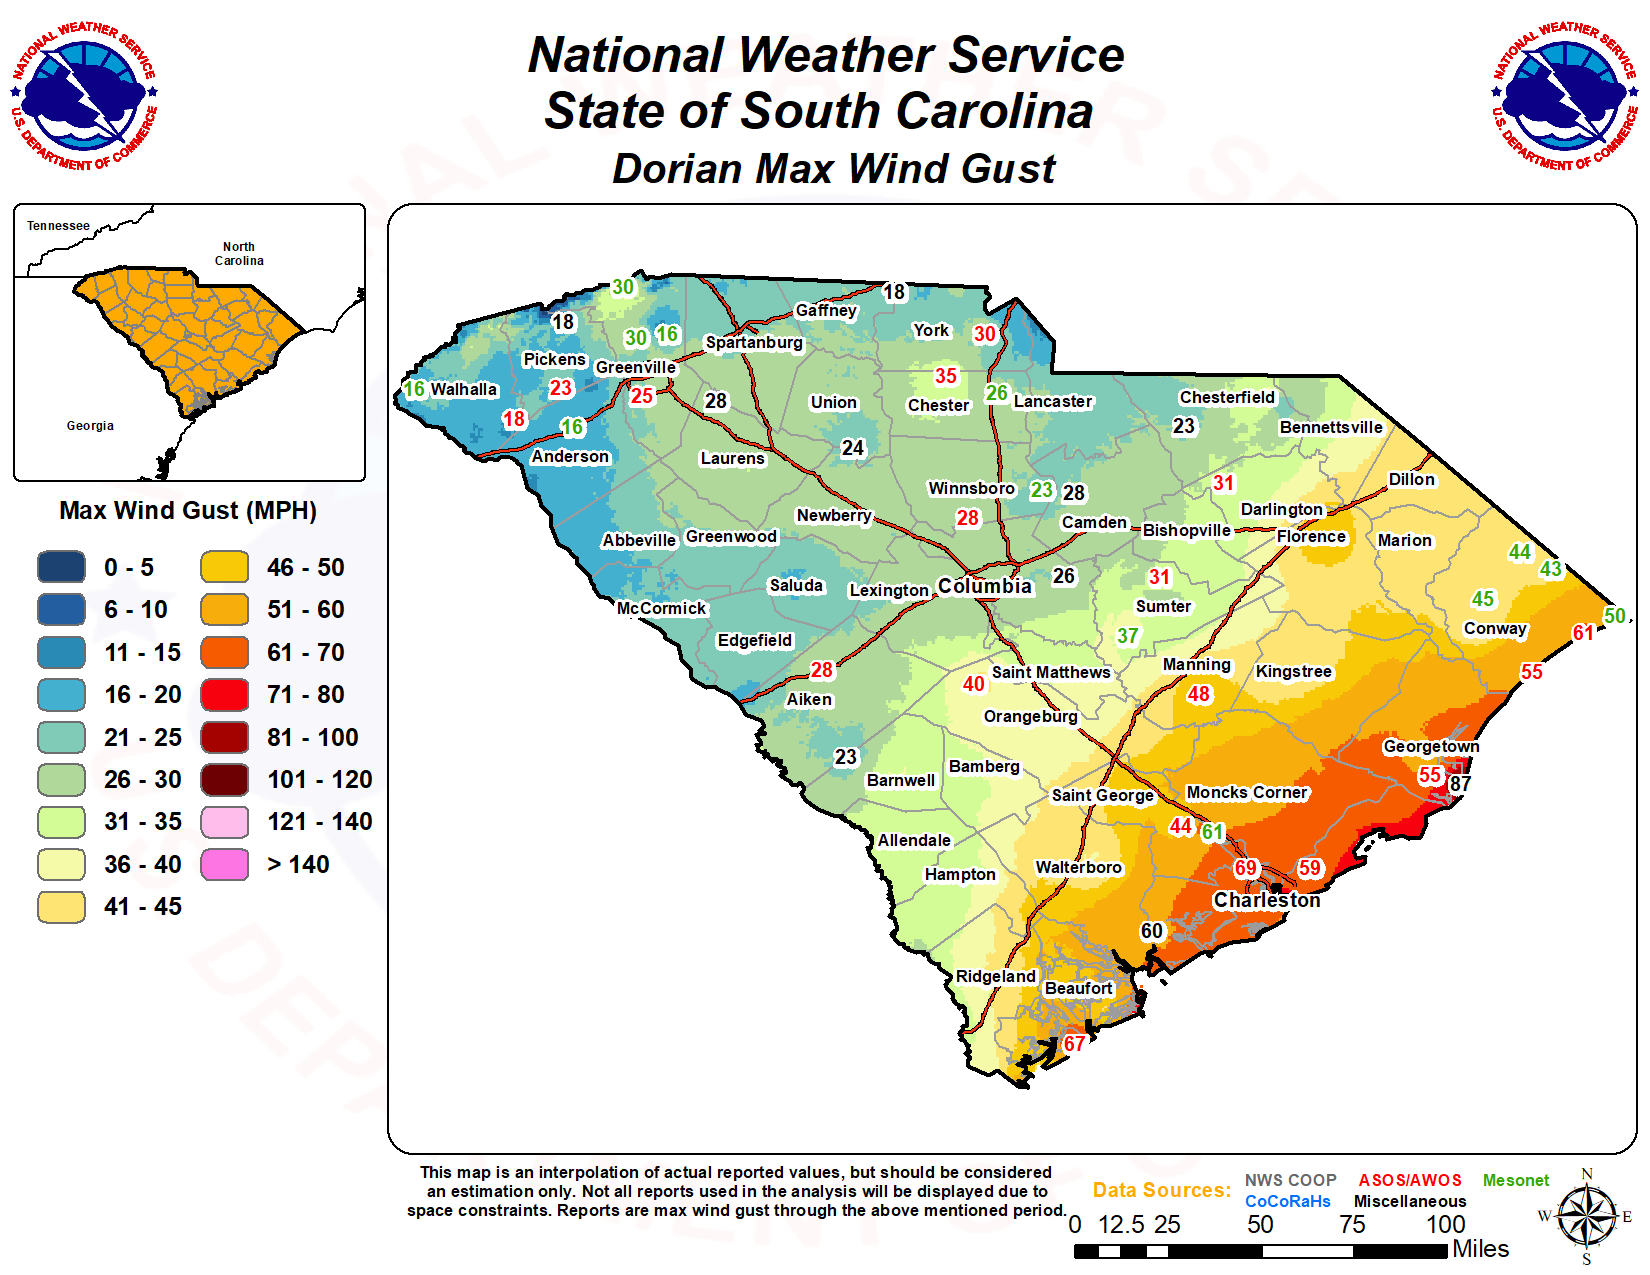
For a map of wind reports across SC, click here.
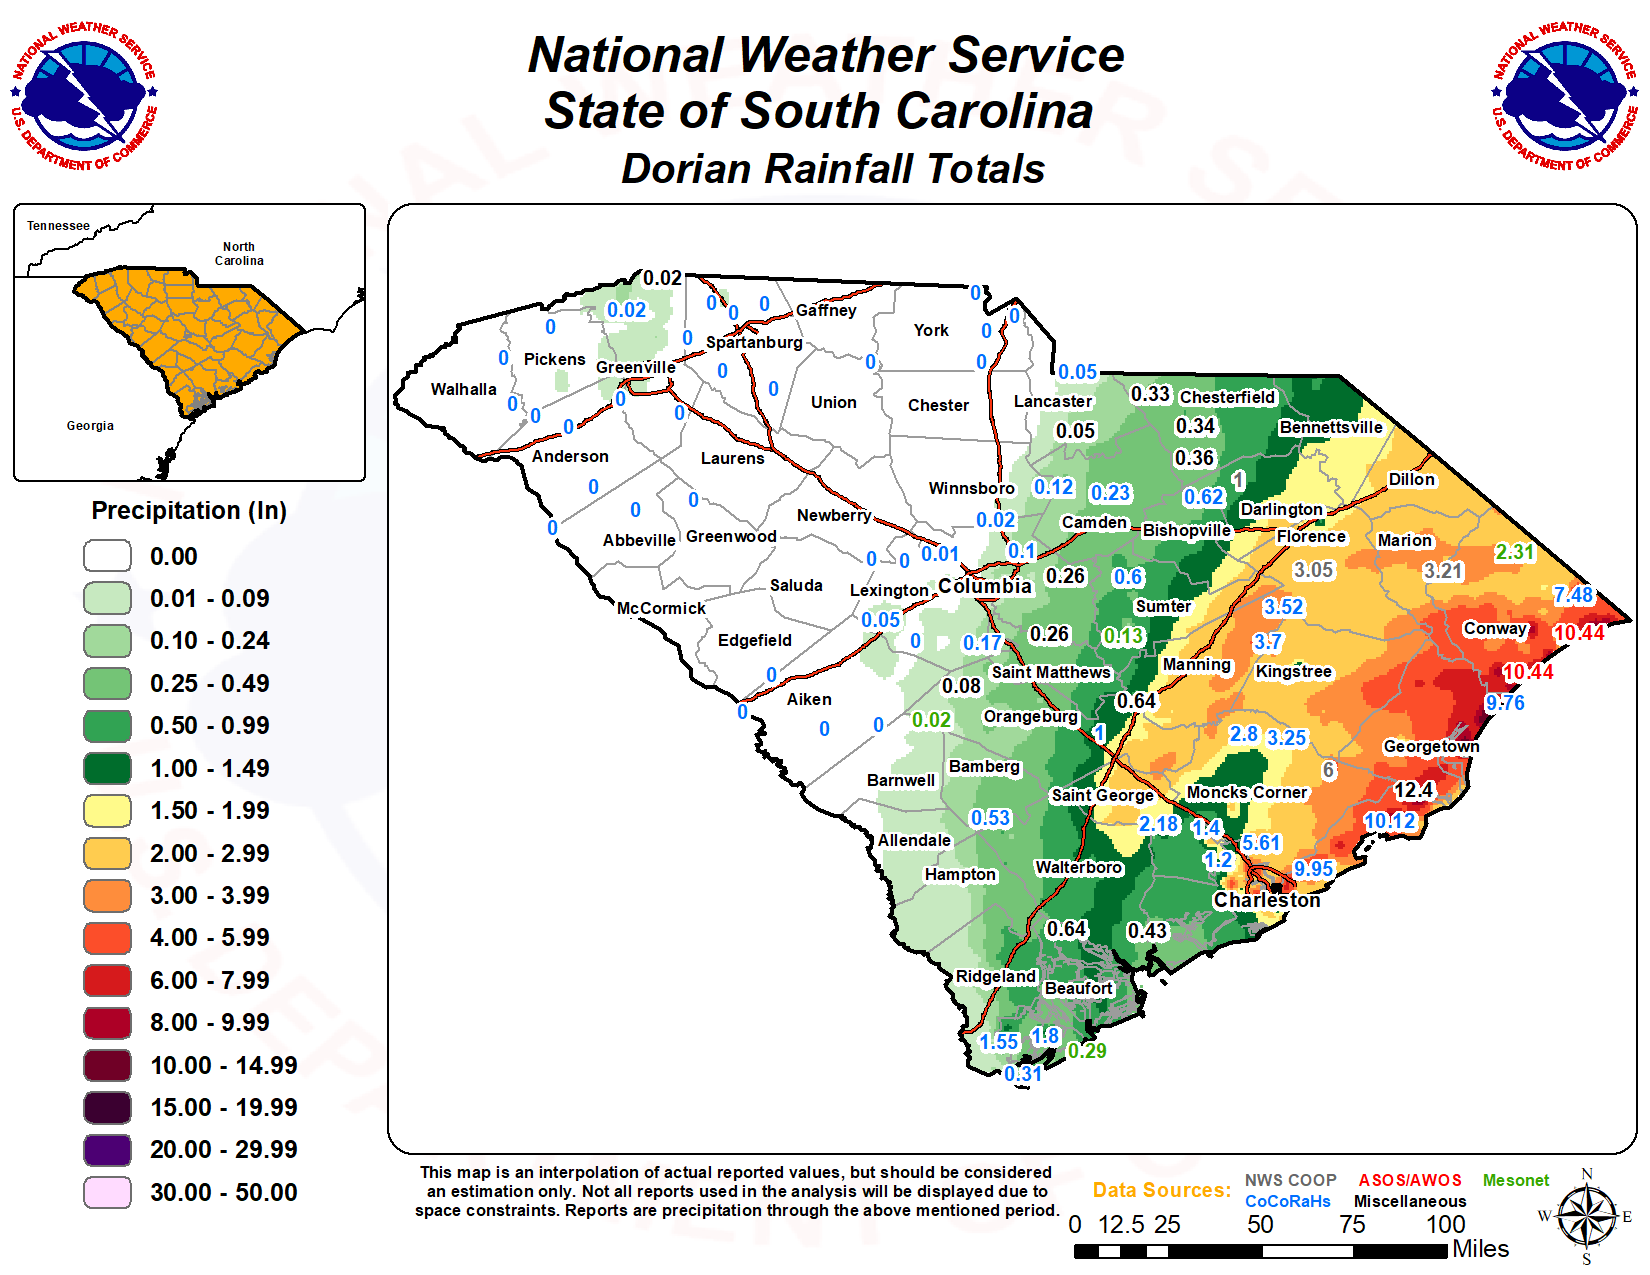
Click on image to enlarge it and access a listing of rainfall reports

For a map of rain reports across SC, click here. Click here for a rainfall analysis from the NWS Weather Prediction Center.
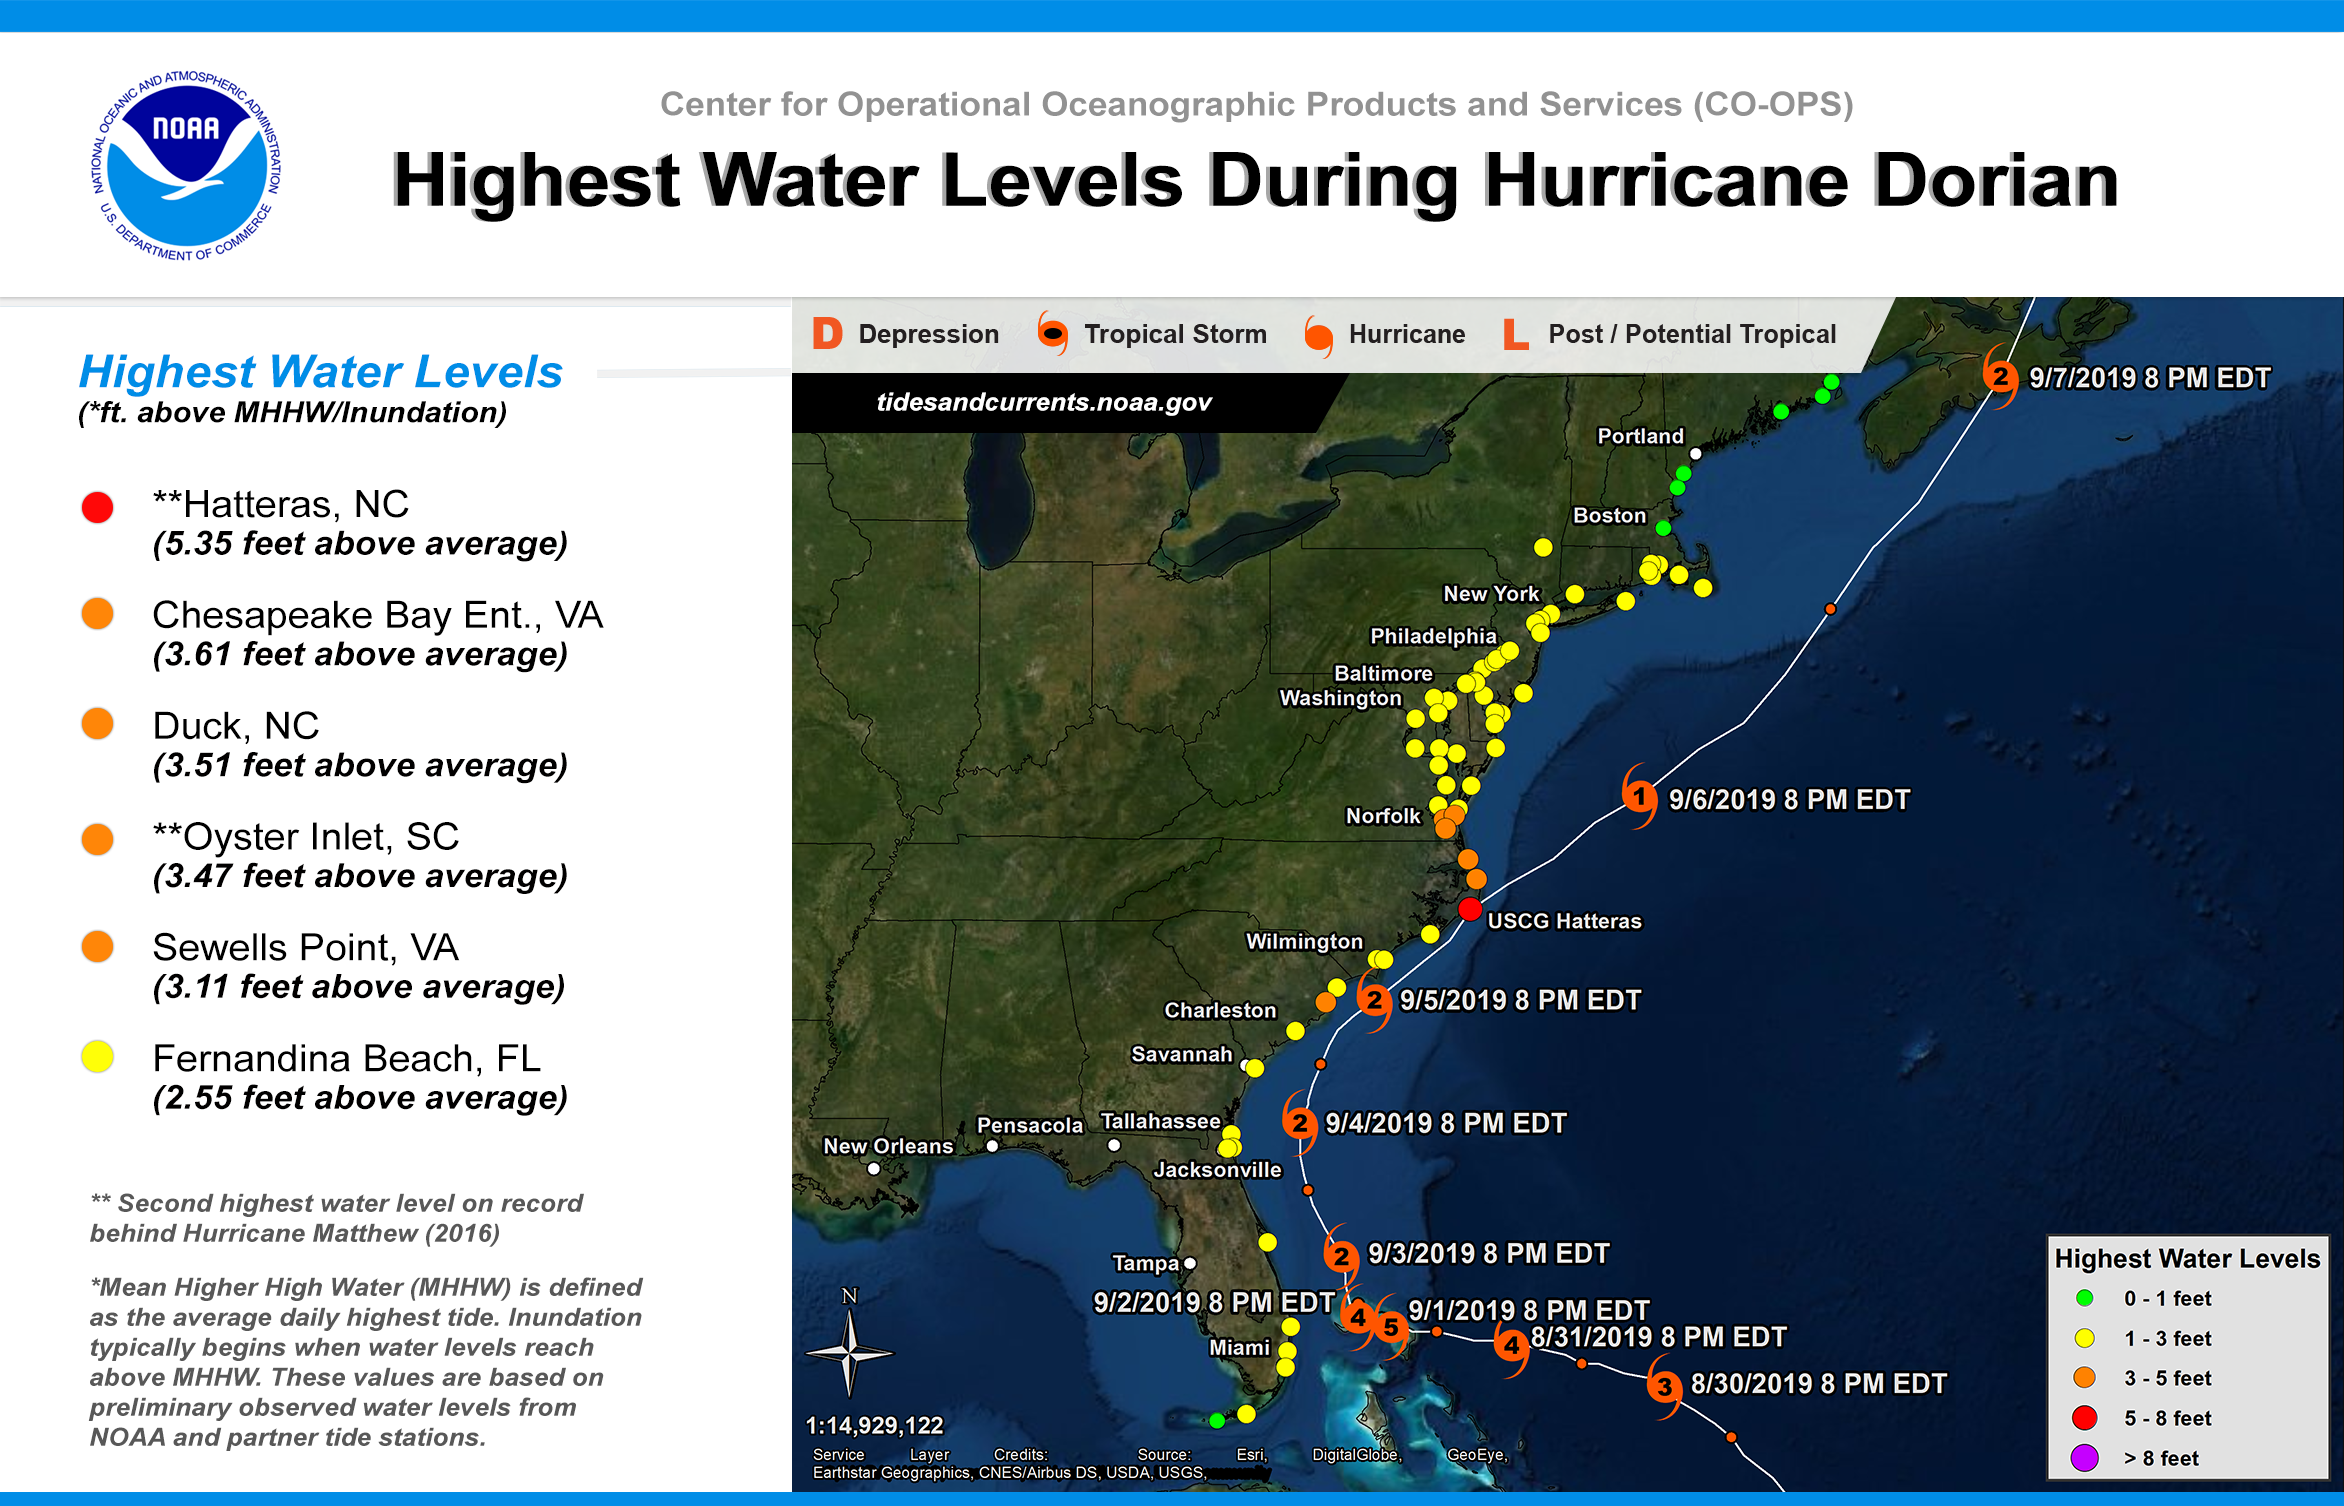
Peak storm surges (i.e., water levels above the astronomical tide) at the Charleston and Fort Pulaski tide gauges were 3 to 3.5 feet. However, storm tides (i.e, combination of astronomical tide and storm surge) were not high enough to produce significant coastal flooding since the peak surge occurred closer to low astronomical tide. Click here for a map showing peak tide levels along the U.S. East Coast. Water level data collected by the U.S. Geological Survey can be found here.
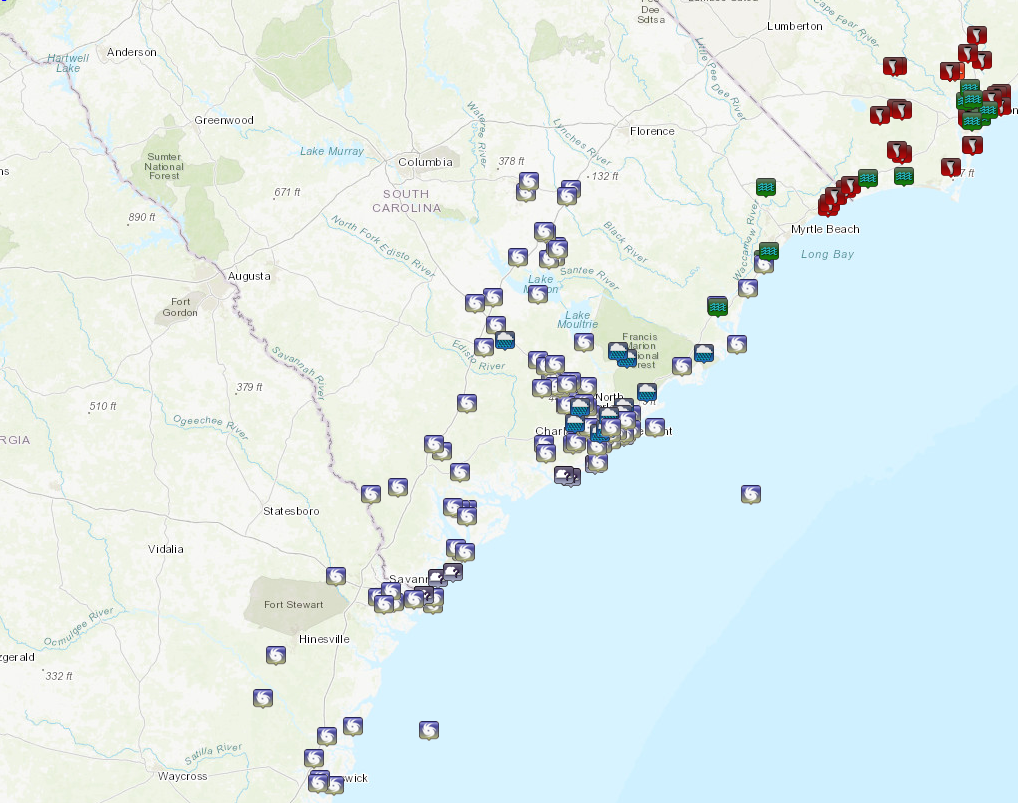
Click on the map above or this link for a list of storm reports
Many trees and power lines fell across the area, mainly near the coast.
Hurricane Dorian Twitter Moment


 Coastal Flood
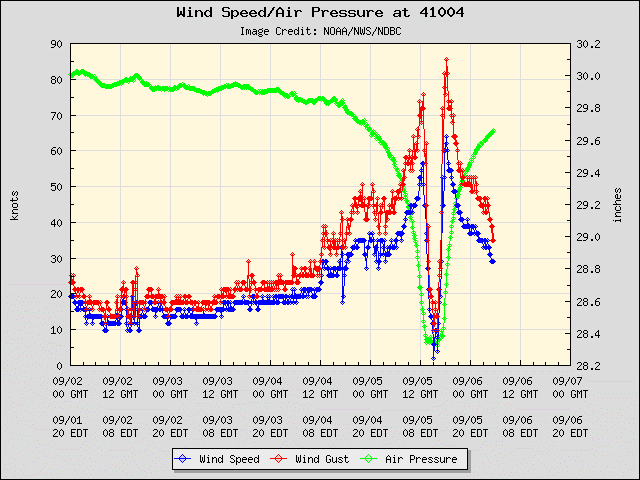