 |
 |
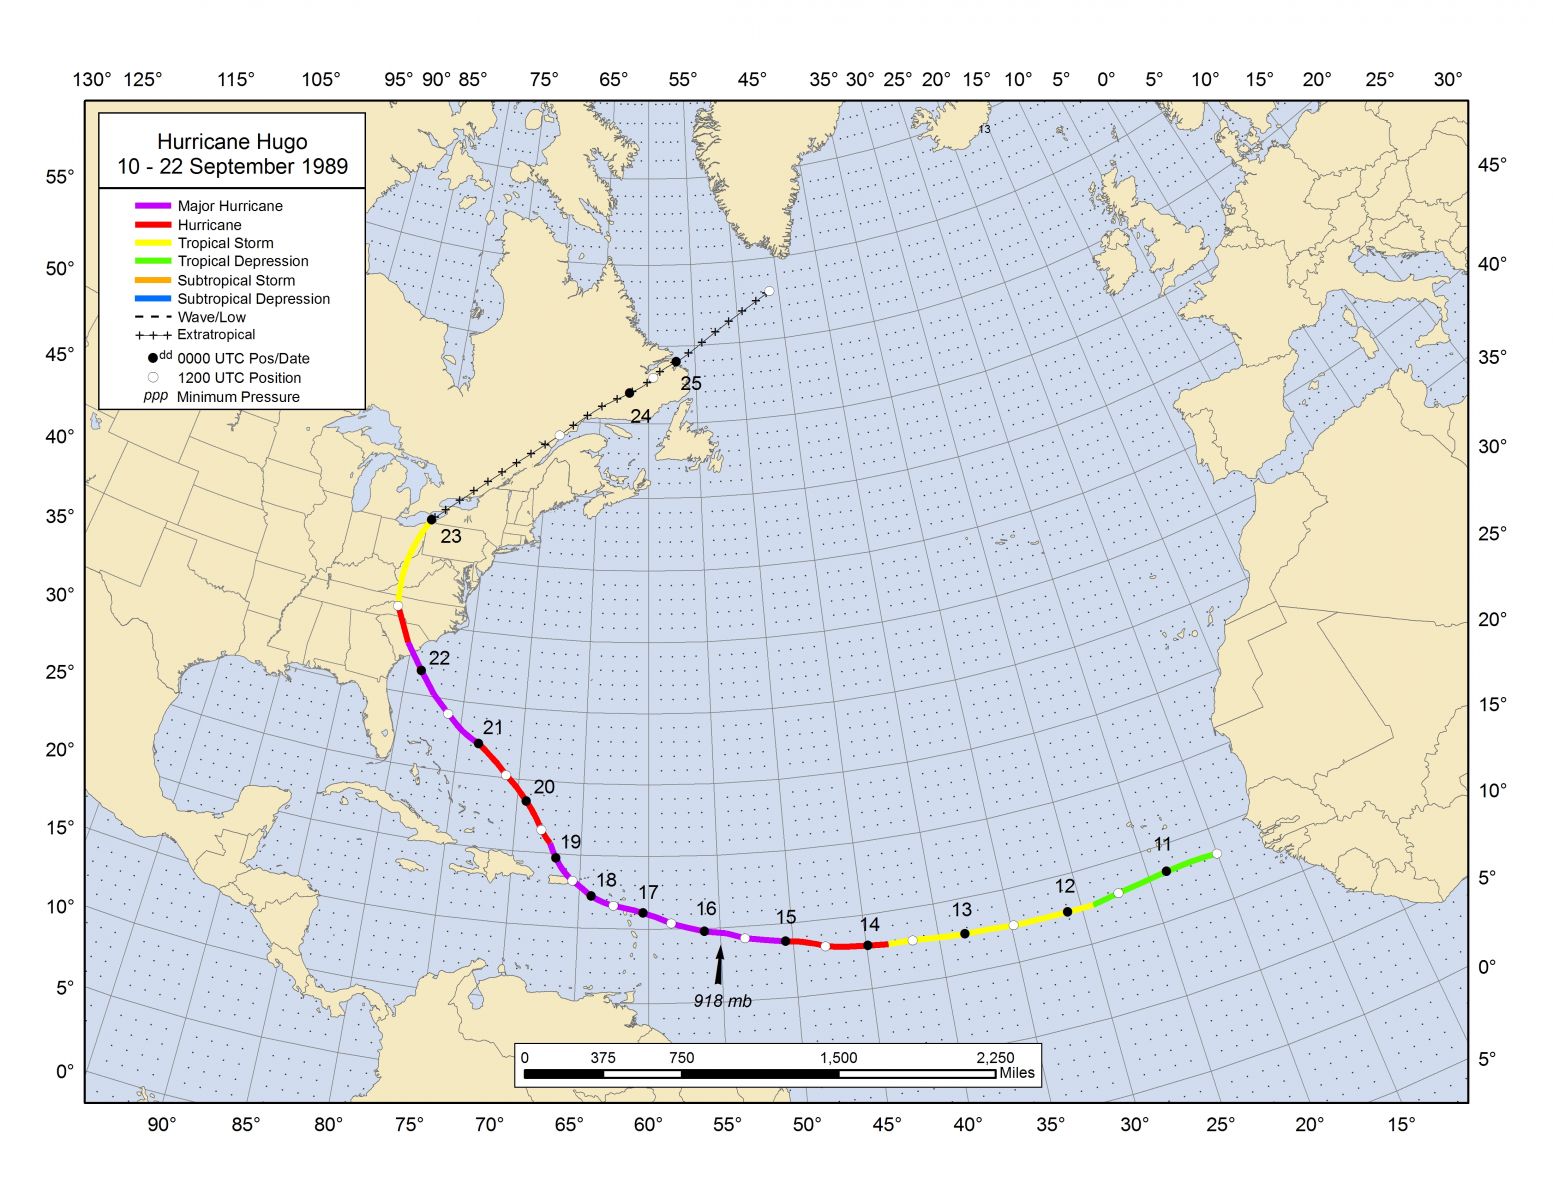
Hurricane Hugo- September 21-22, 1989 |
|
Hurricane Hugo was a Cape Verde hurricane that became a Category 5 (on the Saffir-Simpson Scale) storm in the Atlantic, then raked the northeast Caribbean as a Category 4 storm before turning northwest between an upper-level high pressure system to the north and upper-level low pressure system to the south. Hugo made landfall just north of Charleston, SC at Sullivan's Island around midnight September 22, 1989 as a Category 4 storm with estimated maximum sustained winds of 135-140 mph and a minimum central pressure of 27.58 inches Hg (934 mb). Hugo produced tremendous wind and storm surge damage along the coast as well as significant wind damage well inland with hurricane force wind gusts all the way into western North Carolina. In fact, Hugo produced the highest storm tide heights ever recorded along the U.S. East Coast. At the time, Hurricane Hugo was the strongest storm to strike the United States in the previous 20-year period. The hurricane was also the nation's costliest in terms of monetary losses with approximately $7 billion in damage. It is estimated that there were 49 deaths directly related to the storm, 26 of which occurred in the U.S., Puerto Rico, and the U.S. Virgin Islands.
|
Hugo's Track |
Upper-Level Weather Pattern |
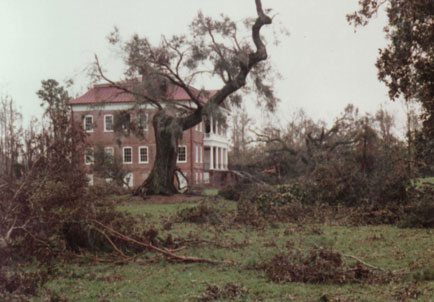
Most buildings in downtown Charleston sustained significant damage, but the worst destruction occurred closer to the landfall in beach towns north of Charleston such as Sullivan's Island and the Isle of Palms where the majority of homes were rendered uninhabitable. Many old trees were toppled by Hugo's winds, including those at Drayton Hall in West Ashley (image 1 / image 2 - images courtesy of Drayton Hall). Major logging operations in the Francis Marion National Forest were permanently ended due to the storm felling more than 1 billion board-feet of lumber (approximately 70% of lumber-quality trees).
Since Hugo made landfall north of Charleston, it spared the city the worst of the impacts as a track slightly farther south would have produced much more flooding in Downtown Charleston. This can clearly be seen in the images below from NOAA's Office for Coastal Management. In addition, the relatively fast motion of Hugo diminished the amount of erosion along the coast. The South Carolina Emergency Management Division (SCEMD) estimated that if a storm with a similar track and intensity as Hugo struck in 2009 there would be $8B in damage in the state with more than 21,000 homes destroyed.
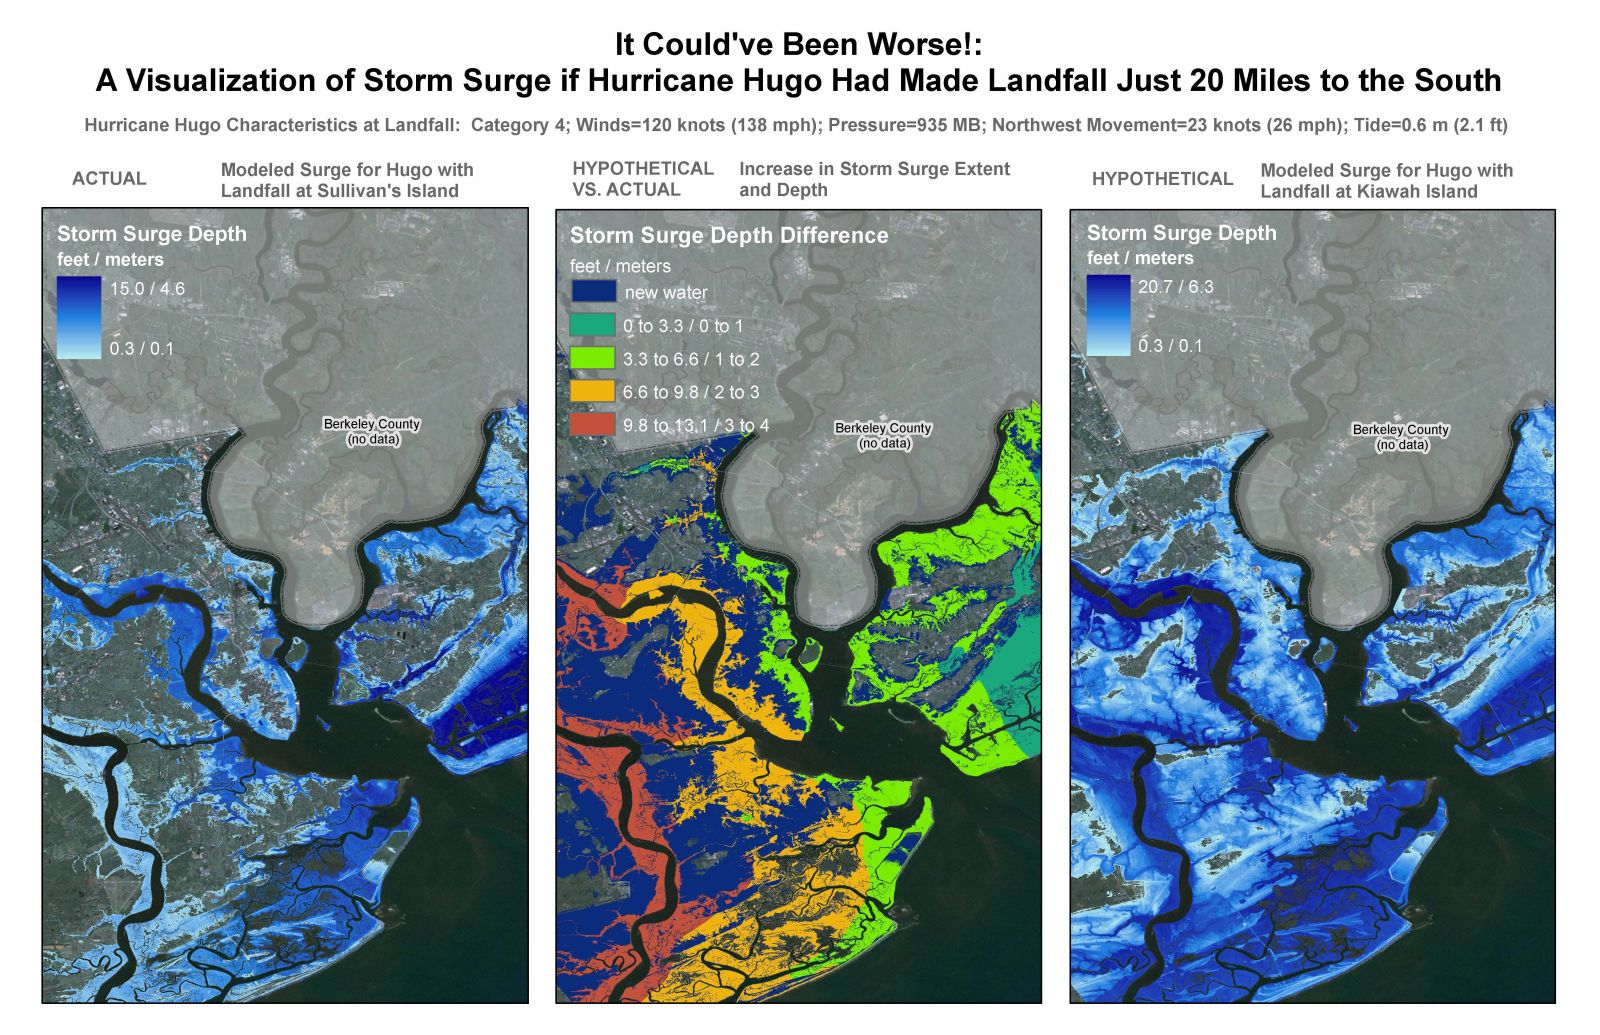 (Credit: NOAA/Office for Coastal Management) |
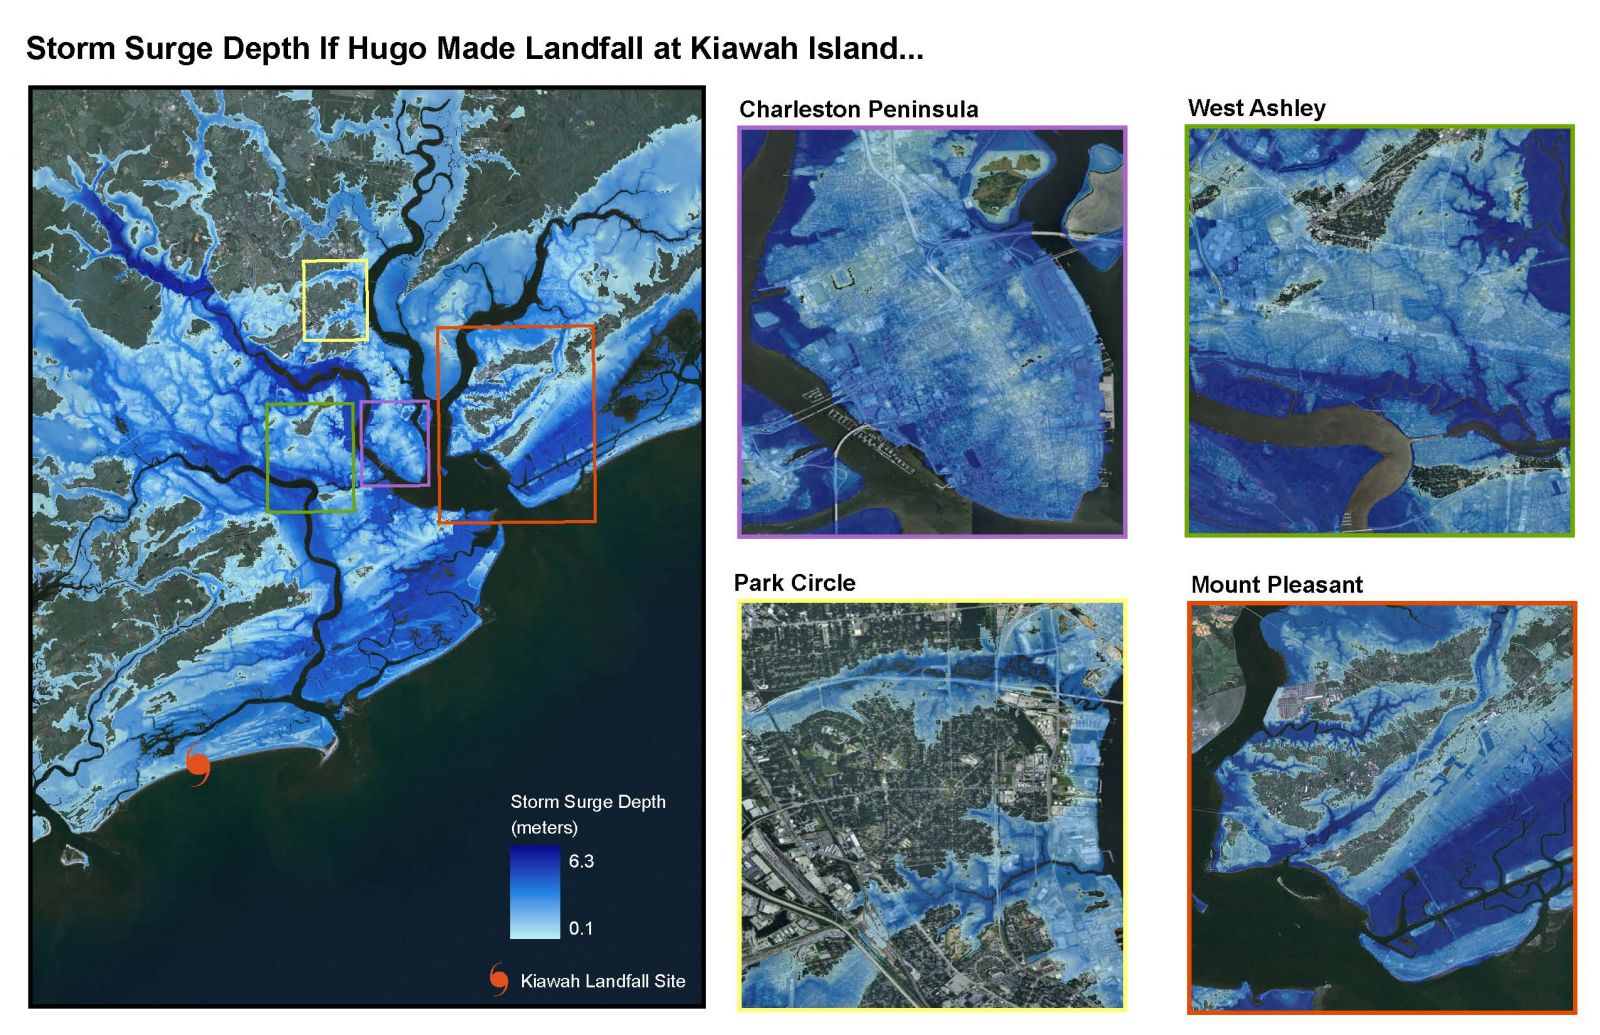 (Credit: NOAA/Office for Coastal Management) |
|
Wind Gusts (mph) Downtown Charleston, SC: 108 mph Folly Beach, SC: 107 mph North Charleston, SC (Airport): 98 mph |
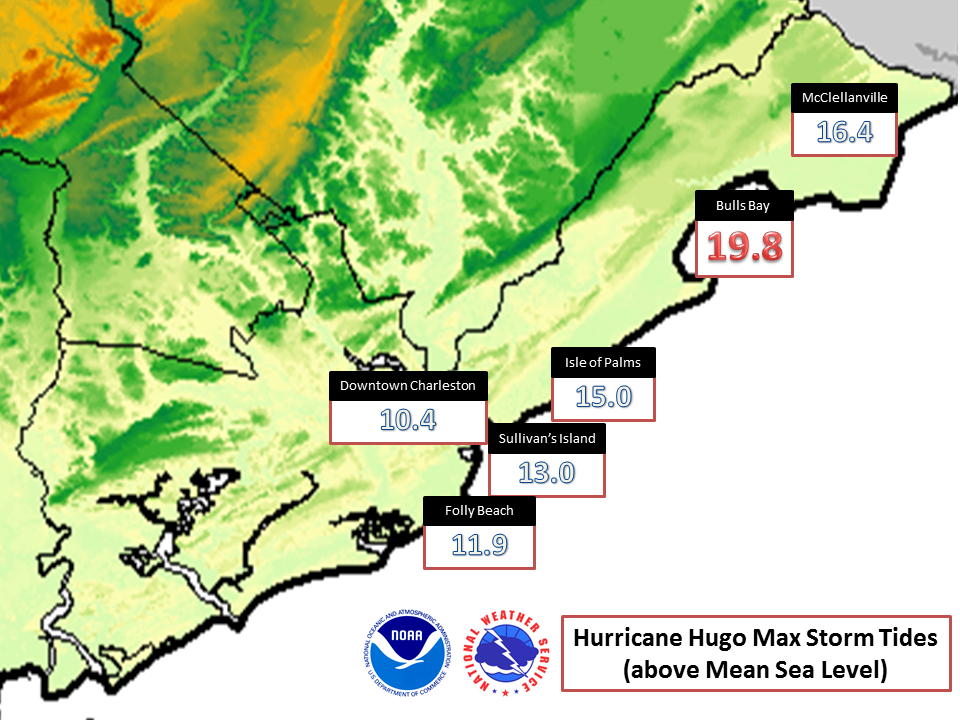
Storm Tides (feet above MSL) |
|
Rainfall (inches) |
Radar
The NWS was using a network of WSR-57 and WSR-74 radars in 1989. Today, the NWS utilizes the WSR-88D network of doppler radars, which have the advantage of providing wind speed/direction data in addition to reflectivity data. This information is crucial to hurricane forecasters as storms near land to help them assess the maximum winds.
Satellite
Today there are many more satellites than there were back in 1989, all of which include much more sophisticated equipment to monitor and measure the atmosphere, particularly winds and moisture. Microwave satellite imagery, which can "see" through clouds, is now utilized by hurricane forecasters to ascertain information on a tropical cyclone's structure.
Reconnaissance Aircraft
"Hurricane Hunters" regularly fly into potential and existing tropical cyclones to collect data in and near the storm to aid in hurricane forecasting, including information on storm size, structure, and development. Although such missions existed in 1989 they were not nearly as frequent as they are today.
Hurricane Forecasting
Improvements in observing systems such as satellites, buoys, and aircraft reconnaissance, and upgrades to numerical weather prediction models have led to improvements in hurricane forecasting. For example, the National Hurricane Center's average 72-hour track error in 1989 was ~300 nautical miles compared to ~100 nautical miles as of 2018. This is significant considering it costs ~$1 million to evacuate every 1 mile of coastline!
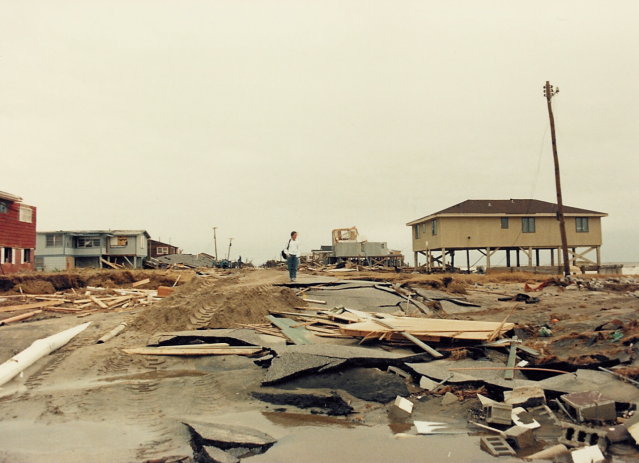 Damage at Folly Beach, SC (Credit: McKevlins Surf Shop) |
 Damage at Isle of Palms, SC (Credit: The State Newspaper) |
|
(Credit: Drayton Hall Plantation)
|
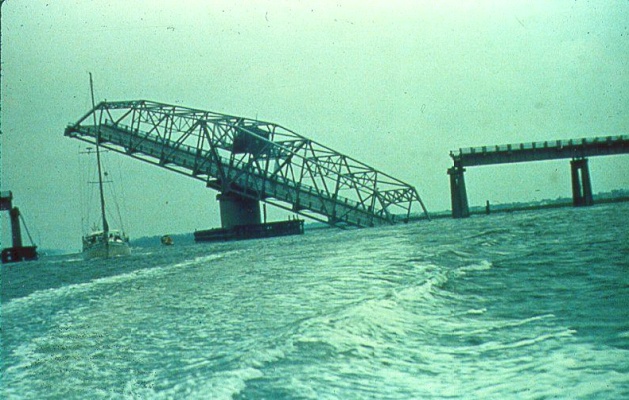 Damage to Ben Sawyer Bridge between Mount Pleasant and Sullivan's Island, SC (Credit: NOAA) |


 Coastal Flood