A significant heat wave continues for the Rockies, Northern Plains, and Great Lakes into the Mid-Atlantic, peaking in intensity through midweek and lingering across parts of the Northern Plains and Midwest until this weekend. Excessive rainfall my bring life-threatening and locally catastrophic flash and urban flooding across portions of southwestern Texas through early Friday. Read More >
| Climate/Almanac Data - Jan Normals - Jan Records | |||||||||||||||||||||||||||||||||||||||||||||||||||||||||||||||||||||||||||
| JANUARY | |||||||||||||||||||||||||||||||||||||||||||||||||||||||||||||||||||||||||||
|
|||||||||||||||||||||||||||||||||||||||||||||||||||||||||||||||||||||||||||
| The ranking is listed in parentheses (__) when within the "Top 10". | |||||||||||||||||||||||||||||||||||||||||||||||||||||||||||||||||||||||||||
|
|||||||||||||||||||||||||||||||||||||||||||||||||||||||||||||||||||||||||||
| Please see Jan Records for monthly record information. | |||||||||||||||||||||||||||||||||||||||||||||||||||||||||||||||||||||||||||
|
|||||||||||||||||||||||||||||||||||||||||||||||||||||||||||||||||||||||||||
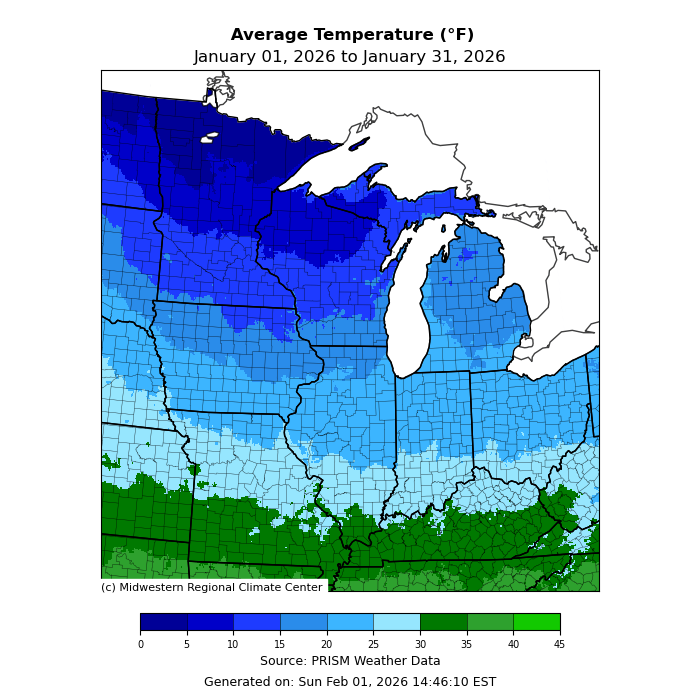
| The climate maps below are courtesy of the Northeast Regional Climate Center and Midwest Regional Climate Center. | |||||||||||||||||||||||||||||||||||||||||||||||||||||||||||||||||||||||||||
| These maps should update to the most recent "last month" on the first of the month. | |||||||||||||||||||||||||||||||||||||||||||||||||||||||||||||||||||||||||||
|
|||||||||||||||||||||||||||||||||||||||||||||||||||||||||||||||||||||||||||
| A LOOK AHEAD | |||||||||||||||||||||||||||||||||||||||||||||||||||||||||||||||||||||||||||
| For more information on the Climate Outlooks, see the Climate Prediction Center. | |||||||||||||||||||||||||||||||||||||||||||||||||||||||||||||||||||||||||||
|
|||||||||||||||||||||||||||||||||||||||||||||||||||||||||||||||||||||||||||