
A few severe thunderstorms with large hail and damaging winds are possible this evening into tonight from eastern Kansas into western and central Missouri. Thunderstorms with heavy to excessive rainfall may produce flooding through tonight over parts of the northern High Plains, central Missouri, and along the Florida/Georgia line. Read More >
| Climate/Almanac Data - Feb Normals - Feb Records | ||||||||||||||||||||||||||||||||||||||||||||||||||||||||||||||||||||||||||||||||||
| FEBRUARY | ||||||||||||||||||||||||||||||||||||||||||||||||||||||||||||||||||||||||||||||||||
The ranking is listed in parentheses (__) when within the "Top 10".
|
||||||||||||||||||||||||||||||||||||||||||||||||||||||||||||||||||||||||||||||||||
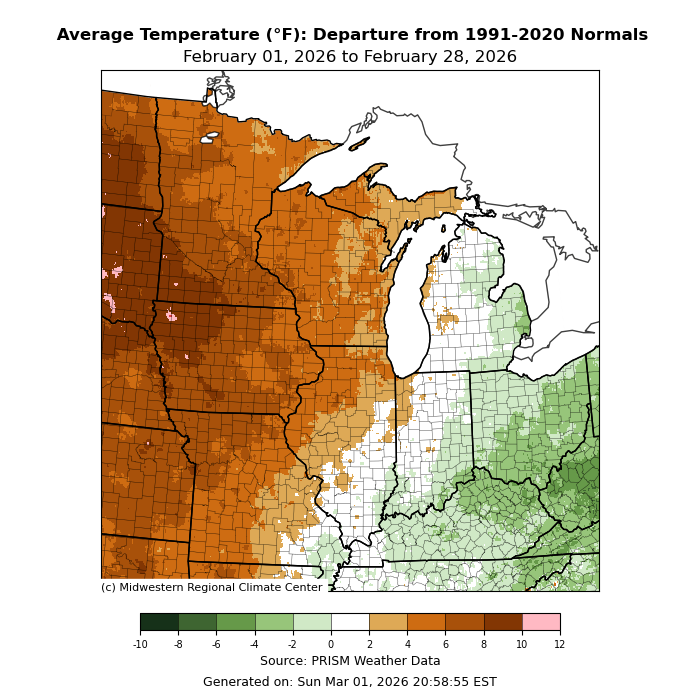
| February 2026 was about 4.6 to 7.2 degrees below normal. | ||||||||||||||||||||||||||||||||||||||||||||||||||||||||||||||||||||||||||||||||||
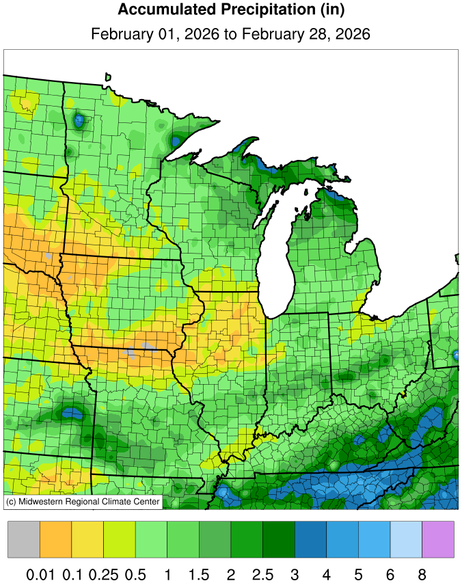
| Precipitation totals were about 0.8 to 1.8 inches below normal. Moline had the driest February on record and Dubuque was the 9th driest on record. | ||||||||||||||||||||||||||||||||||||||||||||||||||||||||||||||||||||||||||||||||||
| Snowfall totals were about 8.1 to 8.4 inches below normal. Moline was tied for 4th least snowy February with 1998. | ||||||||||||||||||||||||||||||||||||||||||||||||||||||||||||||||||||||||||||||||||
| Please see Feb Records for monthly record information. | ||||||||||||||||||||||||||||||||||||||||||||||||||||||||||||||||||||||||||||||||||
| The climate maps below are courtesy of the High Plains and Midwest Regional Climate Centers. | ||||||||||||||||||||||||||||||||||||||||||||||||||||||||||||||||||||||||||||||||||
| Some of these maps become available during the afternoon on the first of the month. | ||||||||||||||||||||||||||||||||||||||||||||||||||||||||||||||||||||||||||||||||||
|
||||||||||||||||||||||||||||||||||||||||||||||||||||||||||||||||||||||||||||||||||
| Climate/Almanac Data - Winter Normals - Winter Records | ||||||||||||||||||||||||||||||||||||||||||||||||||||||||||||||||||||||||||||||||||
| WINTER (DEC-FEB) |
||||||||||||||||||||||||||||||||||||||||||||||||||||||||||||||||||||||||||||||||||
|
||||||||||||||||||||||||||||||||||||||||||||||||||||||||||||||||||||||||||||||||||
|
The ranking is listed in parentheses (__) when within the "Top 10".
|
||||||||||||||||||||||||||||||||||||||||||||||||||||||||||||||||||||||||||||||||||
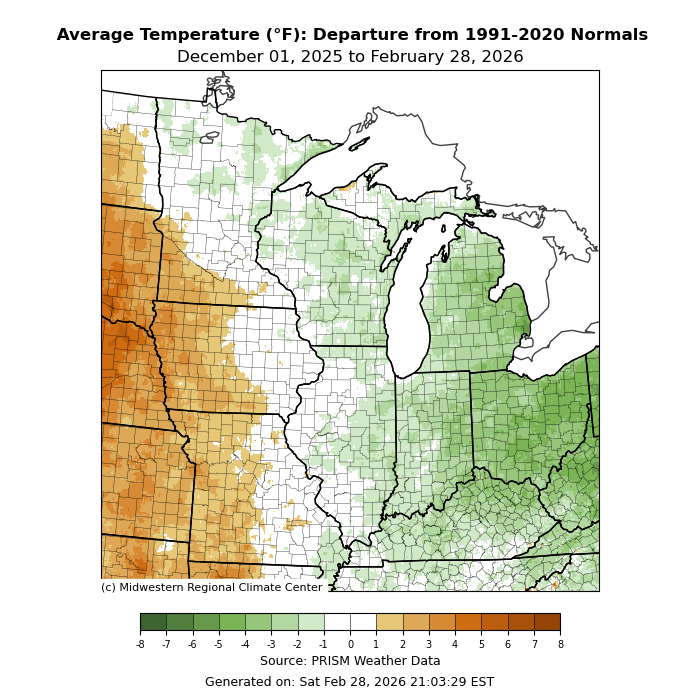
| Winter 2025-2026 was near normal to 1.0 degree above normal for average temperature | ||||||||||||||||||||||||||||||||||||||||||||||||||||||||||||||||||||||||||||||||||
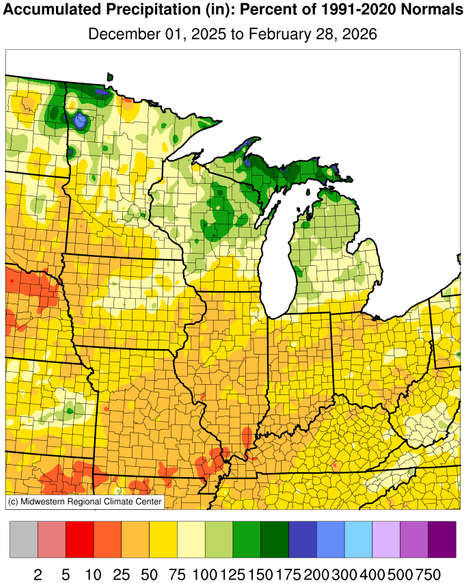
| Precipitation totals were about 1.5 to about 3.1 inches below normal. | ||||||||||||||||||||||||||||||||||||||||||||||||||||||||||||||||||||||||||||||||||
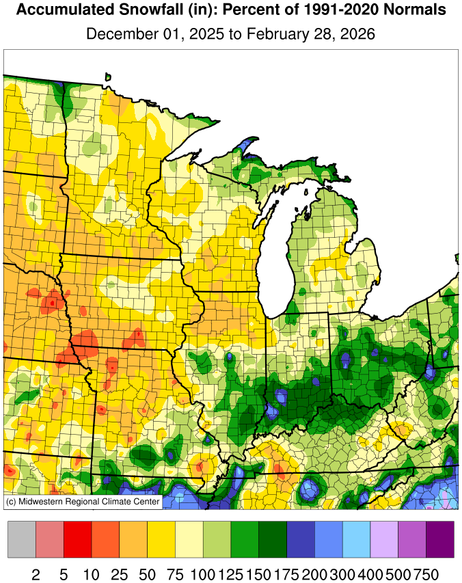
| Snowfall totals were about 13 to 16.7 inches below normal. | ||||||||||||||||||||||||||||||||||||||||||||||||||||||||||||||||||||||||||||||||||
| Please see Winter Records for seasonal record information. | ||||||||||||||||||||||||||||||||||||||||||||||||||||||||||||||||||||||||||||||||||
| The climate maps below are courtesy of the High Plains and Midwest Regional Climate Centers. | ||||||||||||||||||||||||||||||||||||||||||||||||||||||||||||||||||||||||||||||||||
| Some of these maps become available during the afternoon on the first of the month. | ||||||||||||||||||||||||||||||||||||||||||||||||||||||||||||||||||||||||||||||||||
|
||||||||||||||||||||||||||||||||||||||||||||||||||||||||||||||||||||||||||||||||||
| A LOOK AHEAD | ||||||||||||||||||||||||||||||||||||||||||||||||||||||||||||||||||||||||||||||||||
|
||||||||||||||||||||||||||||||||||||||||||||||||||||||||||||||||||||||||||||||||||
|
|
||||||||||||||||||||||||||||||||||||||||||||||||||||||||||||||||||||||||||||||||||


.png)
.png)

.png)
.png)


