Scattered strong to severe storms capable of sporadic large hail and severe winds are expected this afternoon and evening across portions of western Texas. Widespread showers and thunderstorms may produce isolated flash flooding across the Ozarks today and the Southeast into next week. Read More >
| Climate/Almanac Data - Mar Normals - Mar Records | |||||||||||||||||||||||||||||||||||||||||||||||||||||||||||||||||||||||||||
| MARCH | |||||||||||||||||||||||||||||||||||||||||||||||||||||||||||||||||||||||||||
|
|||||||||||||||||||||||||||||||||||||||||||||||||||||||||||||||||||||||||||
| The ranking is listed in parentheses (__) when within the "Top 10". | |||||||||||||||||||||||||||||||||||||||||||||||||||||||||||||||||||||||||||
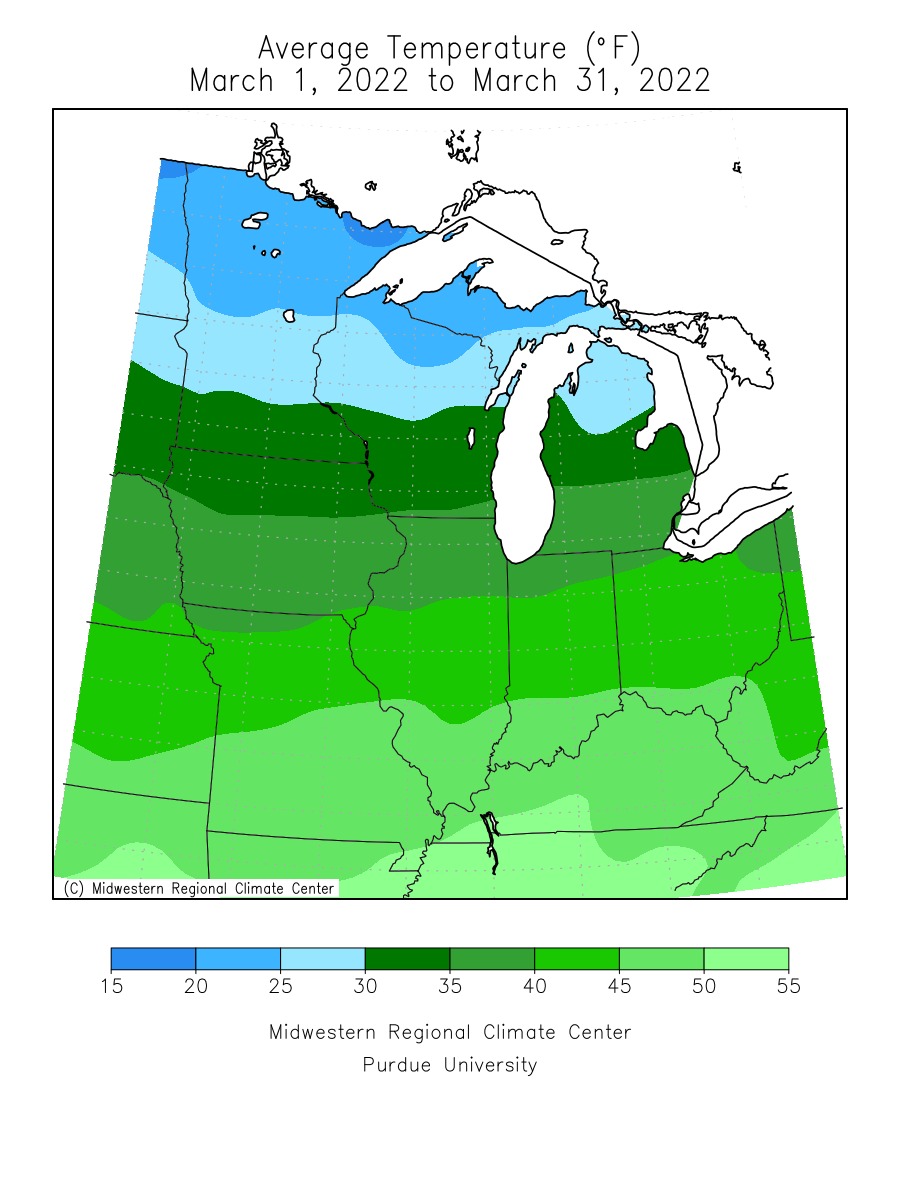
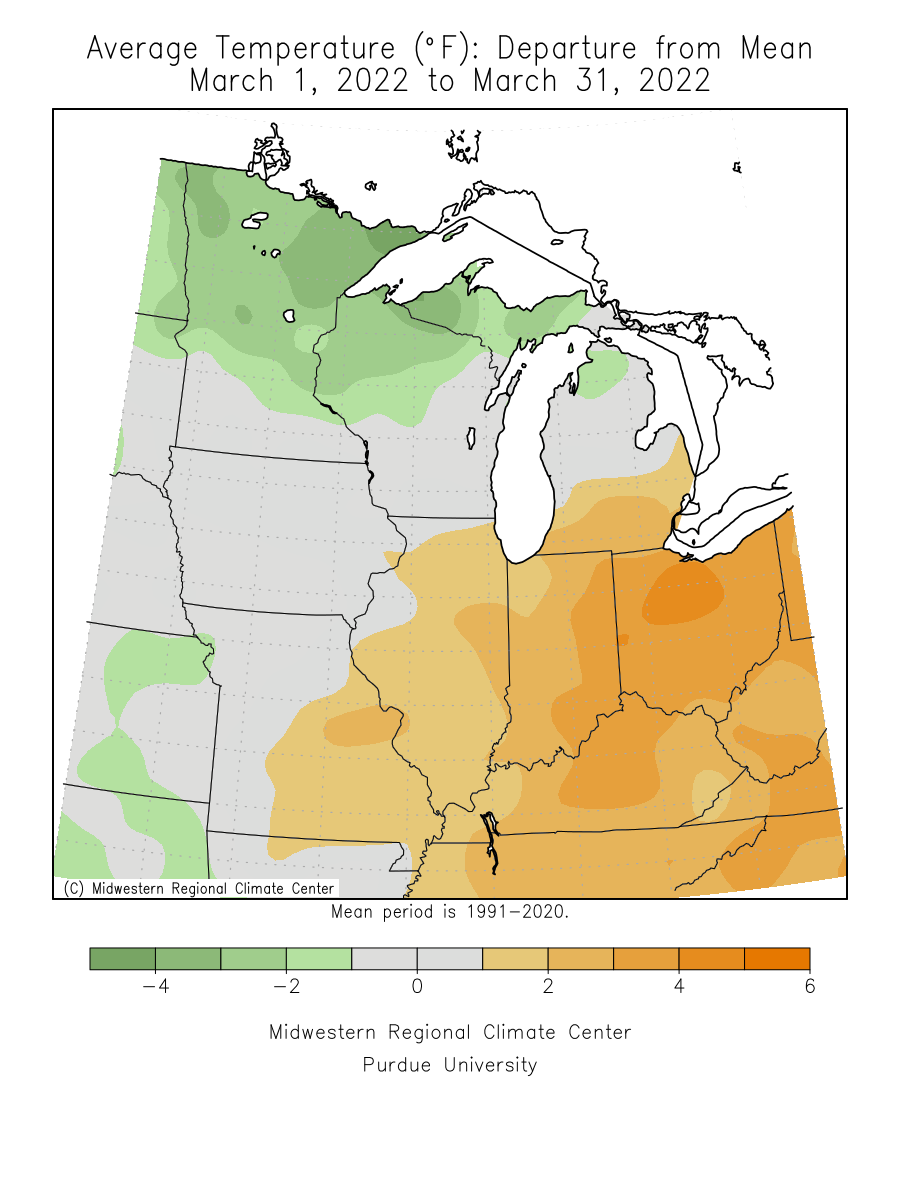
| March 2022 was just about normal in regards to the average temperature. | |||||||||||||||||||||||||||||||||||||||||||||||||||||||||||||||||||||||||||
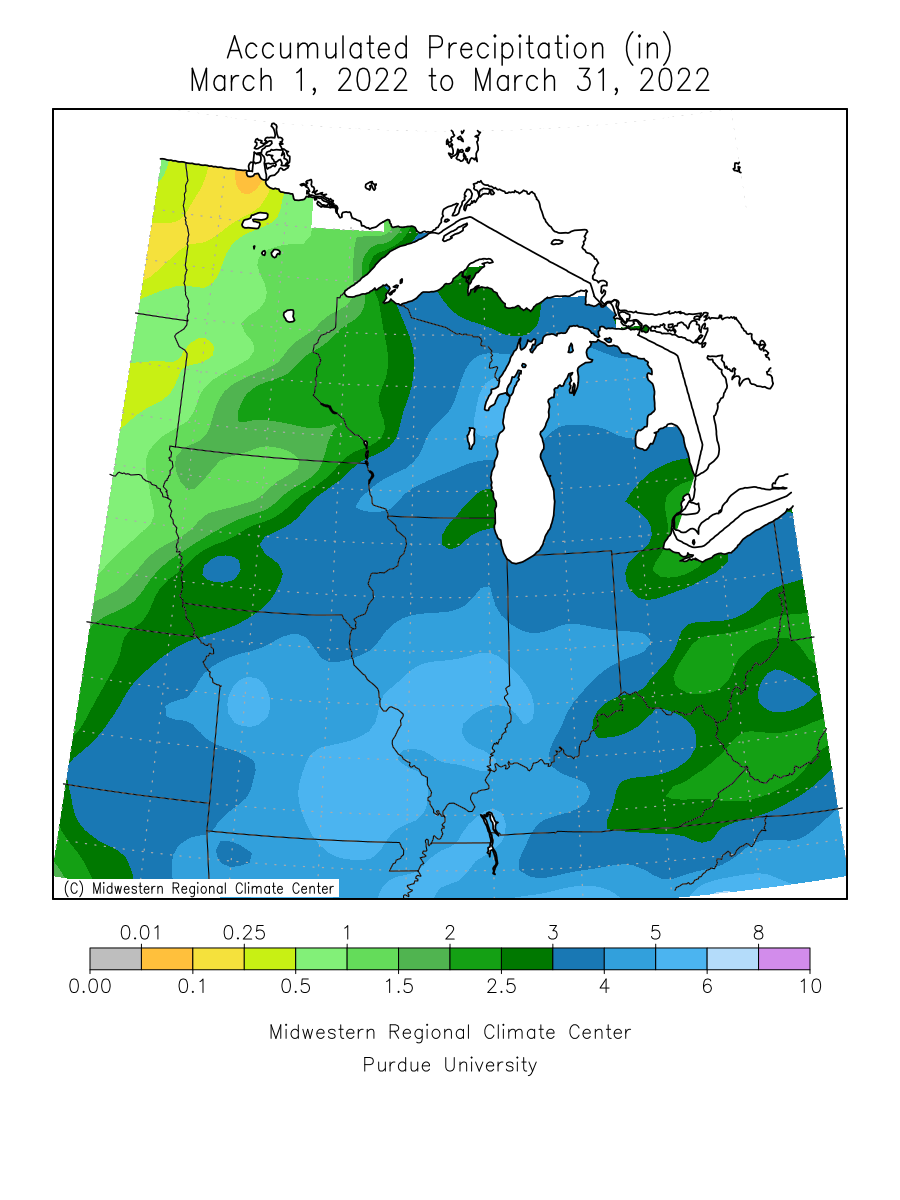
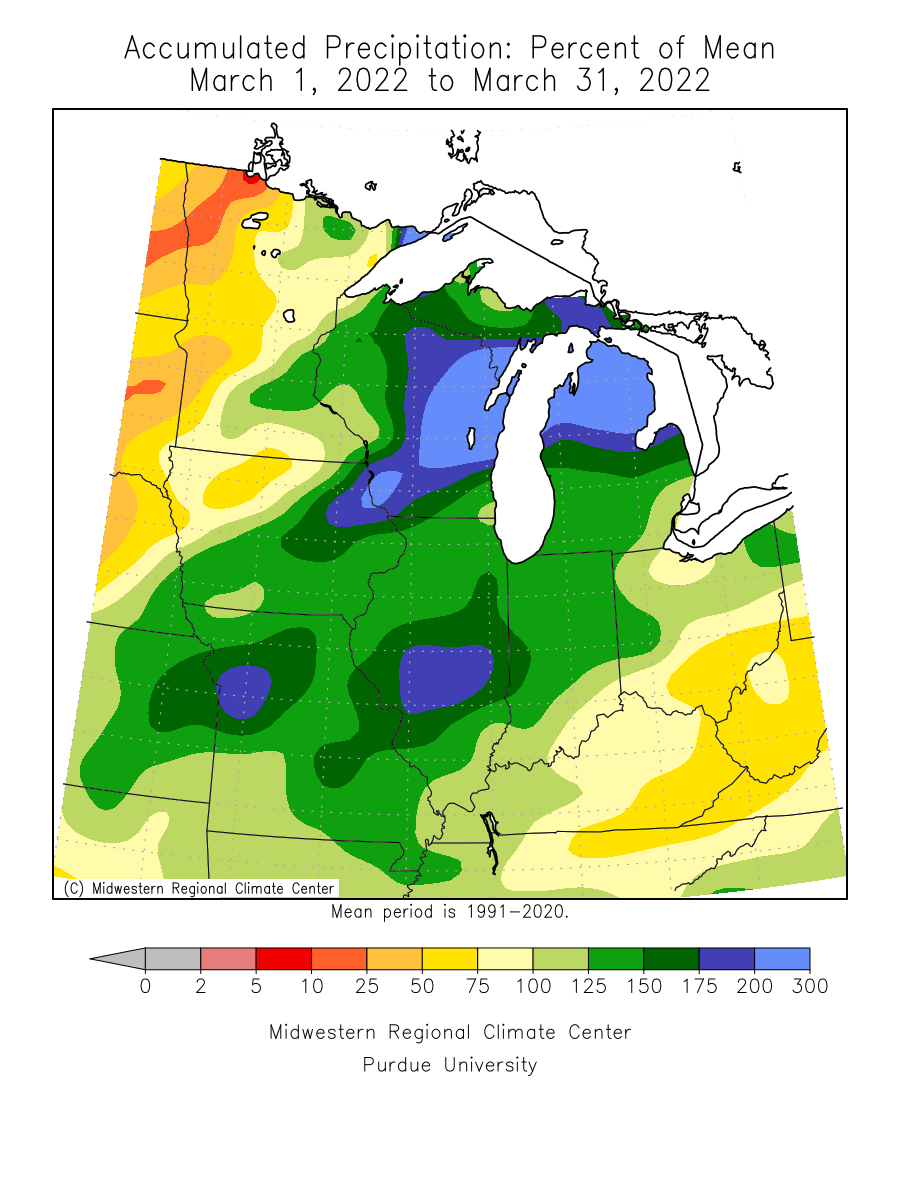
| Precipitation totals for March 2022 were about normal to around three quarters of an inch above normal. | |||||||||||||||||||||||||||||||||||||||||||||||||||||||||||||||||||||||||||
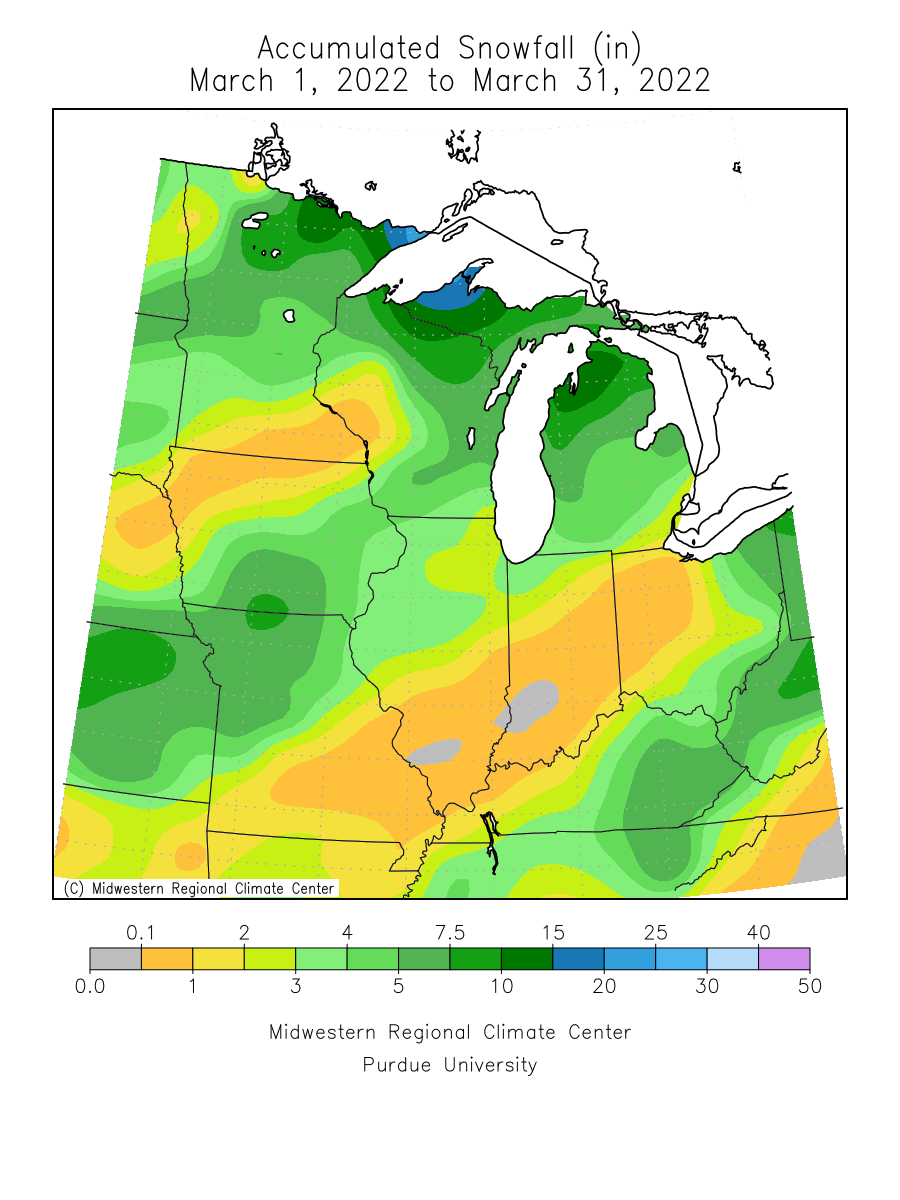
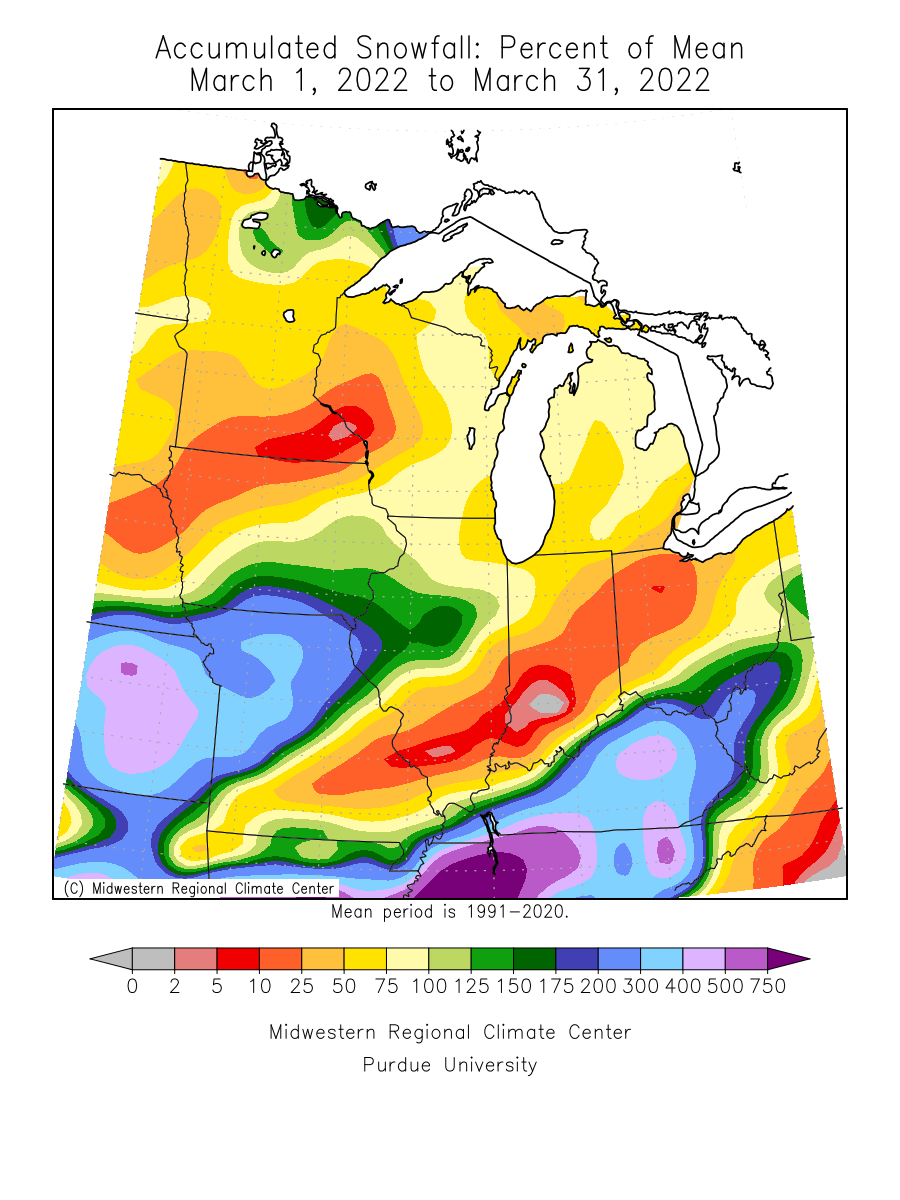
| Snowfall totals for March 2022 were about normal to 1 inch below normal. | |||||||||||||||||||||||||||||||||||||||||||||||||||||||||||||||||||||||||||
| Please see Mar Records for monthly record information. | |||||||||||||||||||||||||||||||||||||||||||||||||||||||||||||||||||||||||||
| The climate maps below are courtesy of the Midwest Regional Climate Center. | |||||||||||||||||||||||||||||||||||||||||||||||||||||||||||||||||||||||||||
| These maps become available around 10am on the first of the month. | |||||||||||||||||||||||||||||||||||||||||||||||||||||||||||||||||||||||||||
|
|||||||||||||||||||||||||||||||||||||||||||||||||||||||||||||||||||||||||||
| A LOOK AHEAD | |||||||||||||||||||||||||||||||||||||||||||||||||||||||||||||||||||||||||||
|
|||||||||||||||||||||||||||||||||||||||||||||||||||||||||||||||||||||||||||