Wildfire smoke continues to impact air quality from the Great Lakes region into New England and the Mid-Atlantic today with widespread Air Quality Alerts in effect. Severe thunderstorms are expected across portions of the Ohio Valley and Lower Great Lakes into the Mid-Atlantic and Northeast, this afternoon into the evening. Monsoonal thunderstorms may bring areas of flooding to the Southwest. Read More >
| Climate/Almanac Data - May Normals - May Records | ||||||||||||||||||||||||||||||||||||||||||||||||||||||||||||||||||||||||||||||||||
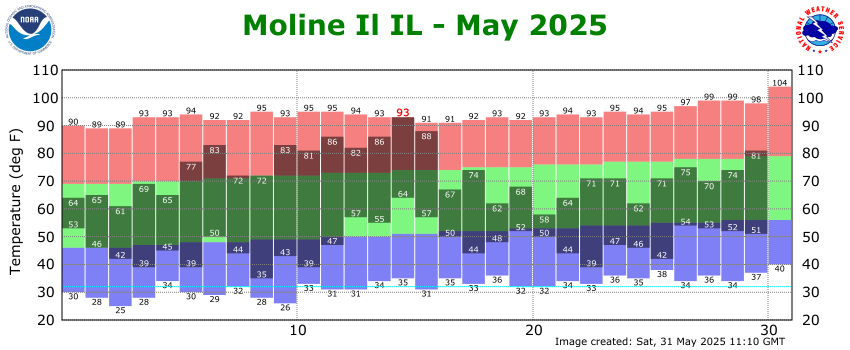
| May | ||||||||||||||||||||||||||||||||||||||||||||||||||||||||||||||||||||||||||||||||||
The ranking is listed in parentheses (__) when within the "Top 10".
|
||||||||||||||||||||||||||||||||||||||||||||||||||||||||||||||||||||||||||||||||||
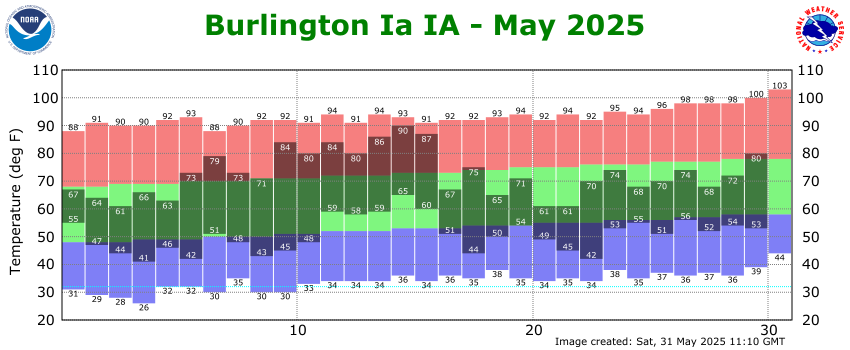
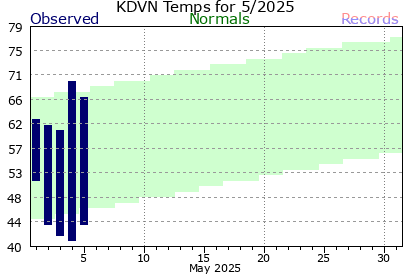
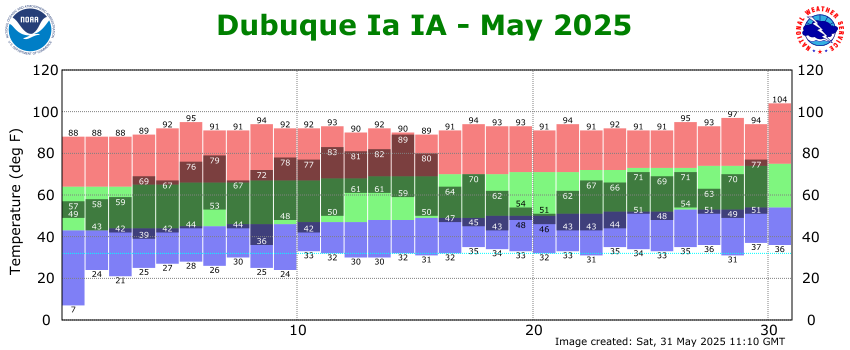
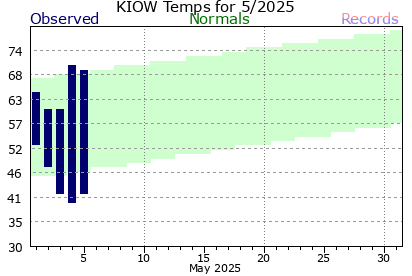
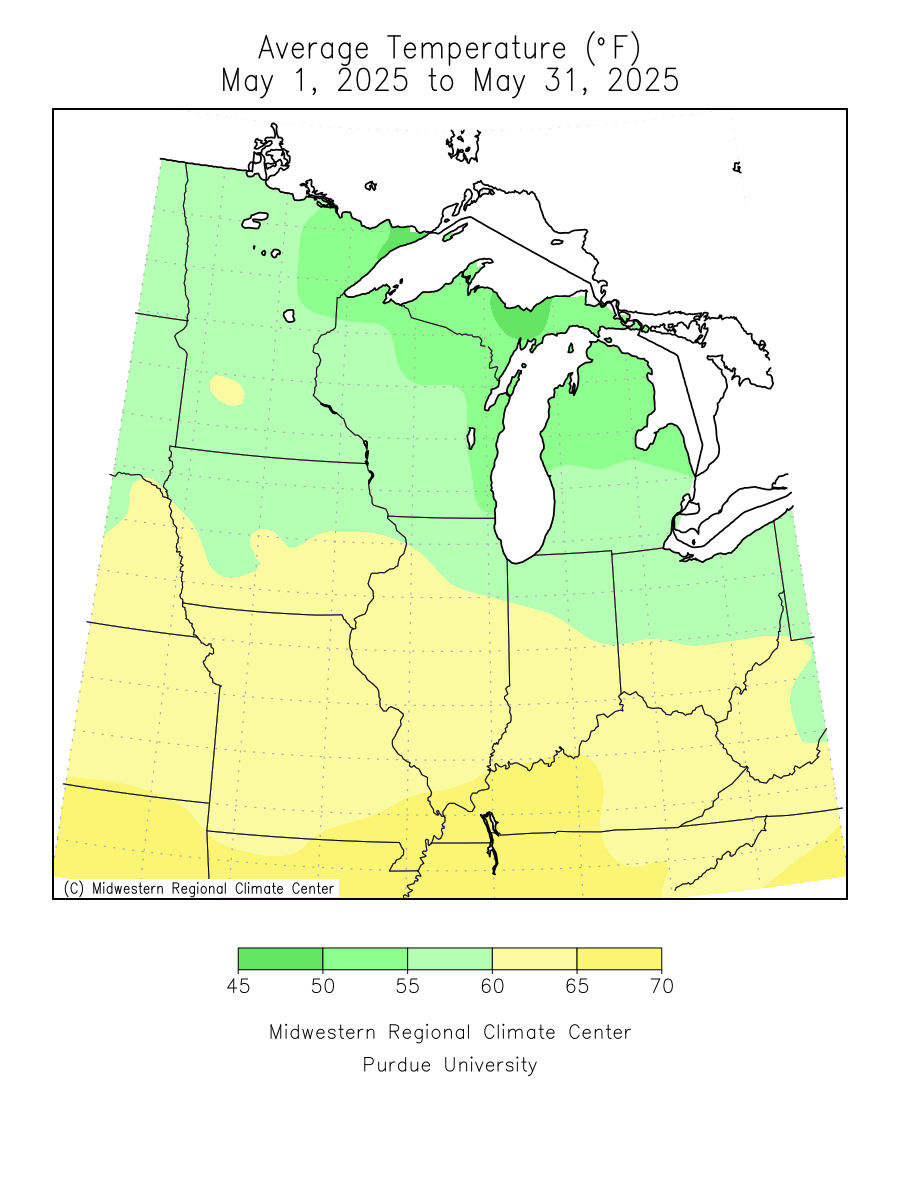
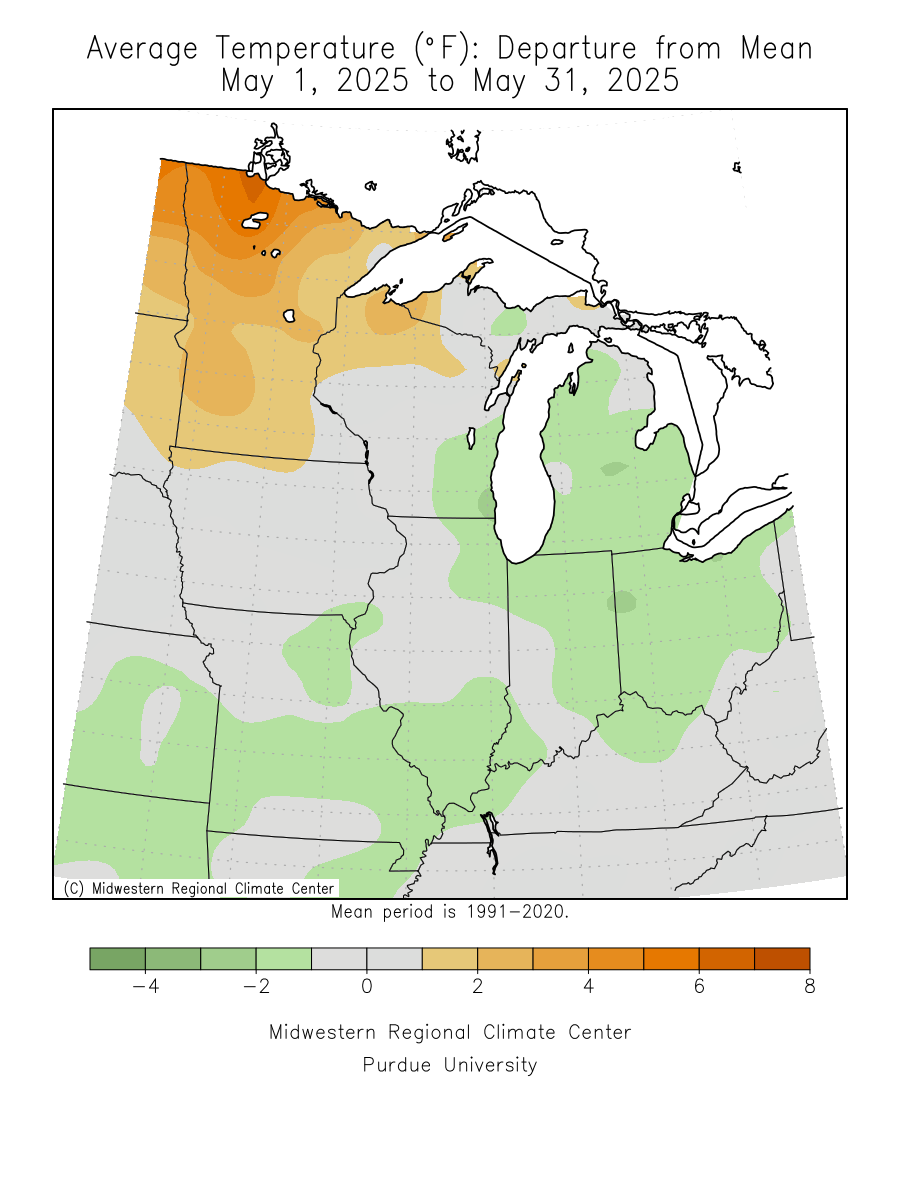
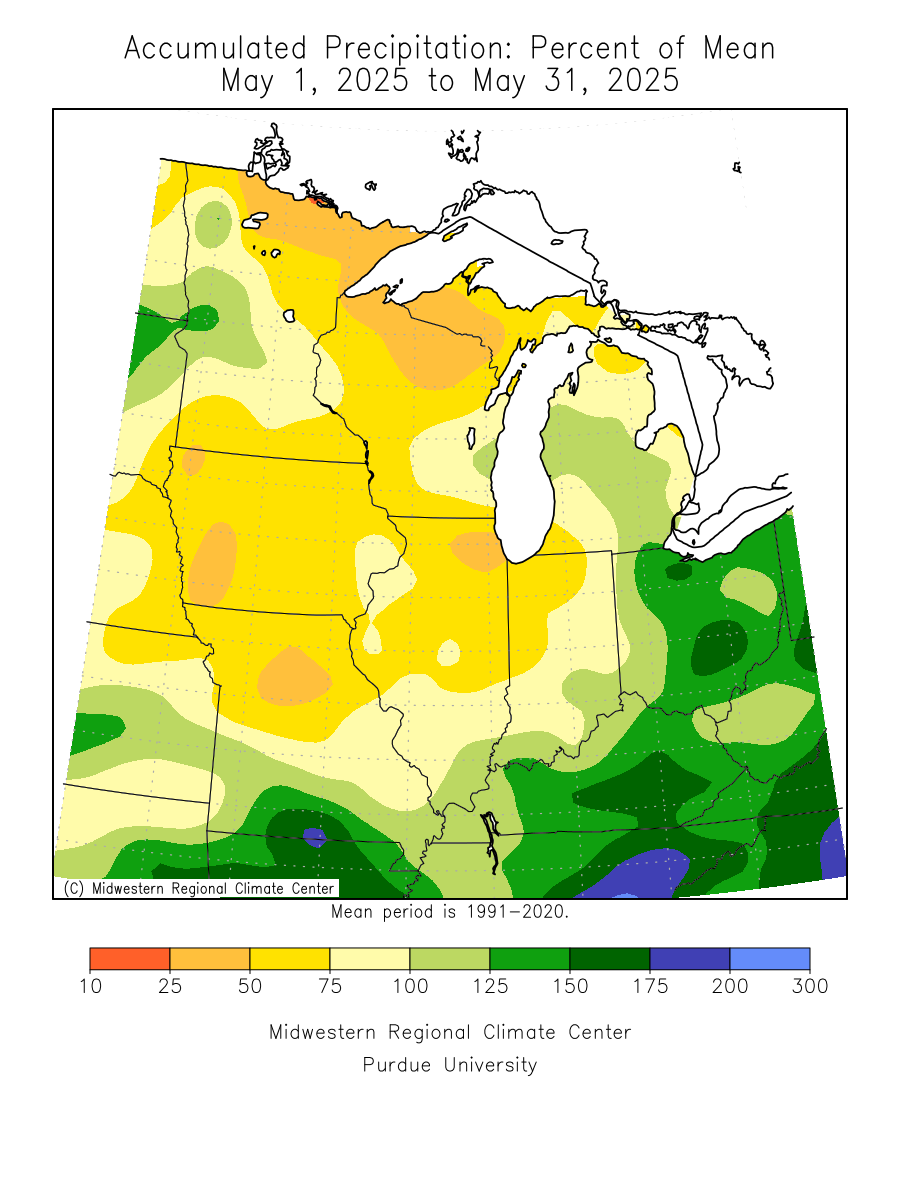
| May 2025 was about 1.8 degrees below normal to 1 degree above normal. | ||||||||||||||||||||||||||||||||||||||||||||||||||||||||||||||||||||||||||||||||||
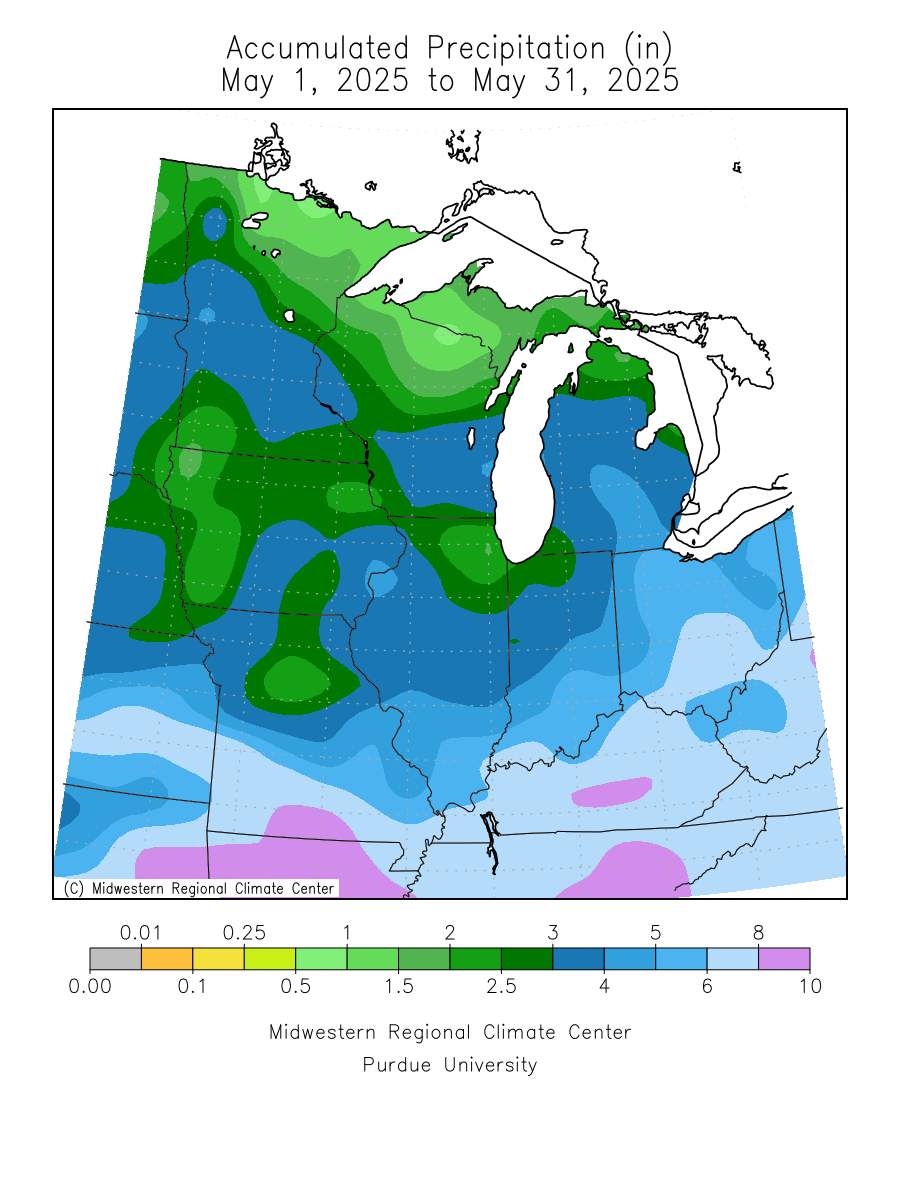
| Precipitation totals were about 1.96 inches below normal to 0.91 inches above normal. | ||||||||||||||||||||||||||||||||||||||||||||||||||||||||||||||||||||||||||||||||||
| Please see May Records for monthly record information. | ||||||||||||||||||||||||||||||||||||||||||||||||||||||||||||||||||||||||||||||||||
|
||||||||||||||||||||||||||||||||||||||||||||||||||||||||||||||||||||||||||||||||||
| The climate maps below are courtesy of the Northeast Regional Climate Center and Midwest Regional Climate Center. | ||||||||||||||||||||||||||||||||||||||||||||||||||||||||||||||||||||||||||||||||||
| These maps should update by early afternoon on the first of the month. | ||||||||||||||||||||||||||||||||||||||||||||||||||||||||||||||||||||||||||||||||||
|
||||||||||||||||||||||||||||||||||||||||||||||||||||||||||||||||||||||||||||||||||
| Climate/Almanac Data - Spring Normals - Spring Records | ||||||||||||||||||||||||||||||||||||||||||||||||||||||||||||||||||||||||||||||||||
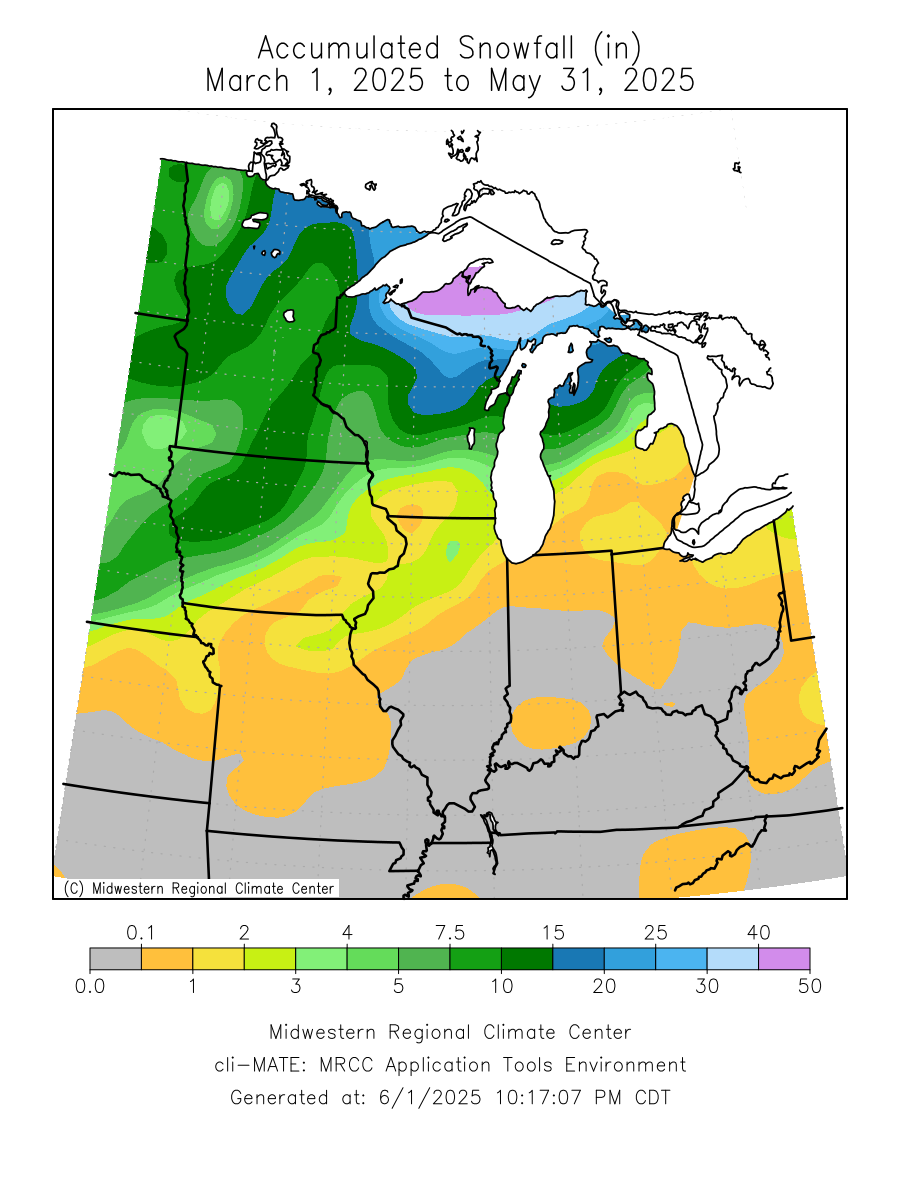
| Spring (Mar-May) |
||||||||||||||||||||||||||||||||||||||||||||||||||||||||||||||||||||||||||||||||||
|
||||||||||||||||||||||||||||||||||||||||||||||||||||||||||||||||||||||||||||||||||
|
The ranking is listed in parentheses (__) when within the "Top 10".
|
||||||||||||||||||||||||||||||||||||||||||||||||||||||||||||||||||||||||||||||||||
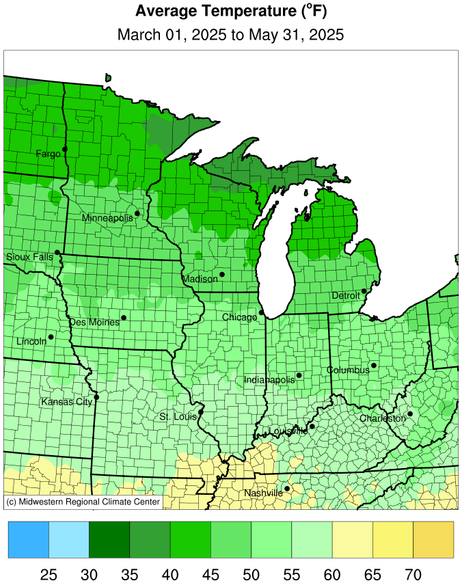
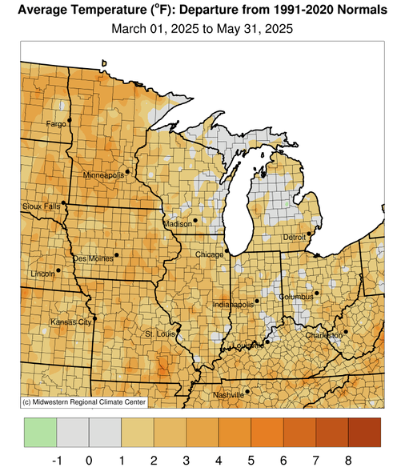
| Spring 2025 was about 1.6 to 4.1 degrees above normal. | ||||||||||||||||||||||||||||||||||||||||||||||||||||||||||||||||||||||||||||||||||
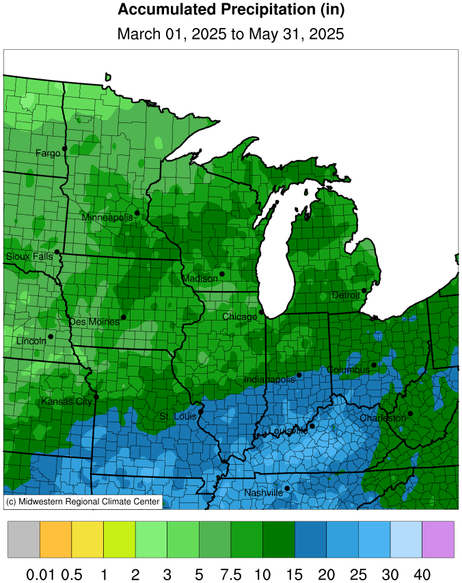
| Precipitation totals were about 0.70 to 2.02 inches below normal. | ||||||||||||||||||||||||||||||||||||||||||||||||||||||||||||||||||||||||||||||||||
| Snowfall totals were about 4.0 inches below normal to 5.3 inches below normal. | ||||||||||||||||||||||||||||||||||||||||||||||||||||||||||||||||||||||||||||||||||
| Please see Spring Records for seasonal record information. | ||||||||||||||||||||||||||||||||||||||||||||||||||||||||||||||||||||||||||||||||||
| The climate maps below are courtesy of the Northeast Regional Climate Center and Midwest Regional Climate Center. | ||||||||||||||||||||||||||||||||||||||||||||||||||||||||||||||||||||||||||||||||||
| These maps should update by early afternoon on the first of the month. | ||||||||||||||||||||||||||||||||||||||||||||||||||||||||||||||||||||||||||||||||||
|
||||||||||||||||||||||||||||||||||||||||||||||||||||||||||||||||||||||||||||||||||
| A LOOK AHEAD | ||||||||||||||||||||||||||||||||||||||||||||||||||||||||||||||||||||||||||||||||||
| Climate Prediction Center | ||||||||||||||||||||||||||||||||||||||||||||||||||||||||||||||||||||||||||||||||||
|
||||||||||||||||||||||||||||||||||||||||||||||||||||||||||||||||||||||||||||||||||
|
|
||||||||||||||||||||||||||||||||||||||||||||||||||||||||||||||||||||||||||||||||||