Dangerous heat will expand from the Gulf Coast into the Southern Plains and Desert Southwest through week's end. Additional extreme heat impacting the Pacific Northwest will shift to the northern Plains by the weekend. Tropical Storm Bertha is expected to continue to impact portions of the northwestern Gulf Coast from south central Louisiana to the upper Texas coast today. Read More >
| Climate/Almanac Data - JUN Normals - JUN Records | ||||||||||||||||||||||||||||||||||||||||||||||||||||||
| JUNE | ||||||||||||||||||||||||||||||||||||||||||||||||||||||
| *(Values Now Compared With New Climate Normals (1991-2020))* | ||||||||||||||||||||||||||||||||||||||||||||||||||||||
|
||||||||||||||||||||||||||||||||||||||||||||||||||||||
| The ranking is listed in parentheses (__) when within the "Top 10". | ||||||||||||||||||||||||||||||||||||||||||||||||||||||
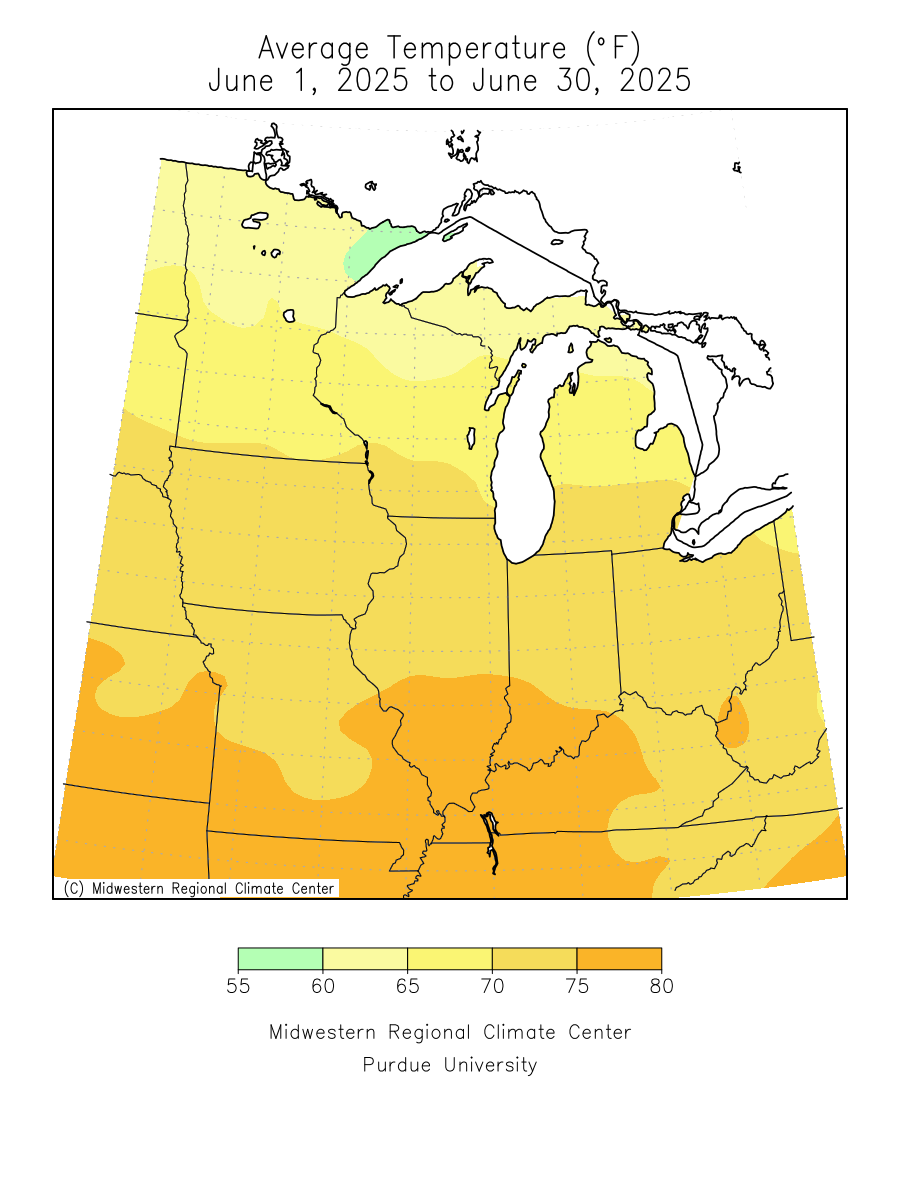
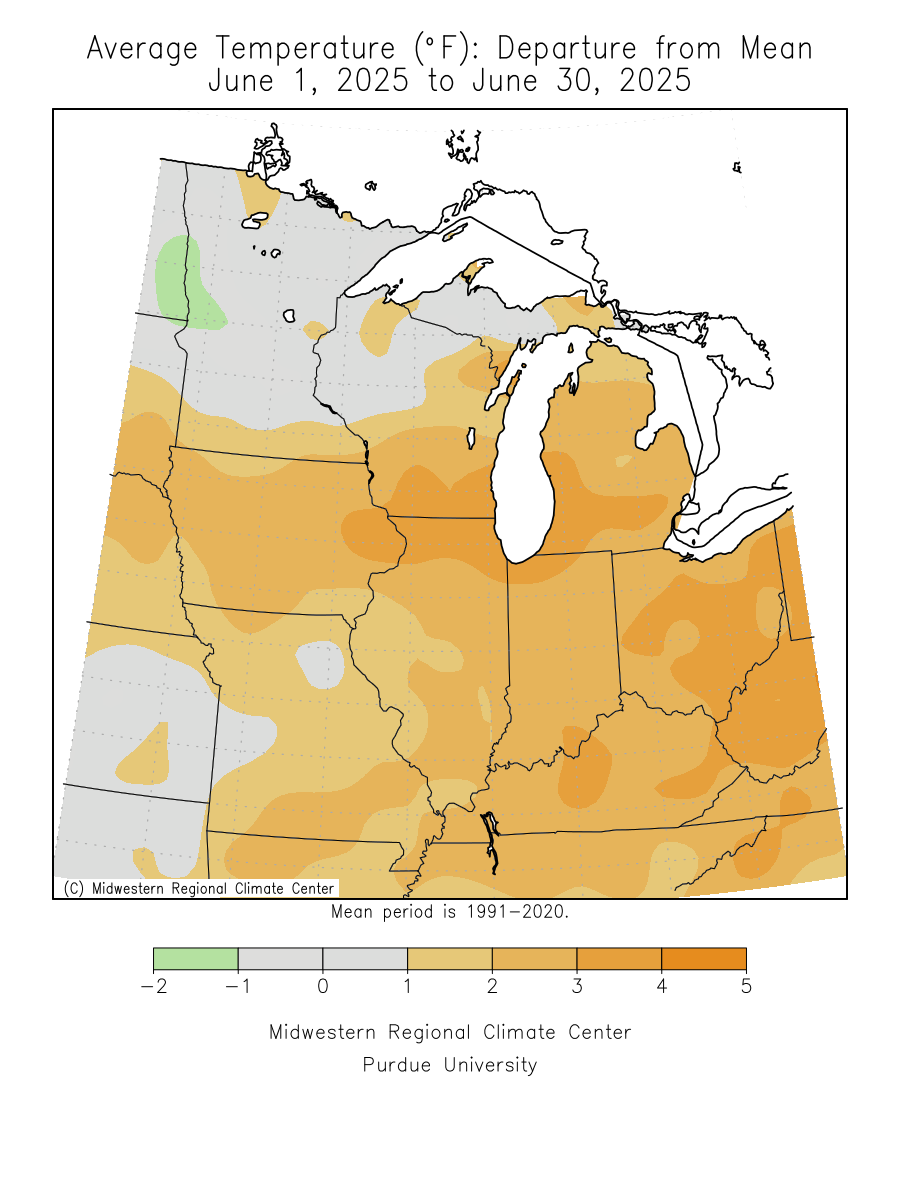
| June 2025 was about 1 to 3.6 degrees above normal. | ||||||||||||||||||||||||||||||||||||||||||||||||||||||
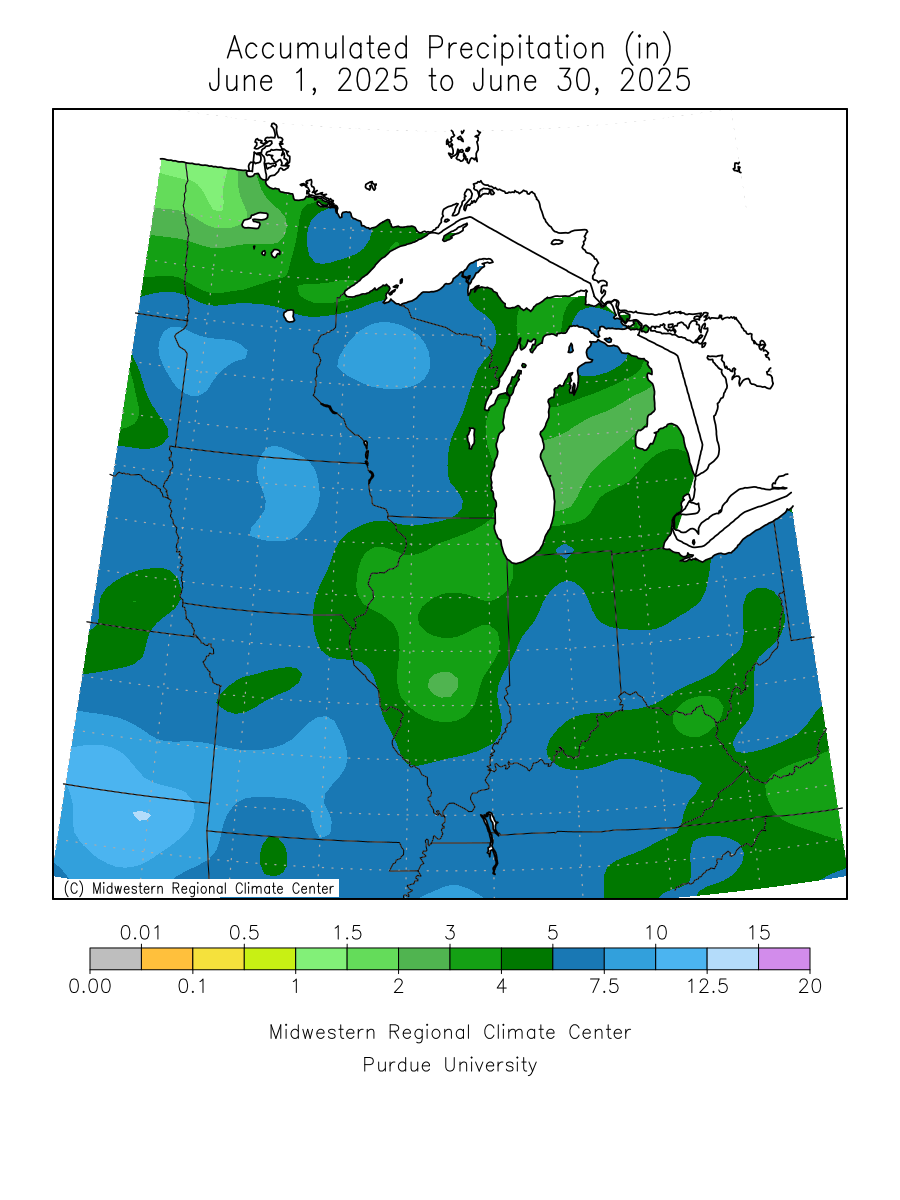
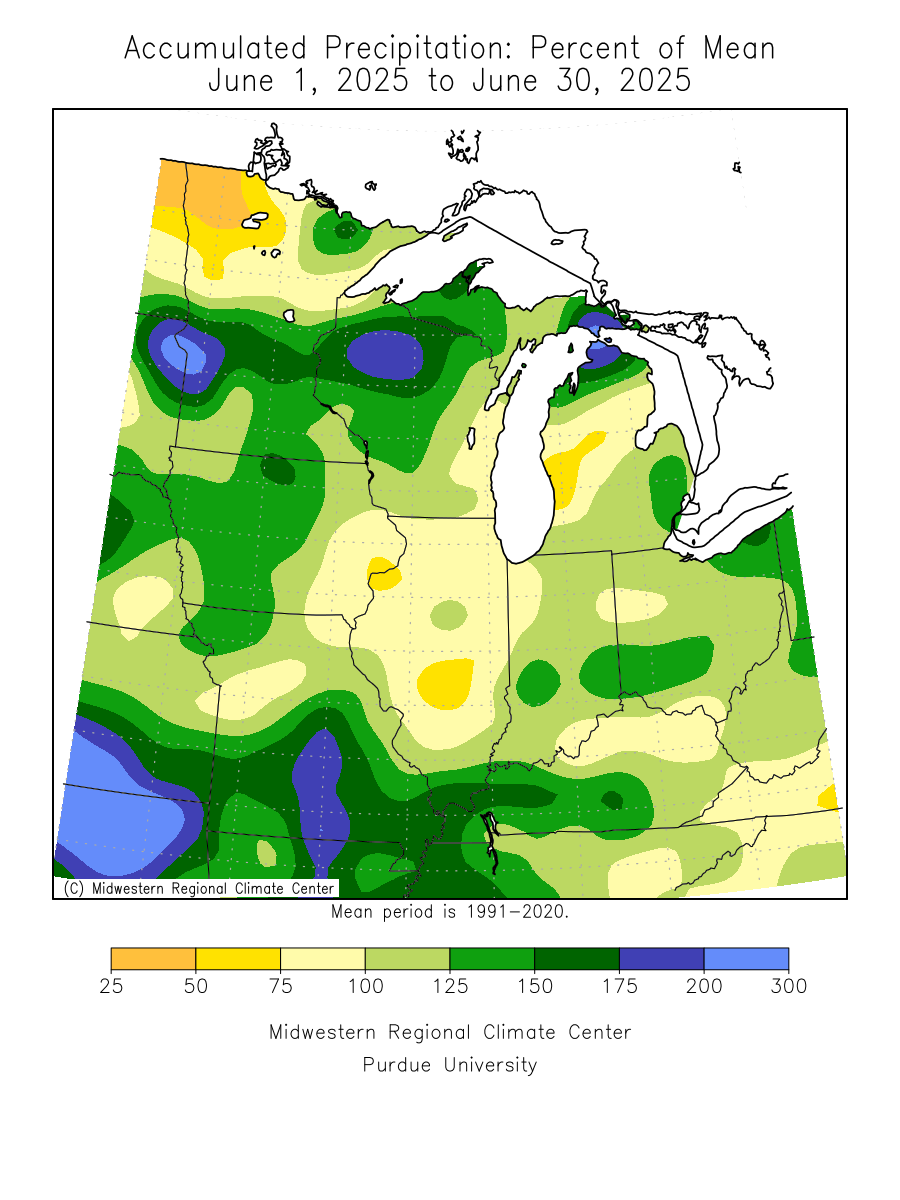
| Precipitation totals were -0.45 to -3.22 inches below normal. | ||||||||||||||||||||||||||||||||||||||||||||||||||||||
| Please see JUN Records for monthly record information. | ||||||||||||||||||||||||||||||||||||||||||||||||||||||
| The climate maps below are courtesy of the Midwest Regional Climate Center. | ||||||||||||||||||||||||||||||||||||||||||||||||||||||
| These maps become available around 10am on the first of the month. | ||||||||||||||||||||||||||||||||||||||||||||||||||||||
|
||||||||||||||||||||||||||||||||||||||||||||||||||||||
| A LOOK AHEAD | ||||||||||||||||||||||||||||||||||||||||||||||||||||||
| Climate Prediction Center | ||||||||||||||||||||||||||||||||||||||||||||||||||||||
|
||||||||||||||||||||||||||||||||||||||||||||||||||||||