A multi-day heavy lake effect snow event is expected downwind of Lakes Erie and Ontario through New Year's Day. The Arctic front will continue to bring increasing winds to the Northeast that will remain gusty. Subfreezing overnight low temperatures will be found as far south as the Gulf Coast. Read More >
| Climate/Almanac Data - August Normals - August Records | |||||||||||||||||||||||||||||||||||||||||||||||||||||||||||||
| AUGUST | |||||||||||||||||||||||||||||||||||||||||||||||||||||||||||||
The ranking is listed in parentheses (__) when within the "Top 10".
|
|||||||||||||||||||||||||||||||||||||||||||||||||||||||||||||
| August 2016 was near normal to about 2.5 degrees above normal. | |||||||||||||||||||||||||||||||||||||||||||||||||||||||||||||
| Precipitation totals for August 2016 ranged from about 2/3 of an inch below normal at Dubuque to over 5 inches above normal at Davenport. |
|||||||||||||||||||||||||||||||||||||||||||||||||||||||||||||
| Please see August Records for monthly record information. | |||||||||||||||||||||||||||||||||||||||||||||||||||||||||||||
| The climate maps below are courtesy of the Midwest Regional Climate Center. | |||||||||||||||||||||||||||||||||||||||||||||||||||||||||||||
| These maps become available around 10am on the first of the month. | |||||||||||||||||||||||||||||||||||||||||||||||||||||||||||||
|
|||||||||||||||||||||||||||||||||||||||||||||||||||||||||||||
| Climate/Almanac Data - Summer Normals - Summer Records | |||||||||||||||||||||||||||||||||||||||||||||||||||||||||||||
| Summer (Jun-Aug) |
|||||||||||||||||||||||||||||||||||||||||||||||||||||||||||||
|
|||||||||||||||||||||||||||||||||||||||||||||||||||||||||||||
|
The ranking is listed in parentheses (__) when within the "Top 10".
|
|||||||||||||||||||||||||||||||||||||||||||||||||||||||||||||
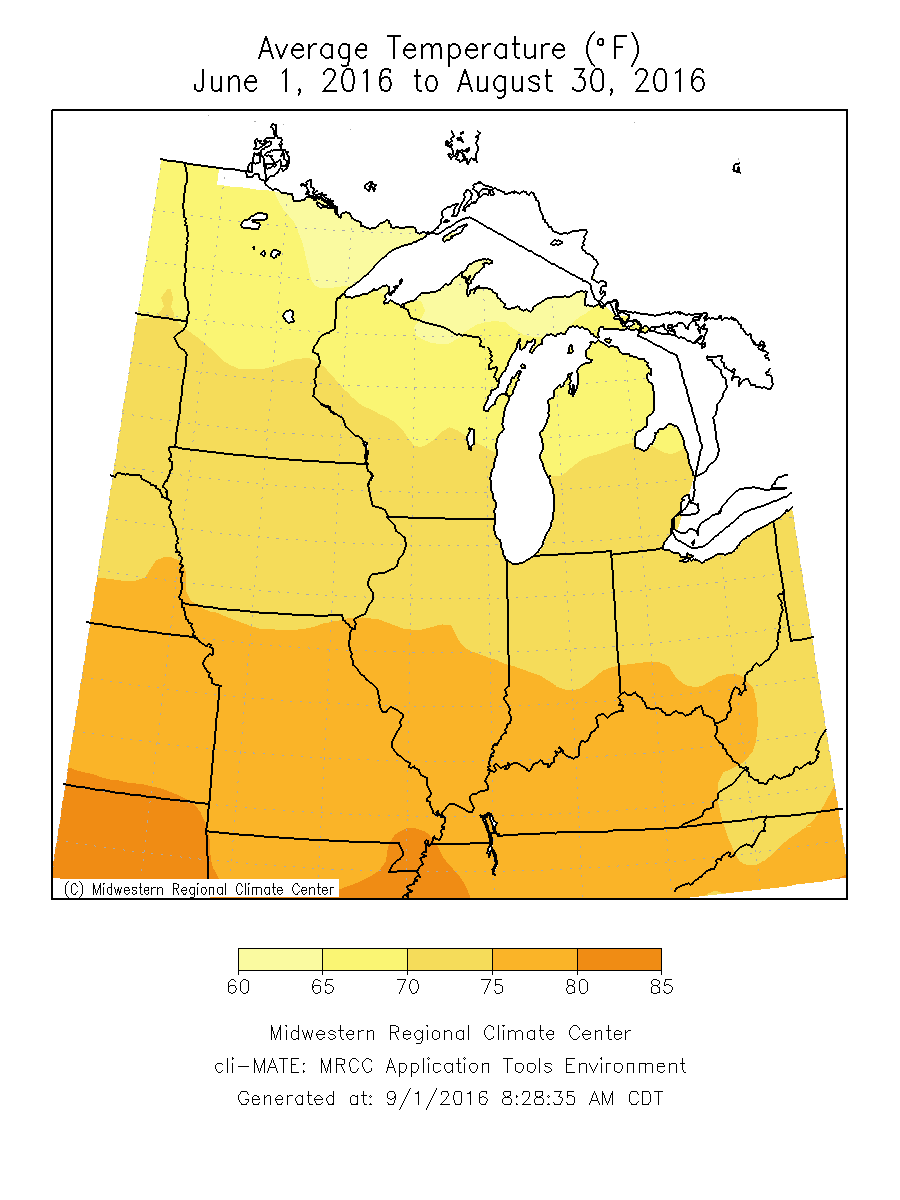
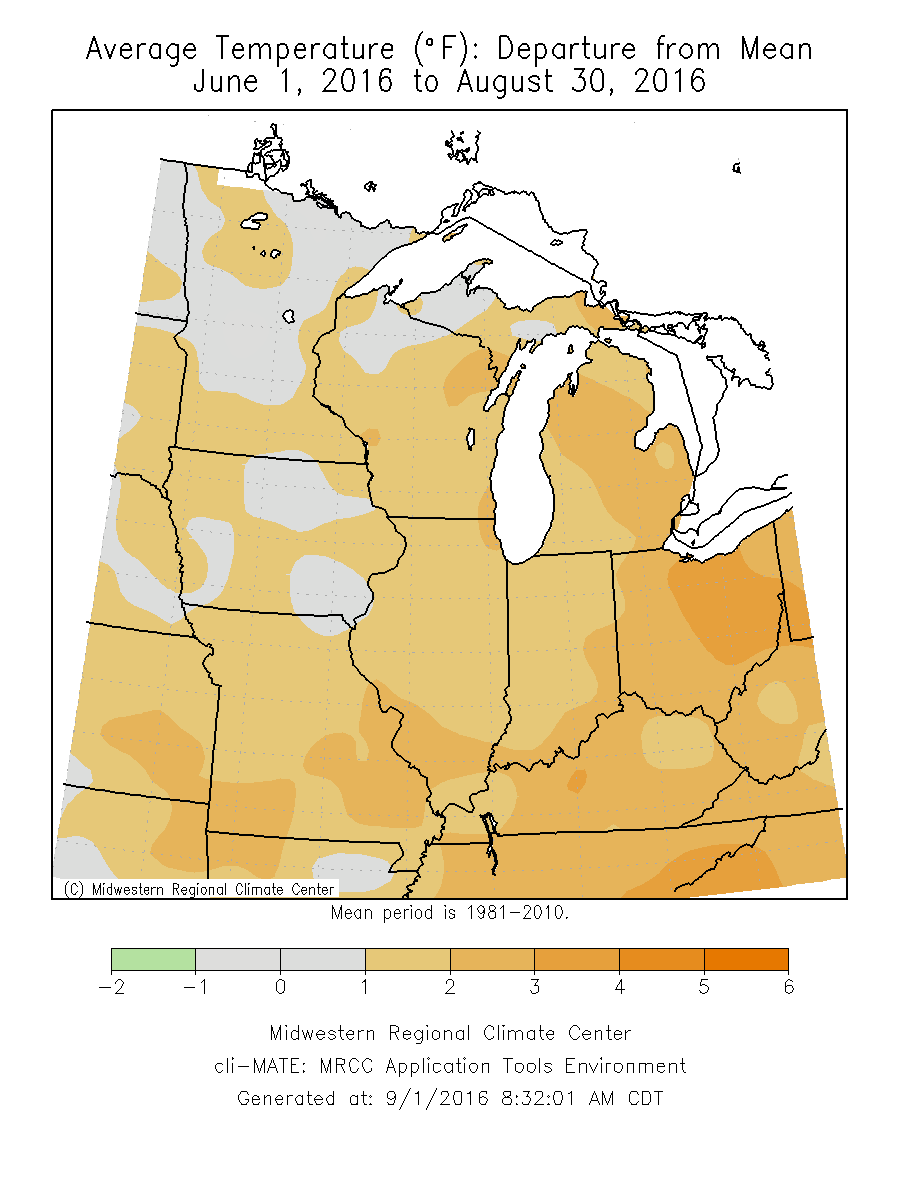
| Summer 2016 was near normal to about 2 degrees above normal. | |||||||||||||||||||||||||||||||||||||||||||||||||||||||||||||
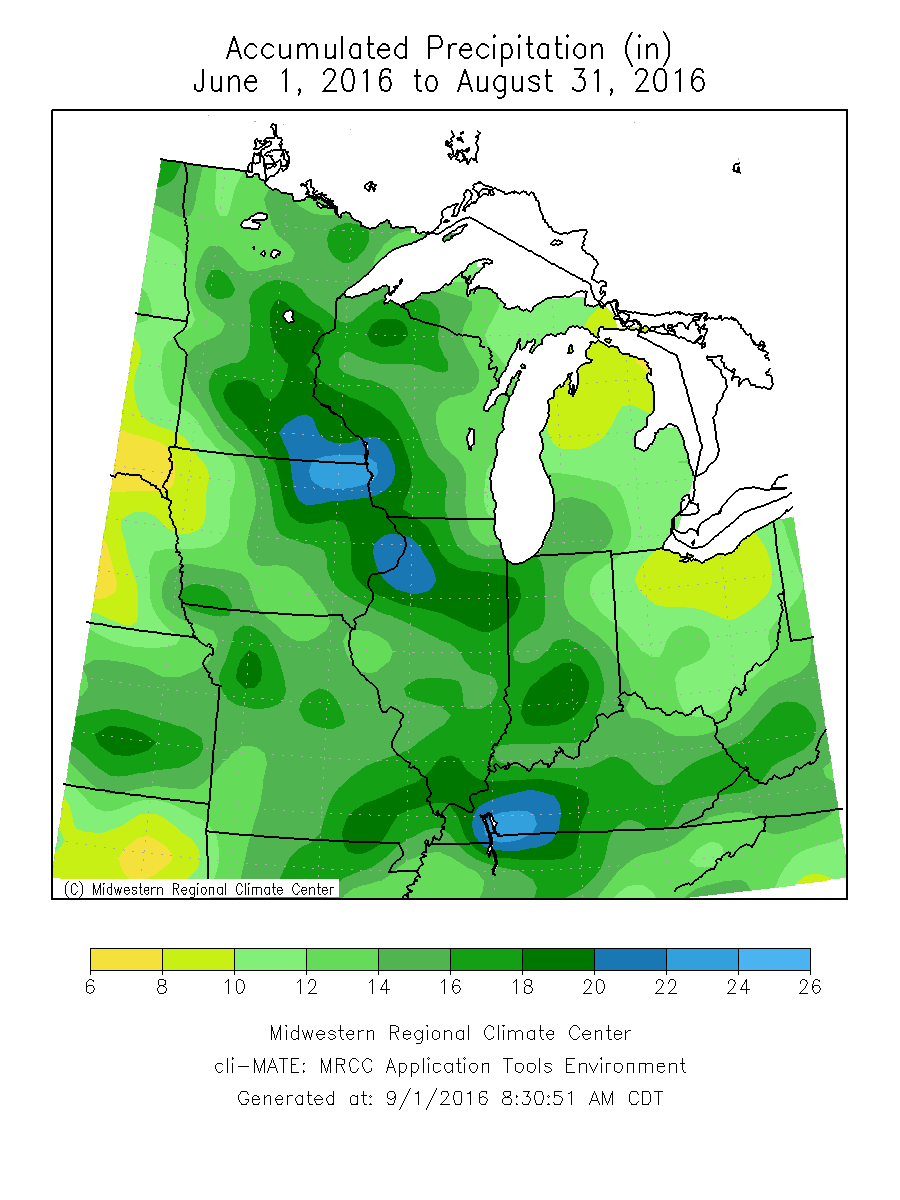
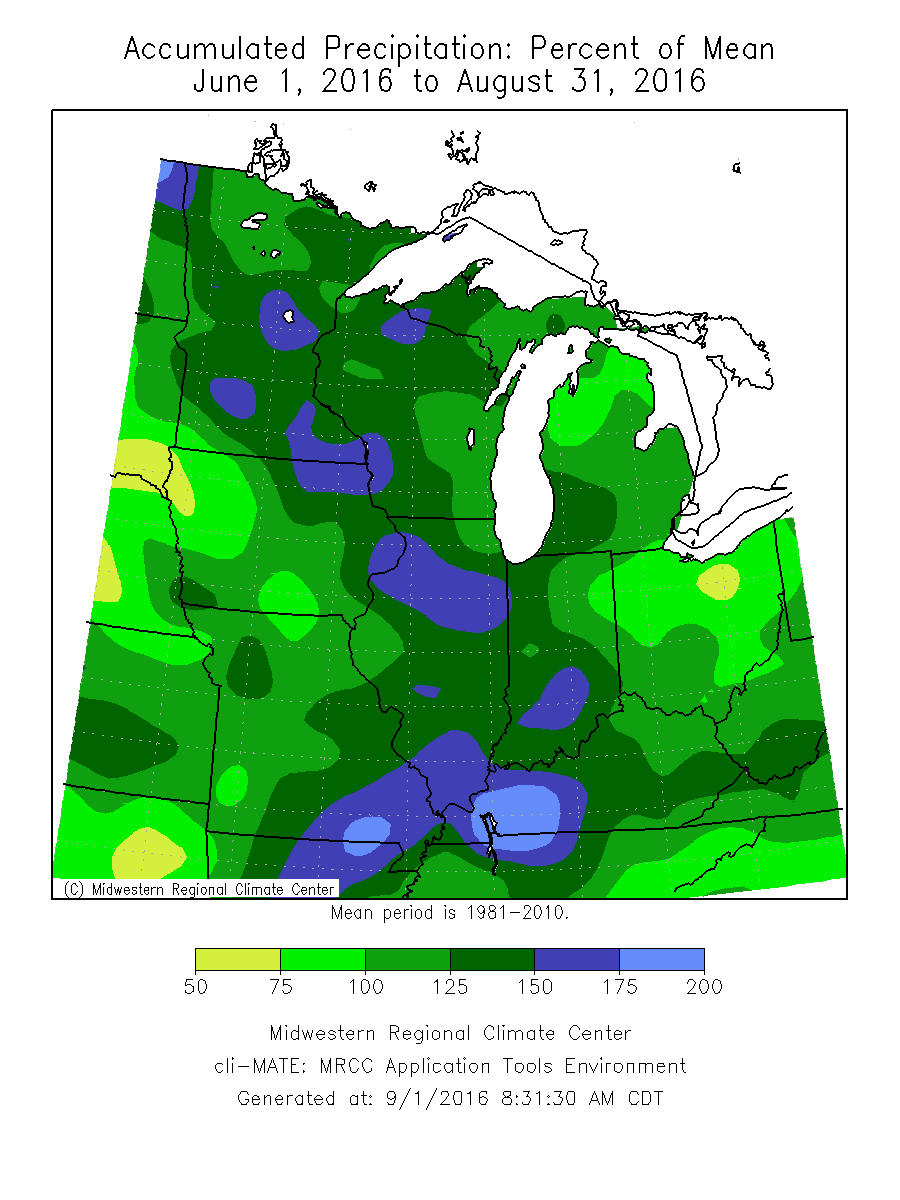
| Precipitation totals for Summer 2016 were around normal near Burlington to nearly 9 inches above normal at Davenport. | |||||||||||||||||||||||||||||||||||||||||||||||||||||||||||||
| Please see Summer Records for seasonal record information. | |||||||||||||||||||||||||||||||||||||||||||||||||||||||||||||
| The climate maps below are courtesy of the Midwest Regional Climate Center. | |||||||||||||||||||||||||||||||||||||||||||||||||||||||||||||
|
|||||||||||||||||||||||||||||||||||||||||||||||||||||||||||||
|
|
|||||||||||||||||||||||||||||||||||||||||||||||||||||||||||||