Tropical Depression Two is expected to gradually strengthen and could bring tropical storm conditions to the Florida Panhandle beginning late Monday. Areas of flash flooding will be possible through Thursday along the eastern and central Gulf Coast. Severe thunderstorms will develop and move along a cold front crossing the Upper Midwest Monday, and through the Ohio Valley/Mid-Atlantic on Tuesday. Read More >
| Climate/Almanac Data - Sep Normals - Sep Records | ||||||||||||||||||||||||||||||||||||||||||||||||||||||
| SEPTEMBER | ||||||||||||||||||||||||||||||||||||||||||||||||||||||
|
||||||||||||||||||||||||||||||||||||||||||||||||||||||
| The ranking is listed in parentheses (__) when within the "Top 10". | ||||||||||||||||||||||||||||||||||||||||||||||||||||||
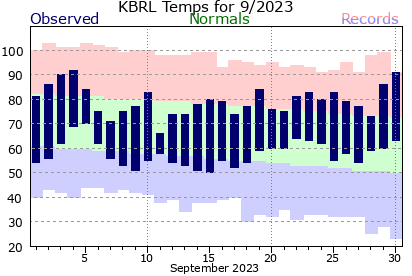
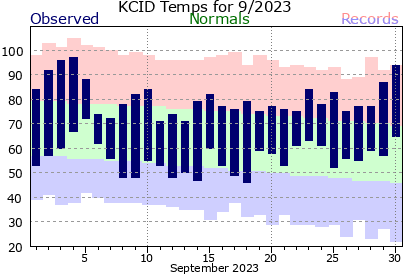
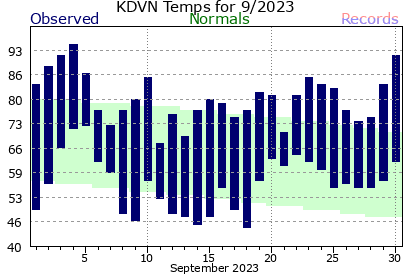
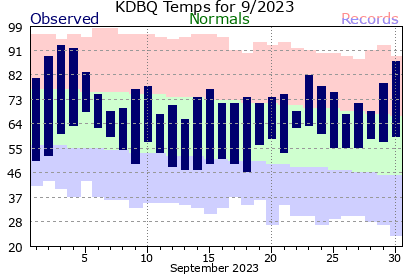
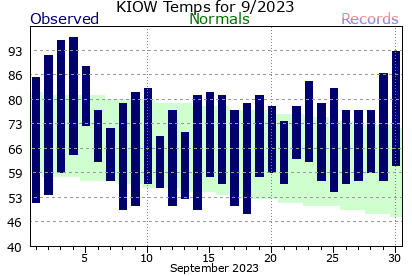
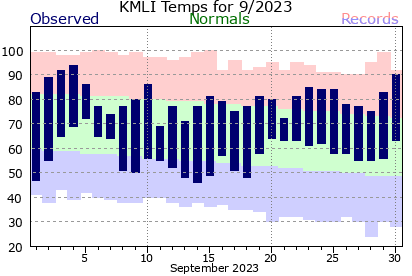
| September 2022 was about 2 to 5 degrees above normal. | ||||||||||||||||||||||||||||||||||||||||||||||||||||||
| Precipitation totals were about 0.5 to 2.5" below normal, with the exception of Moline, which was 1.69" above normal due to heavy localized rainfall. | ||||||||||||||||||||||||||||||||||||||||||||||||||||||
| Please see Sep Records for monthly record information. | ||||||||||||||||||||||||||||||||||||||||||||||||||||||
|
||||||||||||||||||||||||||||||||||||||||||||||||||||||
| The climate maps below are courtesy of the Northeast Regional Climate Center | ||||||||||||||||||||||||||||||||||||||||||||||||||||||
| These maps should update to the most recent "last month" on the first of the month. | ||||||||||||||||||||||||||||||||||||||||||||||||||||||
|
|
||||||||||||||||||||||||||||||||||||||||||||||||||||||
|
||||||||||||||||||||||||||||||||||||||||||||||||||||||
|
||||||||||||||||||||||||||||||||||||||||||||||||||||||
| A LOOK AHEAD | ||||||||||||||||||||||||||||||||||||||||||||||||||||||
| Climate Prediction Center | ||||||||||||||||||||||||||||||||||||||||||||||||||||||
|
||||||||||||||||||||||||||||||||||||||||||||||||||||||