Widespread life-threatening flash and urban flooding continues in south-central Texas, with considerable flooding impacts possible across central Texas. Wildfire smoke is impacting air quality across much of the Great Lakes region into southern New England and the Mid-Atlantic. Monsoonal thunderstorms may produce isolated to scattered flash flooding across the Southwest into the Great Basin. Read More >
| Climate/Almanac Data - Oct Normals - Oct Records | |||||||||||||||||||||||||||||||||||||||||||||||||||||||||||||||||||||||||||
| OCTOBER | |||||||||||||||||||||||||||||||||||||||||||||||||||||||||||||||||||||||||||
|
|||||||||||||||||||||||||||||||||||||||||||||||||||||||||||||||||||||||||||
| The ranking is listed in parentheses (__) when within the "Top 10". | |||||||||||||||||||||||||||||||||||||||||||||||||||||||||||||||||||||||||||
| October 2019 was about 2 to 4 degrees below normal. | |||||||||||||||||||||||||||||||||||||||||||||||||||||||||||||||||||||||||||
| Precipitation totals for October 2019 were roughly an inch below normal at Burlington to 3/4 of an inch above normal at Cedar Rapids, with the exception of Dubuque which was over 4" inches above normal. | |||||||||||||||||||||||||||||||||||||||||||||||||||||||||||||||||||||||||||
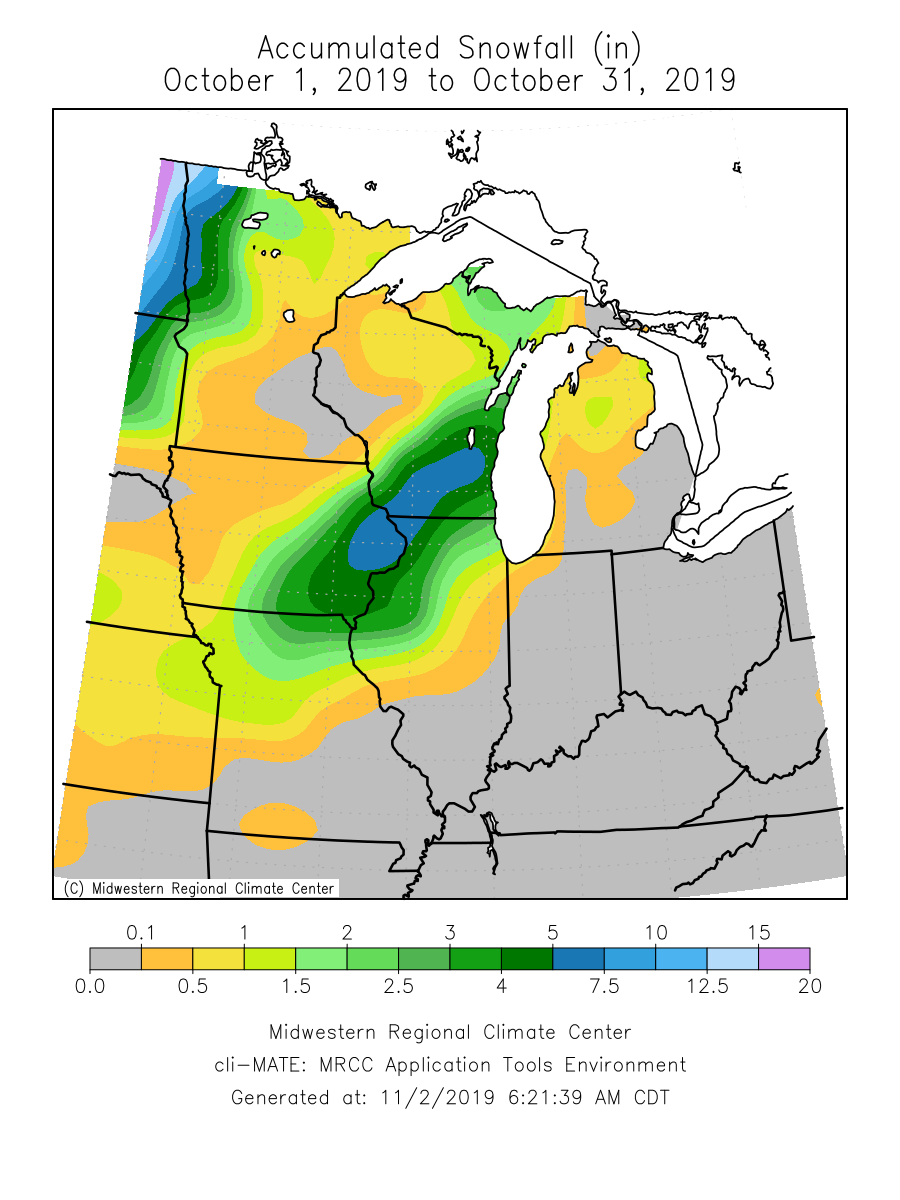
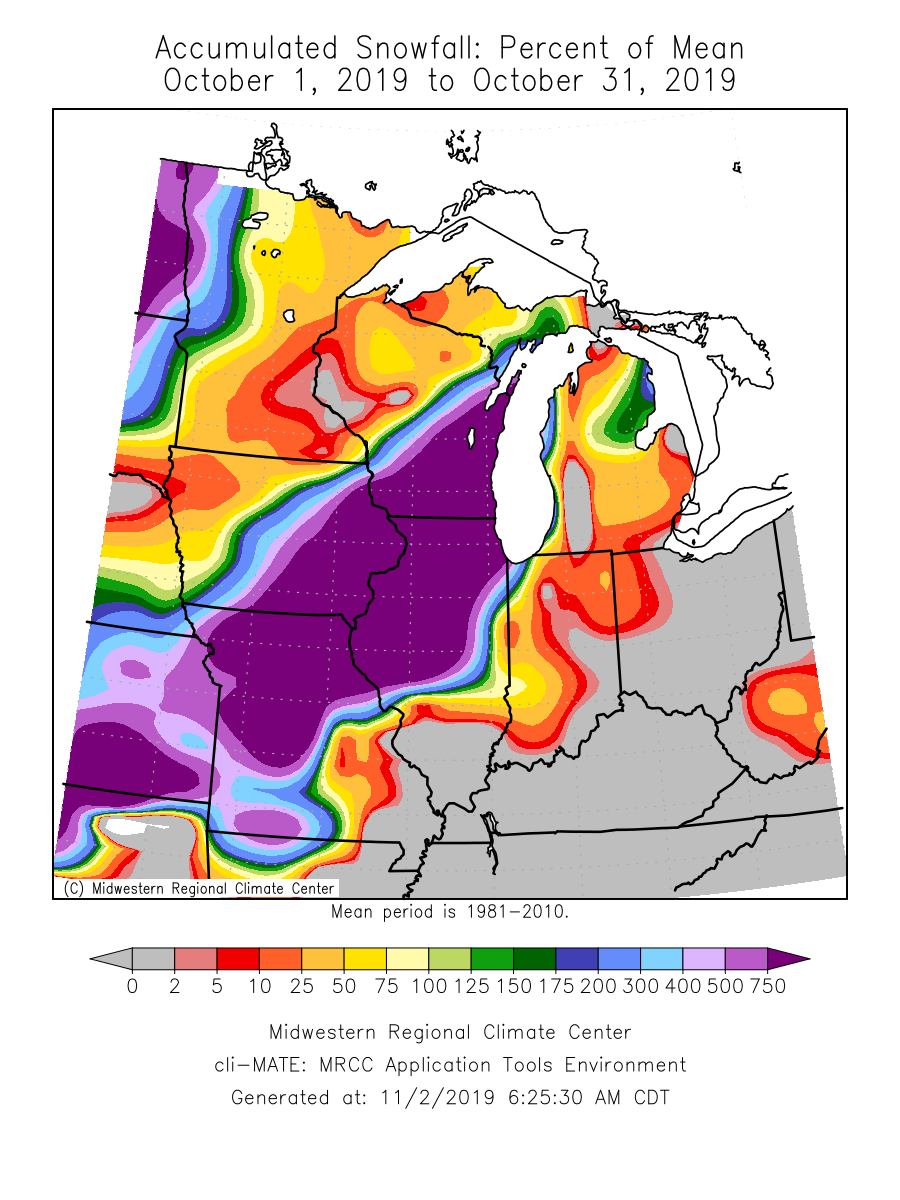
| Dubuque had its snowiest October on record as well as its 4th wettest October. Moline had its 2nd snowiest October on record. [Record Snowiest = 1967 (6.6")] All six sites had snow on Halloween! |
|||||||||||||||||||||||||||||||||||||||||||||||||||||||||||||||||||||||||||
| Please see Oct Records for monthly record information. | |||||||||||||||||||||||||||||||||||||||||||||||||||||||||||||||||||||||||||
| The climate maps below are courtesy of the Midwest Regional Climate Center. | |||||||||||||||||||||||||||||||||||||||||||||||||||||||||||||||||||||||||||
| These maps become available around 10am on the first of the month. | |||||||||||||||||||||||||||||||||||||||||||||||||||||||||||||||||||||||||||
|
|||||||||||||||||||||||||||||||||||||||||||||||||||||||||||||||||||||||||||
| A LOOK AHEAD | |||||||||||||||||||||||||||||||||||||||||||||||||||||||||||||||||||||||||||
|
|||||||||||||||||||||||||||||||||||||||||||||||||||||||||||||||||||||||||||