Widespread life-threatening flash and urban flooding continues in south-central Texas, with considerable flooding impacts possible across central Texas. Wildfire smoke is impacting air quality across much of the Great Lakes region into southern New England and the Mid-Atlantic. Monsoonal thunderstorms may produce isolated to scattered flash flooding across the Southwest into the Great Basin. Read More >
| Climate/Almanac Data - Dec Normals - Dec Records | ||||||||||||||||||||||||||||||||||||||||||||||||||||||||||||||||||||||||||||||||||
| December | ||||||||||||||||||||||||||||||||||||||||||||||||||||||||||||||||||||||||||||||||||
|
||||||||||||||||||||||||||||||||||||||||||||||||||||||||||||||||||||||||||||||||||
| The ranking is listed in parentheses (__) when within the "Top 10". | ||||||||||||||||||||||||||||||||||||||||||||||||||||||||||||||||||||||||||||||||||
| December 2017 ranged from near 1.5°F below normal to around 1.5°F degrees above normal. | ||||||||||||||||||||||||||||||||||||||||||||||||||||||||||||||||||||||||||||||||||
| Precipitation totals for December 2017 were near a quarter of an inch to around 2 inches below normal. | ||||||||||||||||||||||||||||||||||||||||||||||||||||||||||||||||||||||||||||||||||
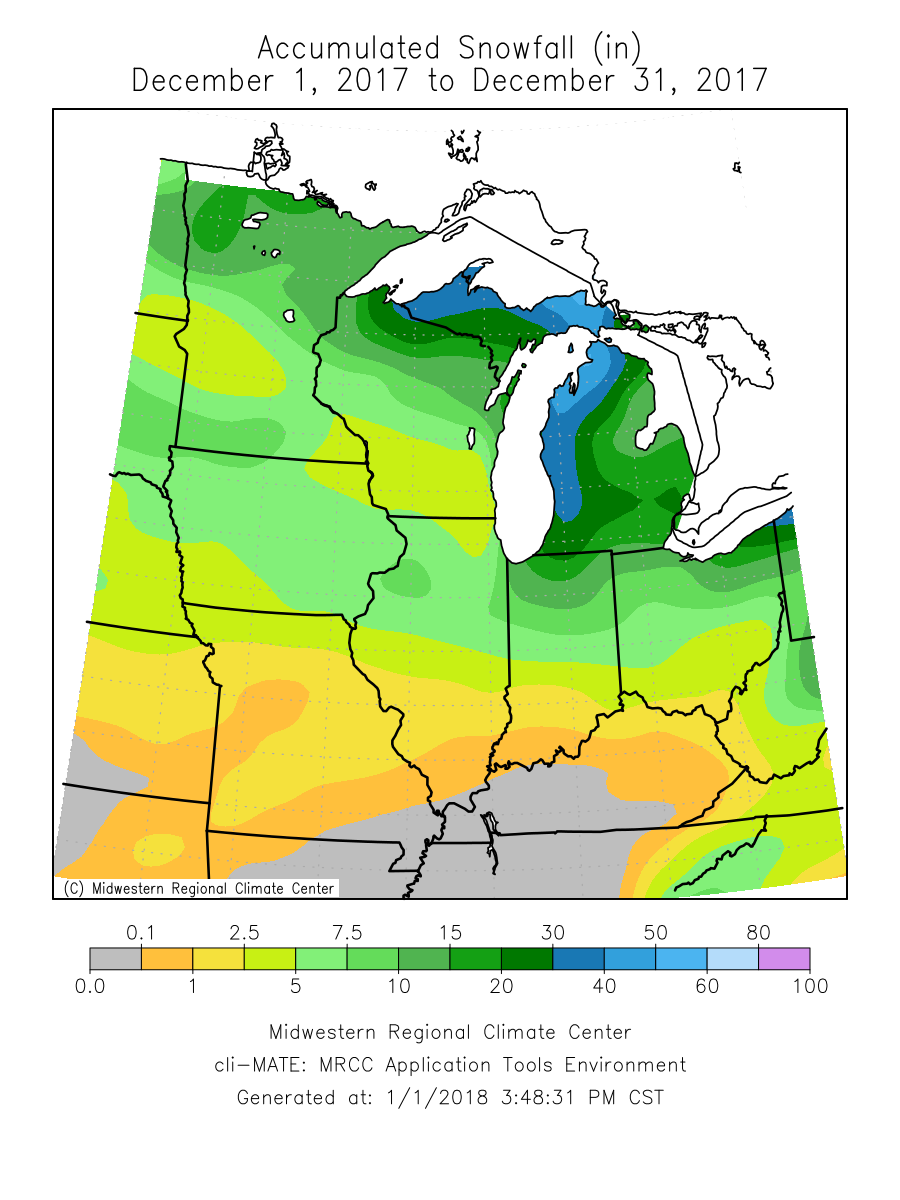
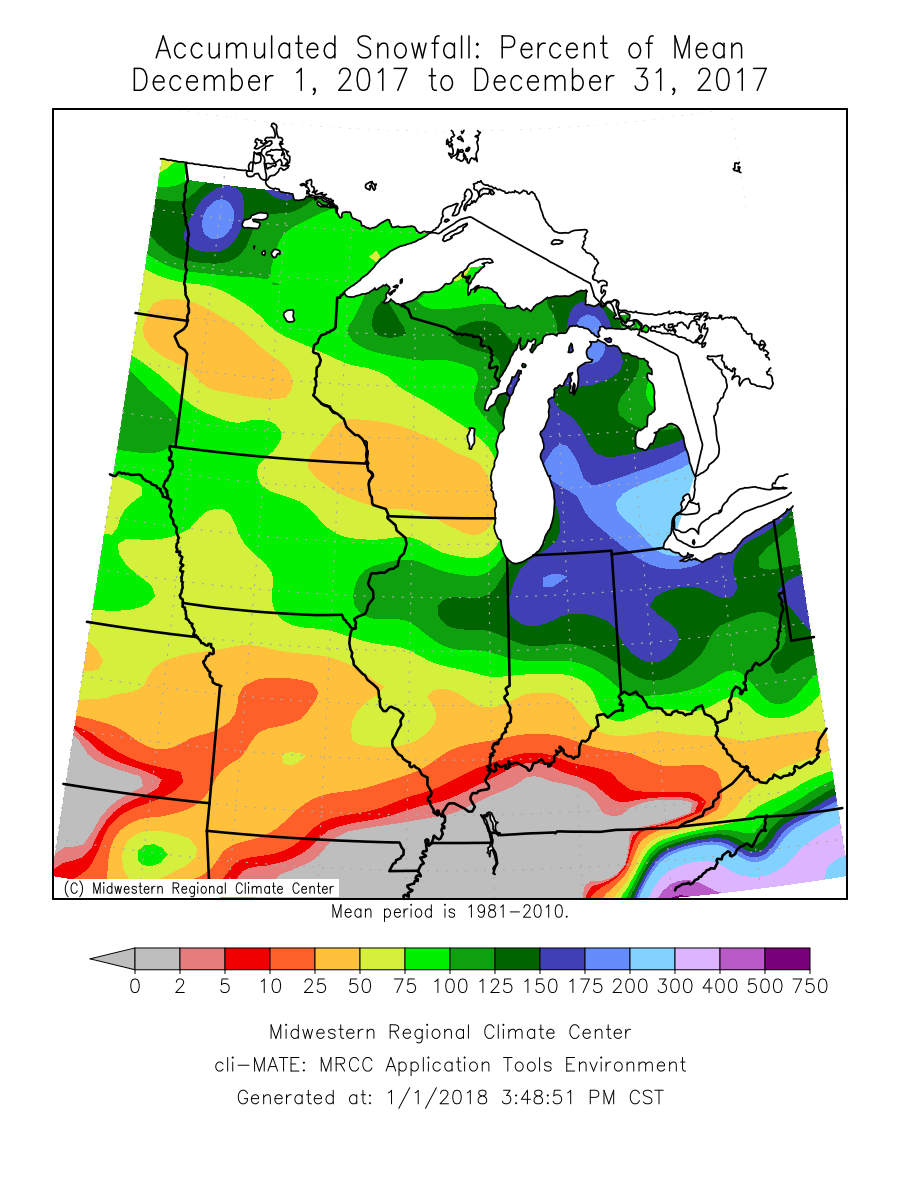
| Snowfall totals for December 2017 were near to around 6 inches below normal. | ||||||||||||||||||||||||||||||||||||||||||||||||||||||||||||||||||||||||||||||||||
| Please see Dec Records for monthly record information. | ||||||||||||||||||||||||||||||||||||||||||||||||||||||||||||||||||||||||||||||||||
| The climate maps below are courtesy of the Midwest Regional Climate Center. | ||||||||||||||||||||||||||||||||||||||||||||||||||||||||||||||||||||||||||||||||||
| These maps become available around 10am on the first of the month. | ||||||||||||||||||||||||||||||||||||||||||||||||||||||||||||||||||||||||||||||||||
|
||||||||||||||||||||||||||||||||||||||||||||||||||||||||||||||||||||||||||||||||||
| Climate/Almanac Data - Annual Normals - Annual Records | ||||||||||||||||||||||||||||||||||||||||||||||||||||||||||||||||||||||||||||||||||
| 2017 | ||||||||||||||||||||||||||||||||||||||||||||||||||||||||||||||||||||||||||||||||||
|
||||||||||||||||||||||||||||||||||||||||||||||||||||||||||||||||||||||||||||||||||
| The ranking is listed in parentheses (__) when within the "Top 10". | ||||||||||||||||||||||||||||||||||||||||||||||||||||||||||||||||||||||||||||||||||
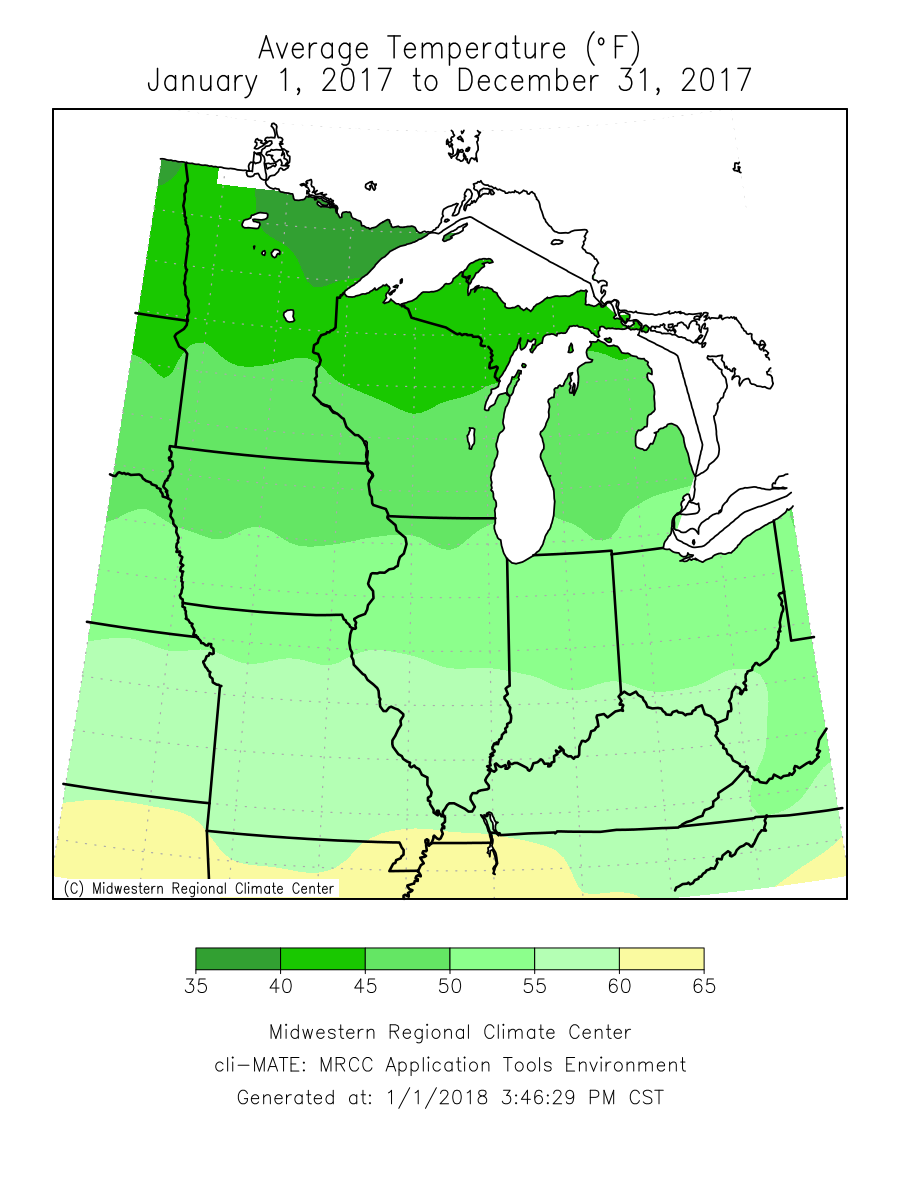
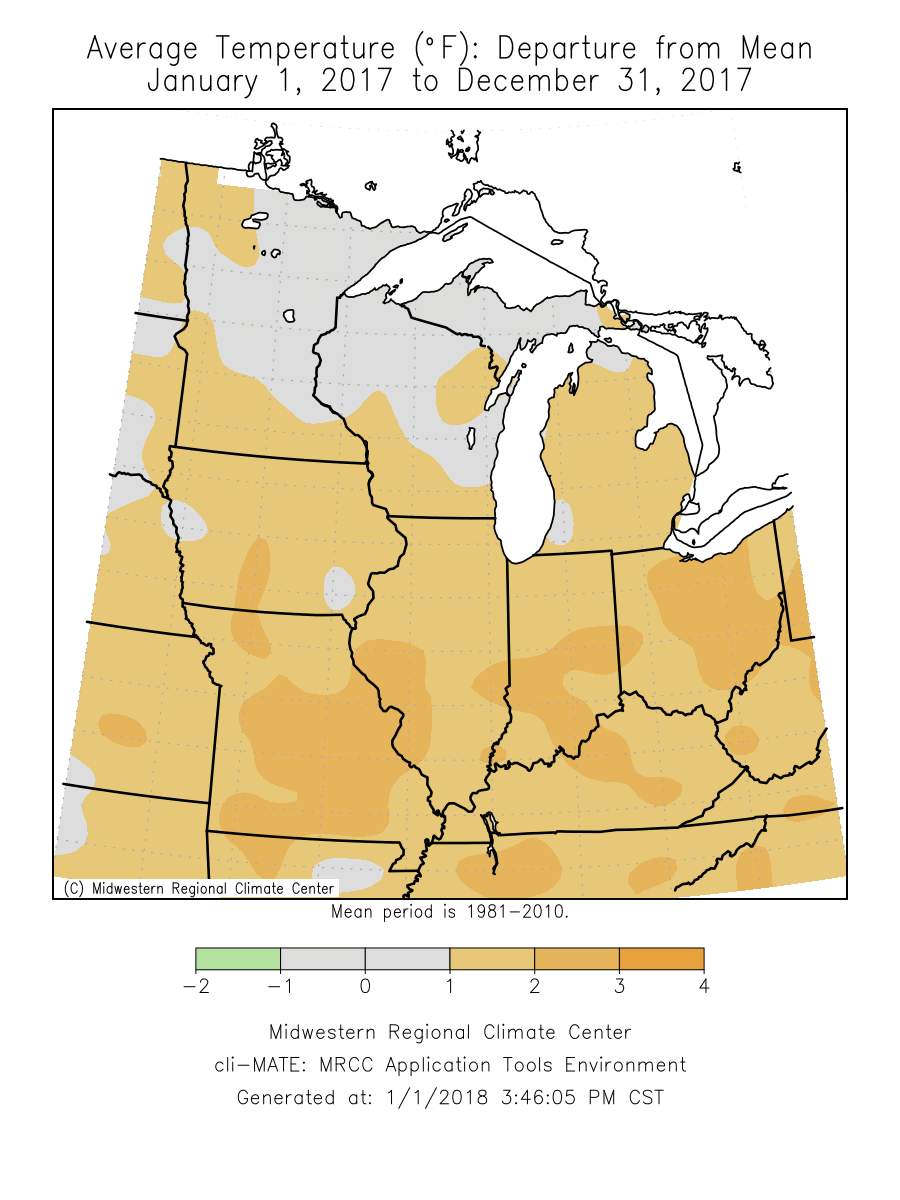
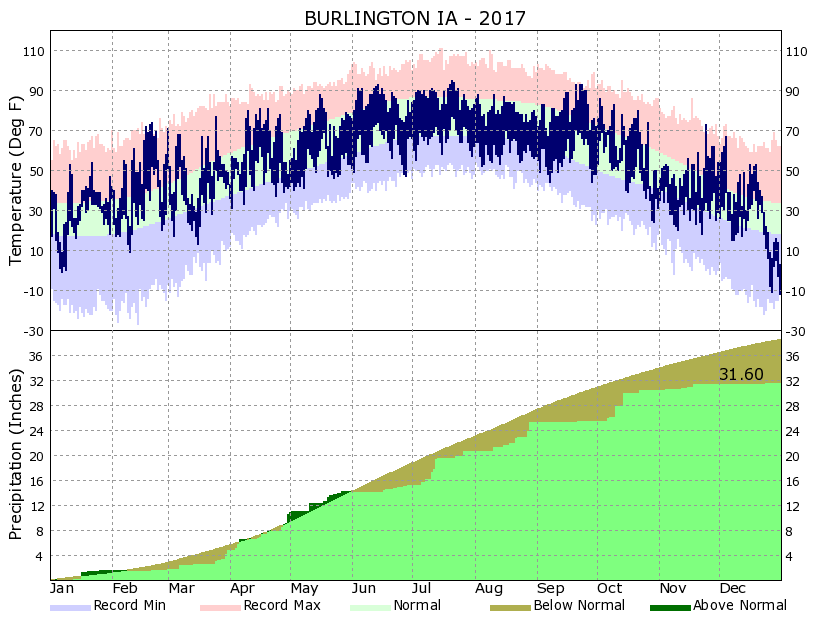
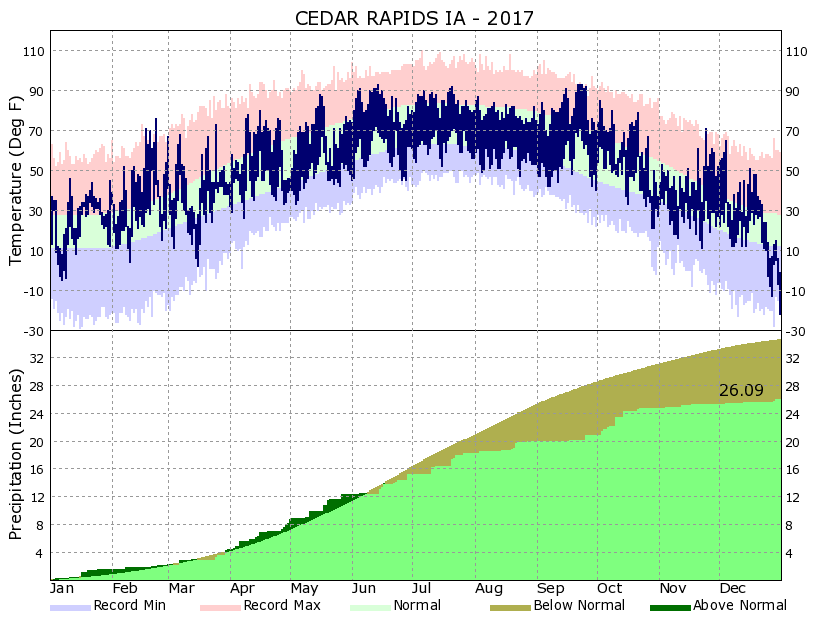
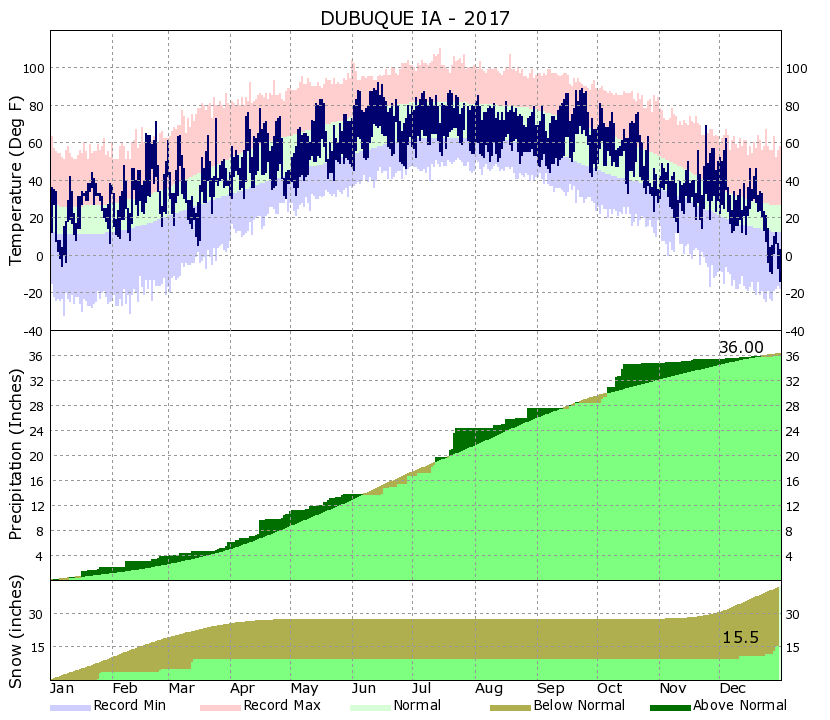
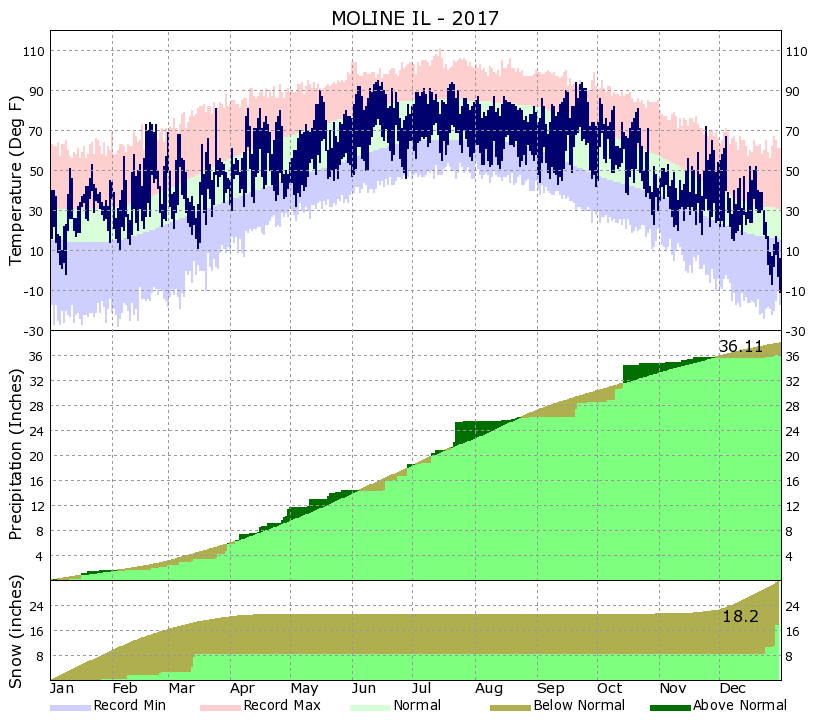
| 2017 was about 1 to 3 degrees above normal. | ||||||||||||||||||||||||||||||||||||||||||||||||||||||||||||||||||||||||||||||||||
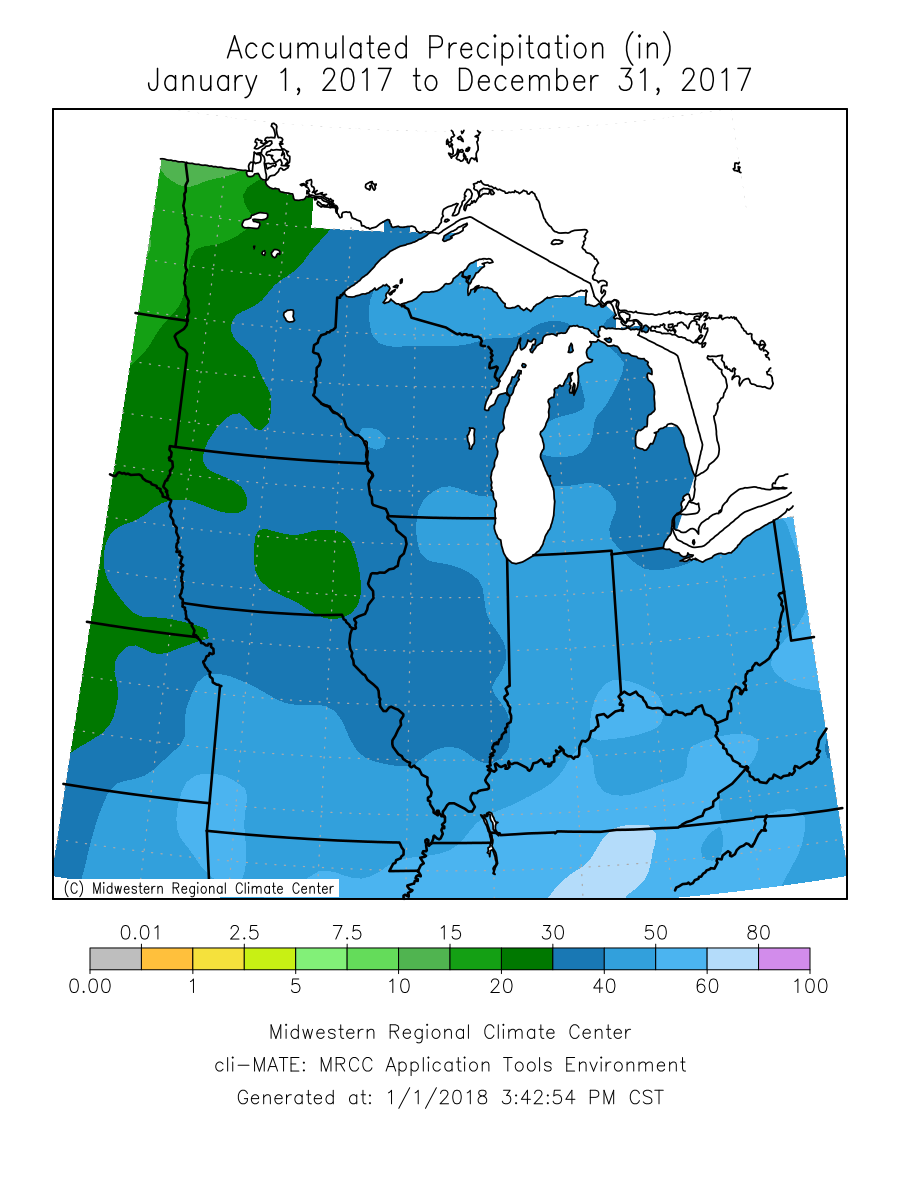
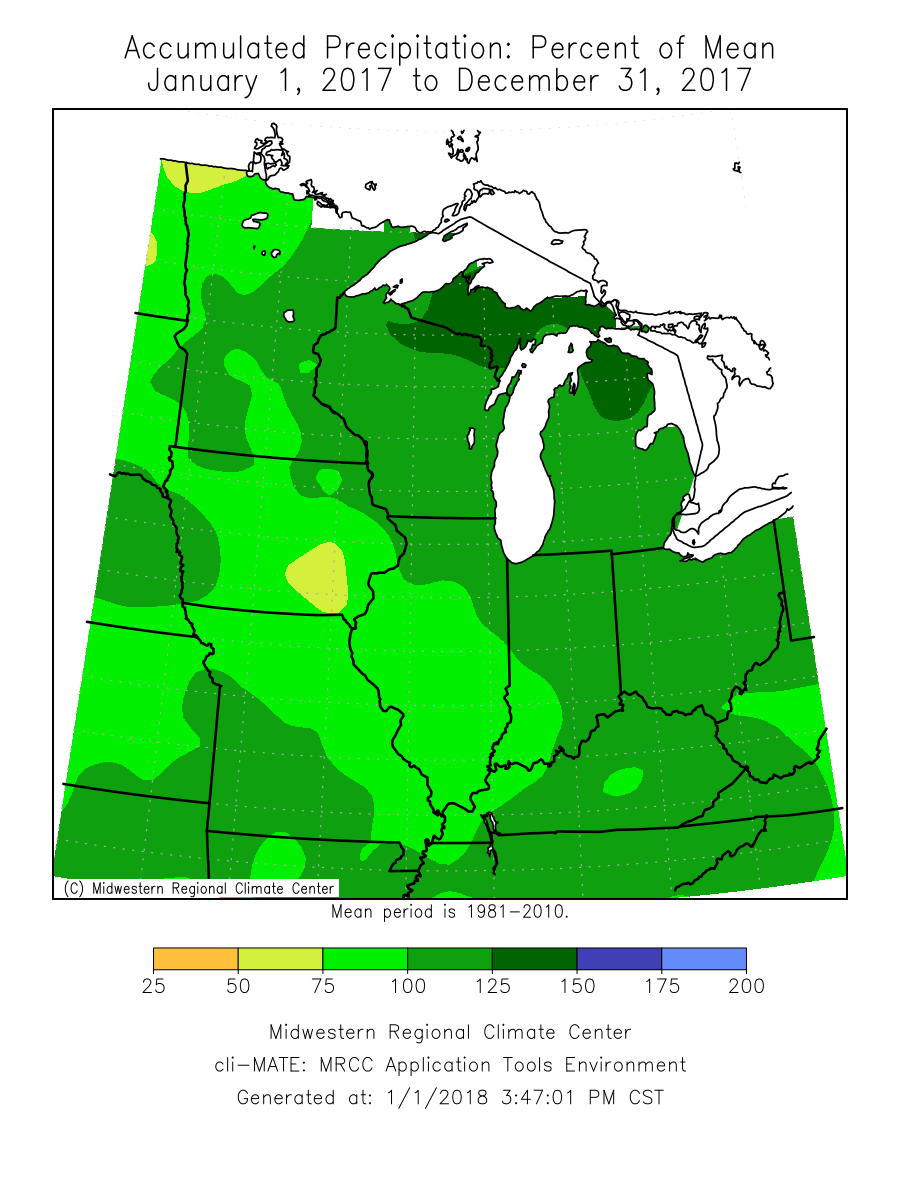
| Precipitation totals for 2017 ranged from around 1 inch above normal at Davenport to near 9 inches below normal at Cedar Rapids. | ||||||||||||||||||||||||||||||||||||||||||||||||||||||||||||||||||||||||||||||||||
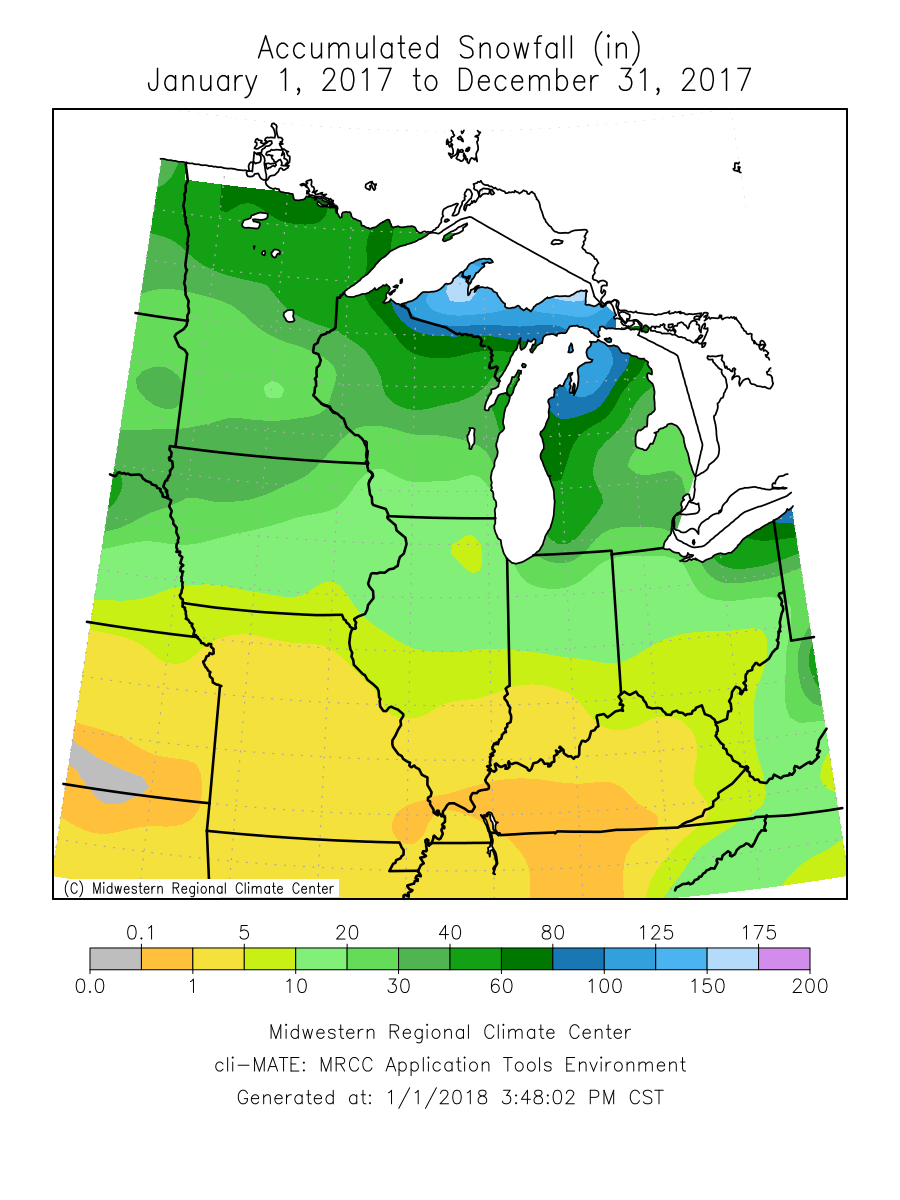
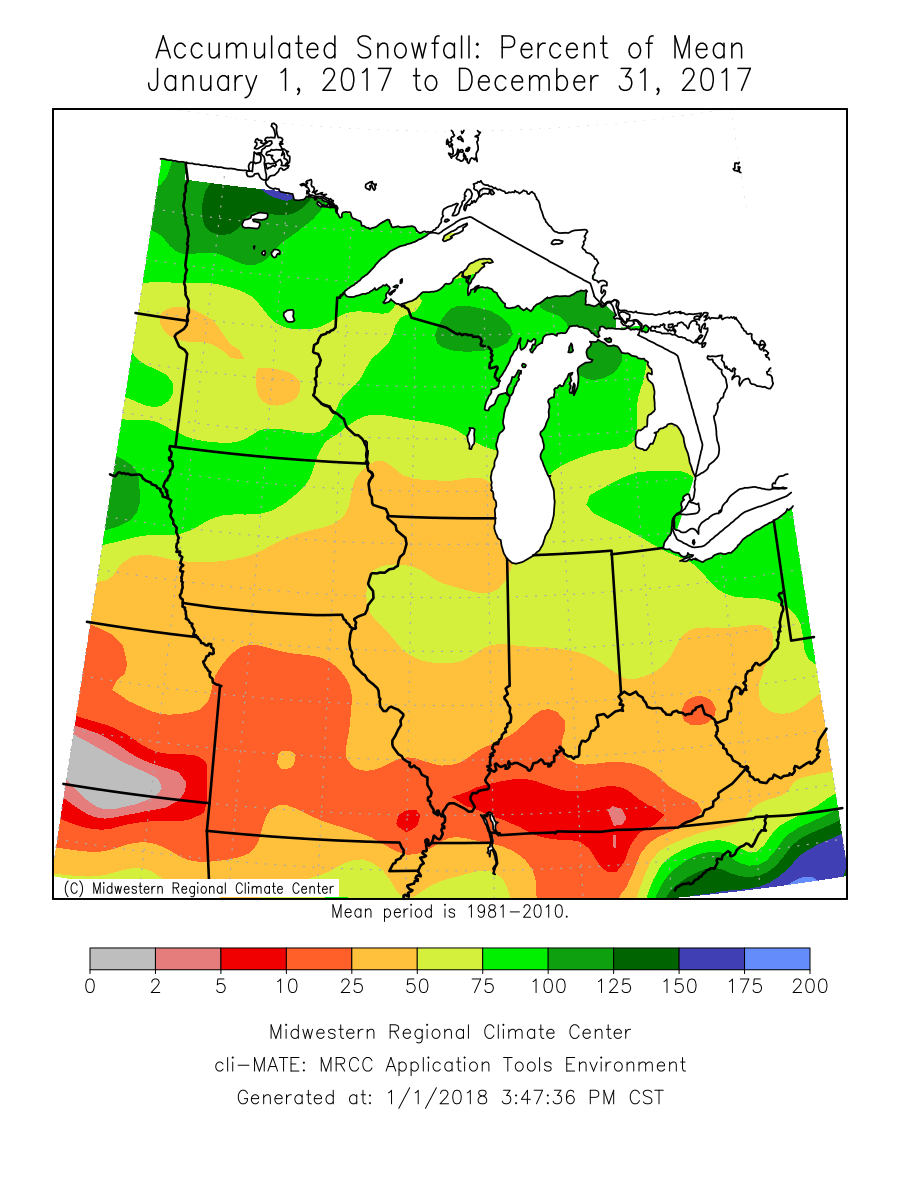
| Snowfall totals for 2017 were between 10 to 25 inches below normal. Dubuque recorded it's second least snowy season on record. | ||||||||||||||||||||||||||||||||||||||||||||||||||||||||||||||||||||||||||||||||||
| Please see Annual Records for annual record information. | ||||||||||||||||||||||||||||||||||||||||||||||||||||||||||||||||||||||||||||||||||
| The climate maps below are courtesy of the Midwest Regional Climate Center. | ||||||||||||||||||||||||||||||||||||||||||||||||||||||||||||||||||||||||||||||||||
| These maps will be updated on January 1, 2017. | ||||||||||||||||||||||||||||||||||||||||||||||||||||||||||||||||||||||||||||||||||
|
||||||||||||||||||||||||||||||||||||||||||||||||||||||||||||||||||||||||||||||||||
| 2017 Climate Graphs | ||||||||||||||||||||||||||||||||||||||||||||||||||||||||||||||||||||||||||||||||||
|
||||||||||||||||||||||||||||||||||||||||||||||||||||||||||||||||||||||||||||||||||
| A LOOK AHEAD | ||||||||||||||||||||||||||||||||||||||||||||||||||||||||||||||||||||||||||||||||||
|
||||||||||||||||||||||||||||||||||||||||||||||||||||||||||||||||||||||||||||||||||