A significant heat wave continues for the Rockies, Northern Plains, and Great Lakes into the Mid-Atlantic, peaking in intensity through midweek and lingering across parts of the Northern Plains and Midwest until this weekend. Excessive rainfall my bring life-threatening and locally catastrophic flash and urban flooding across portions of southwestern Texas through early Friday. Read More >
|
For a complete regional overview of the outbreak, visit this NWS StoryMap. For a recap from long time NWS Quad Cities Forecaster, John Haase, visit here. |
||||||||||||||||||||||||||||||||||||||||||||||||||||||||||||||||
| Overview | Maps | List | Discussions | Photos | ||||||||||||||||||||||||||||||||||||||||||||||||||||||||||||||||
General Overview |
||||||||||||||||||||||||||||||||||||||||||||||||||||||||||||||||
|
||||||||||||||||||||||||||||||||||||||||||||||||||||||||||||||||
| Overview | Maps | List | Discussions | Photos | ||||||||||||||||||||||||||||||||||||||||||||||||||||||||||||||||
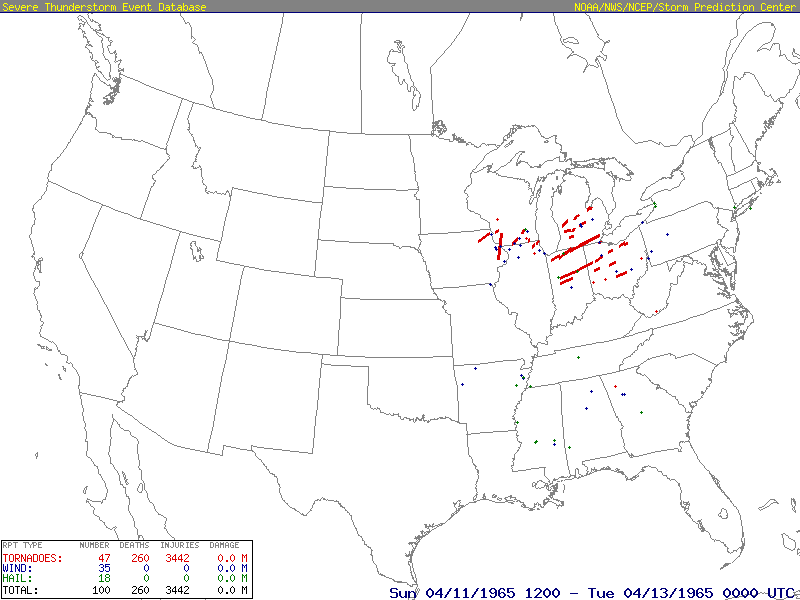
Storm Reports / Maps |
||||||||||||||||||||||||||||||||||||||||||||||||||||||||||||||||
| Storm Reports | ||||||||||||||||||||||||||||||||||||||||||||||||||||||||||||||||
 |
||||||||||||||||||||||||||||||||||||||||||||||||||||||||||||||||
| 1 pm 4/11/65 through 1 am 4/12/65 | ||||||||||||||||||||||||||||||||||||||||||||||||||||||||||||||||
|
||||||||||||||||||||||||||||||||||||||||||||||||||||||||||||||||
Tornado Report Summary |
||||||||||||||||||||||||||||||||||||||||||||||||||||||||||||||||
|
||||||||||||||||||||||||||||||||||||||||||||||||||||||||||||||||
| Overview | Maps | List | Discussions | Photos | ||||||||||||||||||||||||||||||||||||||||||||||||||||||||||||||||
Pre-Event Discussions and Maps |
||||||||||||||||||||||||||||||||||||||||||||||||||||||||||||||||
|
||||||||||||||||||||||||||||||||||||||||||||||||||||||||||||||||
| Overview | Maps | List | Discussions | Photos | ||||||||||||||||||||||||||||||||||||||||||||||||||||||||||||||||
Post-Event Discussions / Newpaper Articles |
||||||||||||||||||||||||||||||||||||||||||||||||||||||||||||||||
|
||||||||||||||||||||||||||||||||||||||||||||||||||||||||||||||||


.gif)