
Widespread life-threatening flash and urban flooding will continue to pose a significant threat to life and property in south-central Texas. Catastrophic fiver flooding, with rapid rises on small streams, arroyos, and typically dry washes, is expected. Monsoonal showers persist across the Great Basin and Southwest with greatest flash flooding in southern Arizona. Read More >
The blizzard that struck the Midwest in November 1940 was the type of snow storm that engenders legends. Fall was extremely mild and across the Upper Midwest temperatures were well above normal on the morning of November 11th. So warm that at 7:30 in the morning the temperature at Chicago was 55 degrees Fahrenheit, and at Davenport Iowa the temperature was 54. Armistice Day 1940 was a perfect opportunity for many individuals to enjoy the mild respite before winter. Little did they know the most infamous duck hunt in American history was about to unfold. When the storm exited the region over a foot of snow had fallen, and more than 150 people and thousands of livestock were dead.
|
Historical Background Weather observations, forecasts and warnings were much different in 1940 and so were the ways people received information. Until 1934 the Weather Bureau offices operated 12-15 hours a day with two basic observations taken at 8 a.m. and 8 p.m. The observations were transmitted via telegraph. There were no satellite images and few upper air observations. In the Midwest the Chicago District issued weather forecasts for Illinois, Indiana, Iowa, Michigan, Wisconsin, Minnesota, North Dakota, and South Dakota. Weather Bureau forecasts, which were issued mid morning and mid evening, were brief and general. Distribution methods ranged from reports in newspapers, on cards displayed in the lobbies of public buildings, radio broadcasts, or by telegraph. Cold wave warnings which were prepared for citrus fruit growers, cranberry, tobacco interests, and iron ore shippers were based upon forecasters recognizing a particular weather pattern and its potential effect. Weather Bureau offices in cities like Davenport and Dubuque provided weather observations which were sent to the district offices via teletype. A wealth of weather observational records which had been accumulated since the 1800’s were basically underutilized until computers improved the ability to record and retrieve data. During the modernization of 1934 card punching of weather data began and phone calls to Weather Bureau offices increased to about 100 phone requests a day for climate information (Whitnah, 1961). In 1938 a “breakfast forecast” was introduced, and predictions were revised four times a day (4 a.m. & 4 p.m., 10 a.m. & 10 p.m.). For rural communities weather information was limited, but certainly available, since it was common for telephone operators and carriers on rural free delivery mail routes to distribute this information (Whitnah, 1961). In 1940 long range forecasting was introduced. This longer forecast, which covered 5 days and which was issued twice a week, was based upon upper air pressure data and correlated with past weather patterns (Whitnah, 1961). |
The Story Before the Story
A few days earlier a strong weather system moving into the Pacific Northwest had taken down the Tacoma Narrows Bridge. Until the collapse on November 7, 1940 the bridge had been the 3rd longest suspension span in the world. The Tacoma Narrows Bridge, an engineering wonder, had already acquired the name Galloping Gertie due to its motion in the wind. A four mile an hour breeze could start oscillations in the bridge while stronger breezes often had no effect. On November 7, 1940 winds of 35 to 45 mph caused center span to undulate 3-5 feet and the bridge failed before the center of the storm system reached shore. On November 8, 1940 storm center remained off the Washington coast producing gale force winds. Meanwhile pressure was falling over the Pacific Northwest.
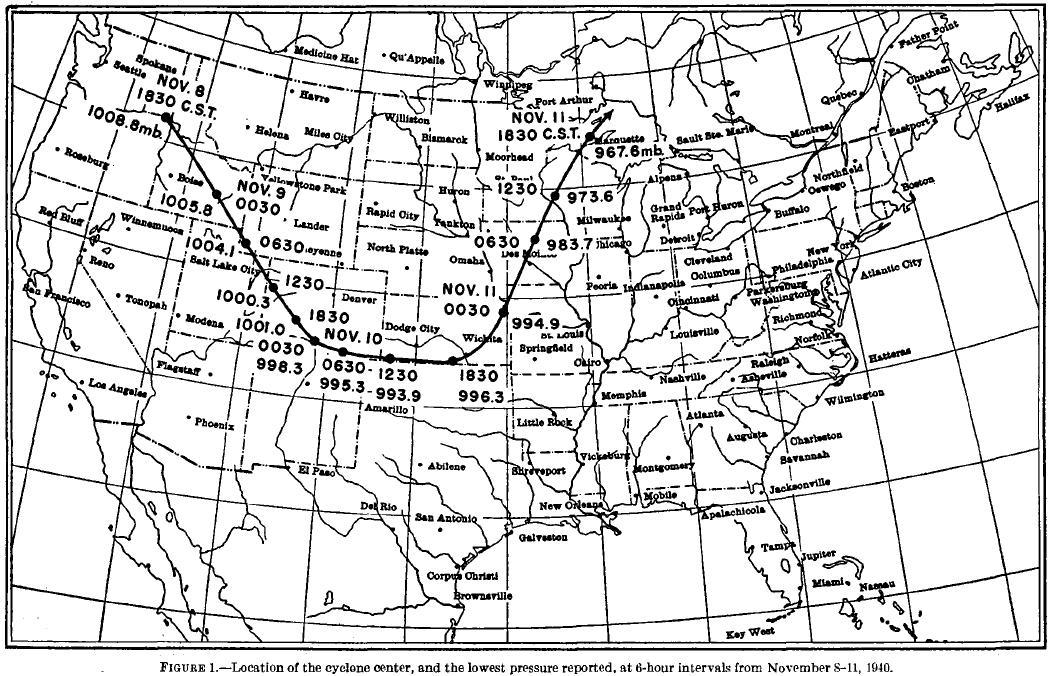
By November 10th the storm system had moved across the Rocky Mountains to redevelop over Trinidad Colorado (Knarr, 1941). Initially the system pushed east then it curved northward into the central United States where it would leave a path of icy destruction. During the next 6 hours the storm center moved to vicinity of Iowa Falls, Iowa. West of the center blizzards raged across South Dakota and a widespread ice storm across Nebraska left hundreds of people impacted by the storm. East of the center a broad swath of warm air streamed up the Mississippi Valley.
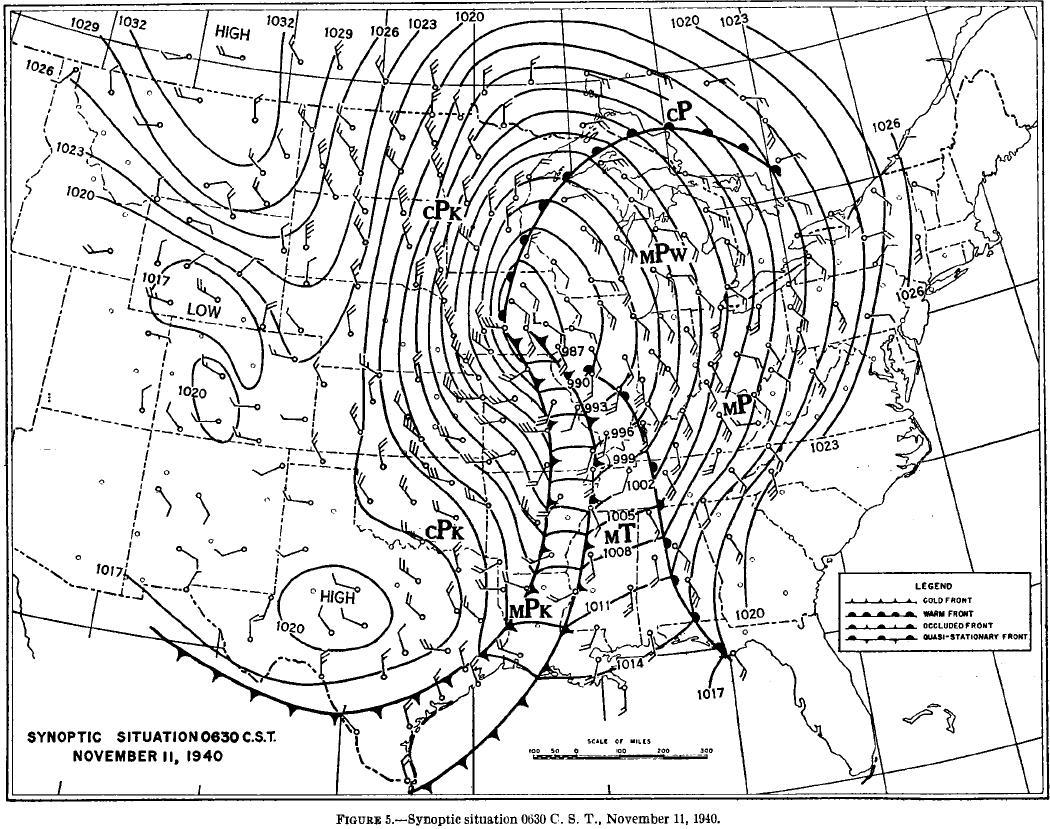
On the weather maps, note two cold fronts and the broad current of moist warm air.

The storm rapidly intensified. Center pressure decreased 28.7 mb as
the storm moved approximately 825 miles in a 24 hour period.
In the Quad Cities people awoke to balmy temperatures on November 11th. It had rained overnight and early morning temperatures were in the 50s (Swails, 2005). Many businesses and schools were closed due to the Armistice Day holiday; and duck hunters were pleased by the opportunity to take to the fields and streams. Few suspected the weather was about to change.
During the day and into the night severe weather erupted across much of the Midwest. A tornado was reported one mile west of Davenport Iowa, 2-3 inches of heavy rain fell over the Mississippi Valley, and heavy snow began to fall across Minnesota and Western Iowa. Gale velocities were measured at 80 mph at Grand Rapids, Michigan, and were estimated to be even higher over the lakes. By the time the storm was centered over Lake Superior the barometer reading had plummeted to 28.57 inches of mercury.
|
Day
|
Max Temperature (°F)
|
Minimum Temperature (°F)
|
|
10
|
50
|
41
|
|
11
|
49
|
13
|
|
12
|
17
|
7
|
|
13
|
20
|
1
|
|
14
|
21
|
2
|
|
15
|
24
|
1
|
|
16
|
47
|
18
|
|
Day
|
Max Temperature (°F)
|
Minimum Temperature (°F)
|
|
10
|
50
|
44
|
|
11
|
53
|
15
|
|
12
|
22
|
11
|
|
13
|
23
|
3
|
|
14
|
21
|
3
|
|
15
|
28
|
1
|
|
16
|
51
|
20
|
The People
Hunters taking advantage of the holiday and extremely mild weather were rewarded with an overabundance of waterfowl. Many would later comment that they had never seen so many birds, but the birds knew something most of the hunters didn’t. They were getting out of the way of an approaching storm.
Across the Midwest hundreds of duck hunters, not dressed for the cold, were overtaken by the storm. Winds came suddenly then masses of ducks arrived flying low to the ground (Washburn, 2008). Hunters, awed by the site of unending flocks of birds, failed to recognize the impending weather signs that a change was in process. Rain started and temperatures fell rapidly. By the time the rain, sleet, then heavy snow reduced the visibility to zero, hunters lost their opportunities to return safely to shore. Hundreds of duck hunters lost boats, gear and guns as 15 foot swells and 70 -80 mph winds swept down channels and marshy backwaters. Some hunters drowned, others froze to death when the near 60 degree temperatures plummeted, first to freezing, then into the single digits (Knarr, 1941; Swails, 2005; Washburn, 2008).
During the next few days search parties retrieved frozen hunters from islands and the icy waters. Some of those lucky enough be stranded on islands survived the storm, but lost hands or feet due to severe frost bite.
Transportation and Infrastructure
Across the upper Midwest drifts up to 20 feet high buried cars and rescuers had to force long probes into the rock hard drifts in their search for missing people. Passenger trains were stranded, and roads and highways remained closed for days. Newspaper deliveries were halted; telephone and power lines were damaged as were homes, barns, and outbuildings in Minnesota, Wisconsin, Illinois, Iowa, and Michigan.
Historians note storms were responsible for many shipwrecks, and November storms were known to strike with incredible fury (Oosting, 2008). In spite of this there was a tremendous incentive for ships to go out during the most dangerous season for their cargoes of coal, grain, and crops were in great demand (Great Lakes Shipwreck Museum, 2009). Food supplies were needed to get through the winter, and coal was essential for heating. Mariners, aware of the dangers on the Great Lakes, paid close attention to the weather. But during the Armistice Day storm many of the crews were unaware that the winds would shift until their ships were struck broadside by the full force of the wind. During the storm three large ships sank near Pentwater, Michigan and 58 lives were lost. Survivors on ships that ran aground waited for days on their damaged vessels until winds subsided and rescue boats could be launched from shore. Communities expecting the cargos for their winter supplies were significantly impacted by the loss of food and fuel (Oosting, 2008).
The Destruction of an Industry
Before the Armistice Day Blizzard of 1940 the state of Iowa was a leading fruit growing region, second only to Michigan in apple production. As the storm’s center passed near Winterset Iowa, a ferocious ice storm delivered a devastating blow to the apple industry. Icy winds killed hundreds of apple trees, and planting a new orchard was expensive. In 1940 the threat of war was growing and the nation was preparing for hard times. If trees were planted it would be years before they would be capable of producing fruit. The economic impacts to apple growers were so significant that the landscape across Iowa was permanently changed when orchards were transformed into fields of faster growing crops like corn and soybeans (Friese, 2008).
Implications for Today
Operational meteorology is both a physical and social science. Meteorologically the Armistice Day Storm is noteworthy for its rapid intensification and widespread damage. During the storm low pressure deepened 1-2 millibars per hour over a 24 hour time period. The storm system spawned severe weather including tornadoes, wind, extreme winter weather, and blizzard conditions across the central United States. Studies and reports following the storm helped change the face of forecasting, for this storm strengthened support to keep weather offices open 24 hours a day.
The Armistice Day Storm remains noteworthy to society because it was a seminal event that continues to impact humans. Anything that endures as part of a culture from one generation to another is considered a seminal event; and the societal impacts of such an event can change lives and change history. The consequences of societal impact alter the ways in which people live, work, play, relate to one another, organize to meet their needs and generally cope as members of society. Forecasters must assess the potential for societal impacts when they strive to understand the atmospheric environment, timing of an event, and the social environment in their warning areas. Any event with the potential for folk-lore will produce societal impact.
The longer we accumulate weather records the more likely we are to find extreme weather events. An assessment of societal impacts has the potential to help individuals and communities understand and anticipate possible social consequences of an event in regards to human populations. It is becoming standard practice to weave social science into weather and climate research (Gruntfest & Lazrus, 2009). Over time public perceptions are changed partly due to massive growth in media coverage, but also because real-time media with gripping images bring storm and disasters into our living rooms.
Generations have based their understanding of extreme winter weather against the storm that struck on Armistice Day 1940. Seventy years later the Armistice Day Blizzard remains the second most requested bit of information from the Minnesota State Climatologist office (Boulay, 2009). In Iowa this catastrophic event changed agricultural growing practices as apple growers switched from tending orchards to corn and soybean production. Evidence of the Armistice Day Blizzard is recorded in newspaper clippings, photos, museum collections, and stories of this event have been captured in cookbooks, journal articles, and passed on through family oral traditions. This storm produced an impact on society due to the death and destruction left in its wake. If one measures the impact of an event by the diversity of the information that remains this storm was indeed memorable.

