
Extreme heat continues today from the central Plains to the lower Mississippi River Valley, over southeast Montana, and from southern California into the Southwest Deserts. Extreme Heat Warnings remain in effect. Severe thunderstorms capable of strong to severe wind gusts and large hail are possible across the Great Lakes into the Ohio Valley today into tonight. Read More >
| Climate/Almanac Data - JUN Normals - JUN Records | ||||||||||||||||||||||||||||||||||||||||||||||||||||||
| JUNE | ||||||||||||||||||||||||||||||||||||||||||||||||||||||
| *(Climate Normals (1991-2020)* | ||||||||||||||||||||||||||||||||||||||||||||||||||||||
|
||||||||||||||||||||||||||||||||||||||||||||||||||||||
| The ranking is listed in parentheses (__) when within the "Top 10". | ||||||||||||||||||||||||||||||||||||||||||||||||||||||
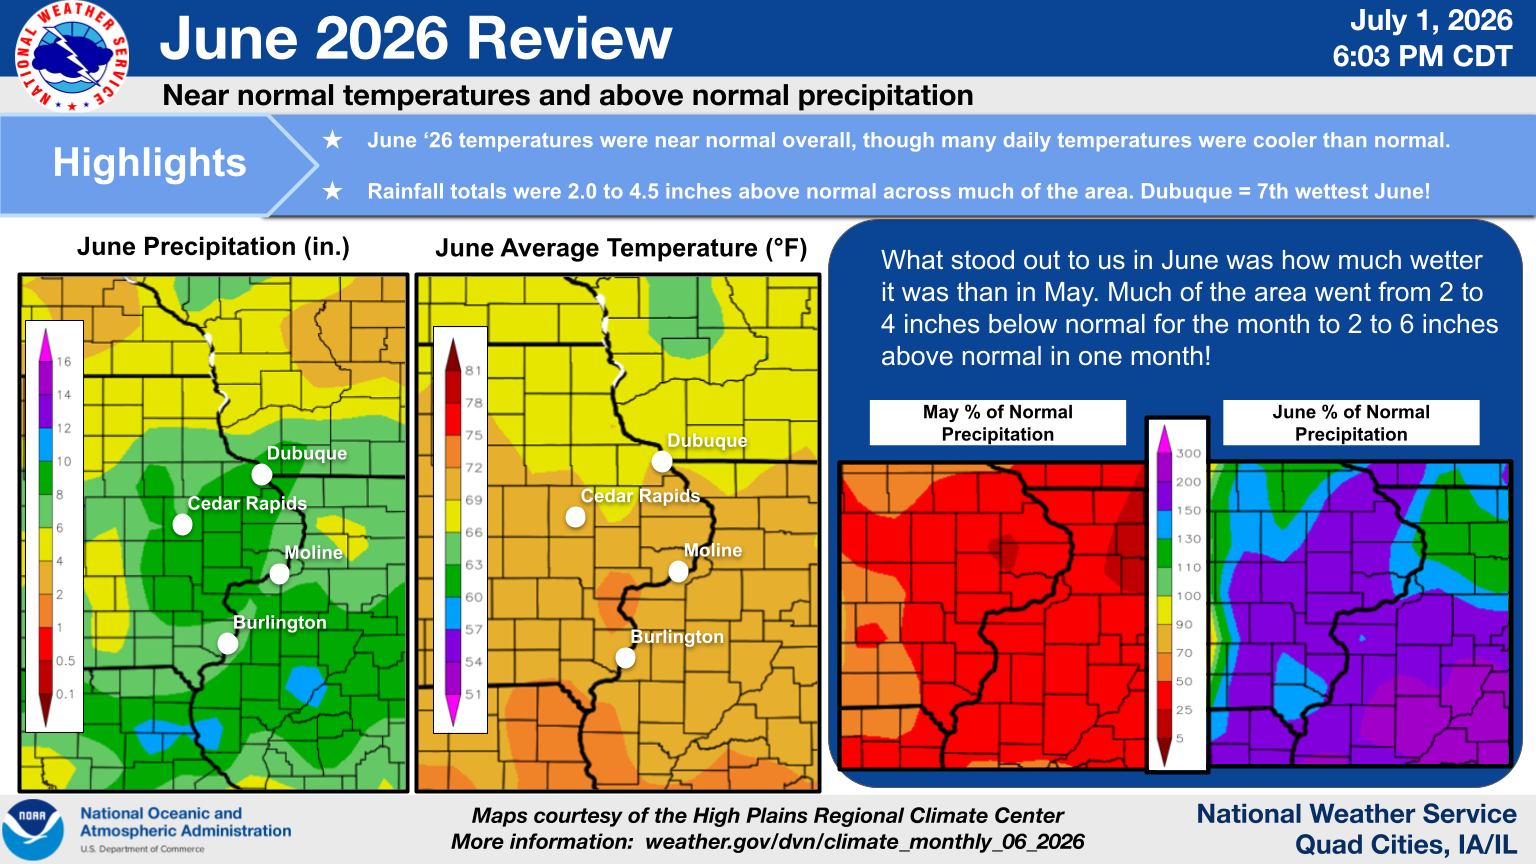
| June 2026 was generally 0.2° to 1.2° below normal. The exception was Dubuque which was 0.8° above normal. | ||||||||||||||||||||||||||||||||||||||||||||||||||||||
| Precipitation totals were 2 to 4.5 inches above normal. | ||||||||||||||||||||||||||||||||||||||||||||||||||||||
| Please see June Records for monthly record information. Also see our new climate graphs and charts for some slick visuals! | ||||||||||||||||||||||||||||||||||||||||||||||||||||||
 |
||||||||||||||||||||||||||||||||||||||||||||||||||||||
| The climate maps below are courtesy of the Midwest Regional Climate Center. | ||||||||||||||||||||||||||||||||||||||||||||||||||||||
|
||||||||||||||||||||||||||||||||||||||||||||||||||||||
| A LOOK AHEAD | ||||||||||||||||||||||||||||||||||||||||||||||||||||||
| Climate Prediction Center | ||||||||||||||||||||||||||||||||||||||||||||||||||||||
|
||||||||||||||||||||||||||||||||||||||||||||||||||||||


