Widespread life-threatening flash and urban flooding continues in south-central Texas, with considerable flooding impacts possible across central Texas. Wildfire smoke is impacting air quality across much of the Great Lakes region into southern New England and the Mid-Atlantic. Monsoonal thunderstorms may produce isolated to scattered flash flooding across the Southwest into the Great Basin. Read More >
| Climate/Almanac Data - Sep Normals - Sep Records | ||||||||||||||||||||||||||||||||||||||||||||||||||||||
| SEPTEMBER | ||||||||||||||||||||||||||||||||||||||||||||||||||||||
|
||||||||||||||||||||||||||||||||||||||||||||||||||||||
| The ranking is listed in parentheses (__) when within the "Top 10". | ||||||||||||||||||||||||||||||||||||||||||||||||||||||
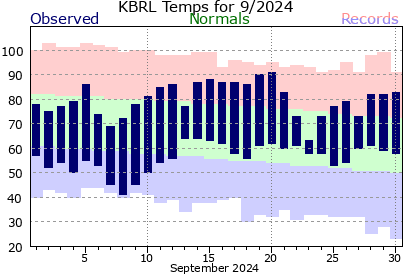
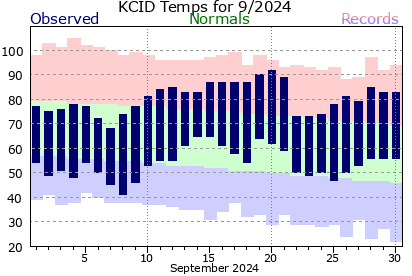
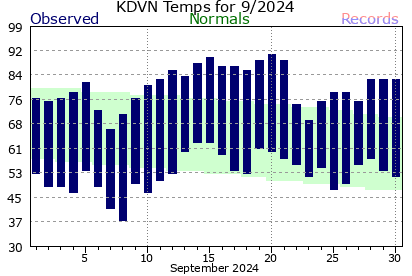
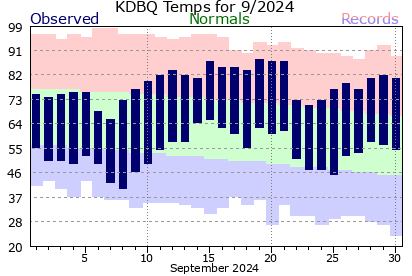
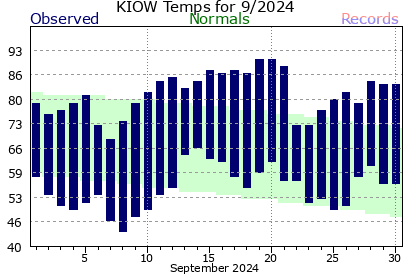
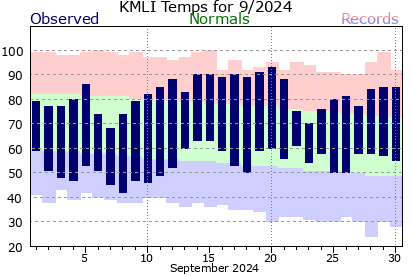
| September 2024 was about 1.5 to 4.5 degrees above normal. | ||||||||||||||||||||||||||||||||||||||||||||||||||||||
| Precipitation totals were about 3 to 3.75" below normal! | ||||||||||||||||||||||||||||||||||||||||||||||||||||||
| Cedar Rapids only saw rain 3 days, with each time only amounting to a trace (not measurable)! It was the driest September ever! | ||||||||||||||||||||||||||||||||||||||||||||||||||||||
| Please see Sep Records for monthly record information. | ||||||||||||||||||||||||||||||||||||||||||||||||||||||
|
||||||||||||||||||||||||||||||||||||||||||||||||||||||
| The climate maps below are courtesy of the Northeast Regional Climate Center | ||||||||||||||||||||||||||||||||||||||||||||||||||||||
| These maps should update to the most recent "last month" on the first of the month. | ||||||||||||||||||||||||||||||||||||||||||||||||||||||
|
|
||||||||||||||||||||||||||||||||||||||||||||||||||||||
|
||||||||||||||||||||||||||||||||||||||||||||||||||||||
| A LOOK AHEAD | ||||||||||||||||||||||||||||||||||||||||||||||||||||||
| Climate Prediction Center | ||||||||||||||||||||||||||||||||||||||||||||||||||||||
|
||||||||||||||||||||||||||||||||||||||||||||||||||||||