Mt. Joy (North Davenport) Industrial Fire
February 20, 2001
|
| FIRE CAPTURED ON RADAR
DAVENPORT, IOWA -- A fire started at a large industrial building in Mt. Joy--or Davenport's North side--on February 20, 2001, around 7am CST. This building was formerly home to a Caterpillar, Inc., production facility. Presently, the building houses various businesses and a fast food establishment.
During the fire, the smoke plume was visible for up to 20-30 miles from its source. For example, phone reports to the NWS indicated the smoke plume was visible from the Maquoketa, Iowa, area. Northwest winds carried the plume towards the southeast--over eastern Davenport, western Bettendorf, and parts of Rock Island and Moline. The smoke plume was rather pronounced, especially close to its source.
|
Radar Images and Pictures
|
| Click on each image below for a larger picture. These images are provided by the NWS offices in the Quad Cities and Des Moines. |
|
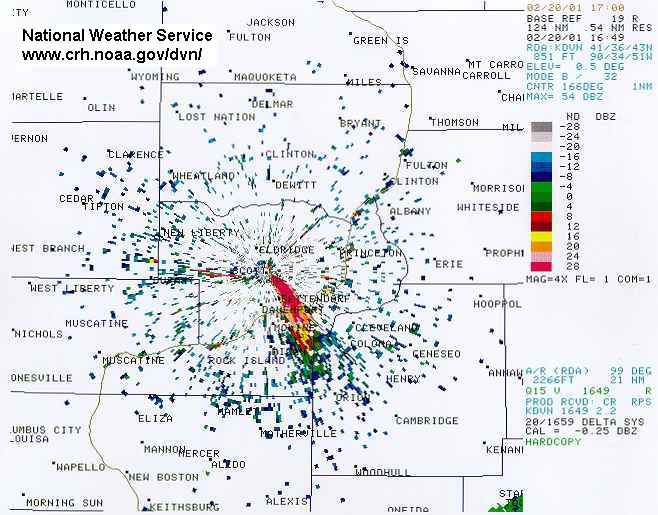
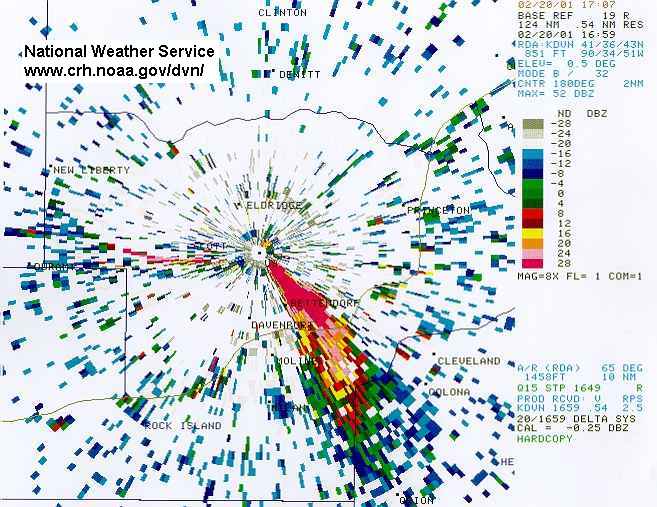
NWS Quad Cities Doppler Radar, Feb 20 2001, 1049am CST. Radar is in clear air mode. Color scale is at middle right. Map shows county boundaries and many towns. Image from NWS Quad Cities.
|
NWS Quad Cities Doppler Radar, Feb 20 2001, 1059am CST. Radar is in clear air mode. Color scale is at middle right. Map shows county boundaries and many towns. Image from NWS Quad Cities.
|
|

NWS Quad Cities Doppler Radar, Feb 20 2001, 1008am CST. Radar is in clear air mode. Color scale is at upper left. Map shows county boundaries and many major roads. Image courtesy of NWS Des Moines, Iowa.
|
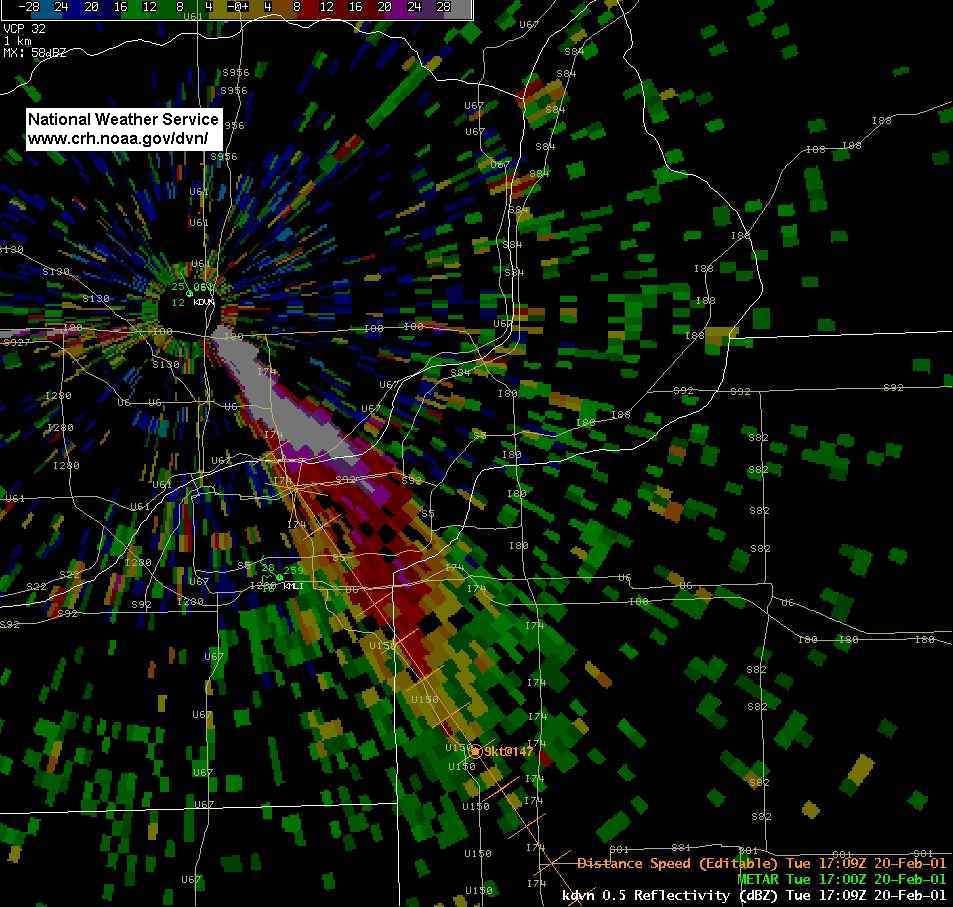
NWS Quad Cities Doppler Radar, Feb 20 2001, 1109am CST. Radar is in clear air mode. Color scale is at upper left. Map shows county boundaries and many major roads. Image courtesy of NWS Des Moines, Iowa.
|
|
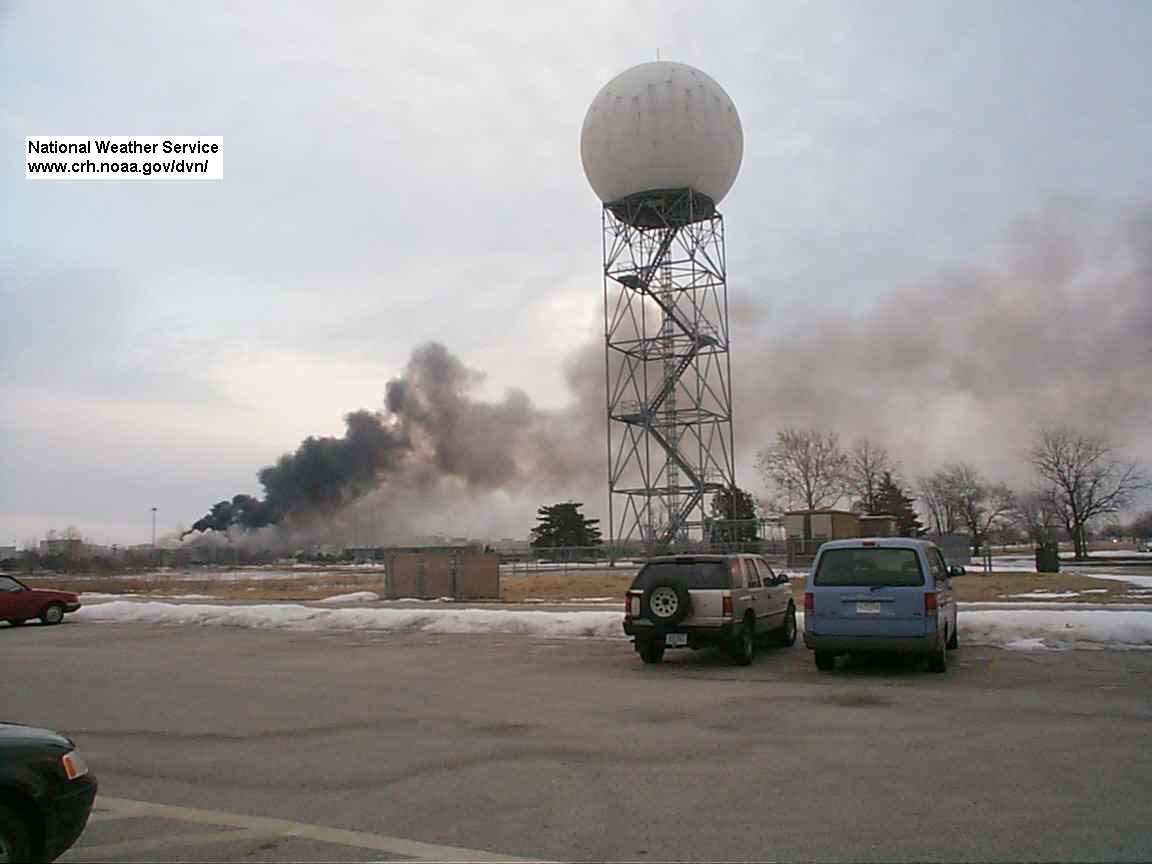
Smoke plume around 730am CDT. View is towards the northeast, from the NWS Quad Cities office parking lot. NWS Quad Cities photo.
|
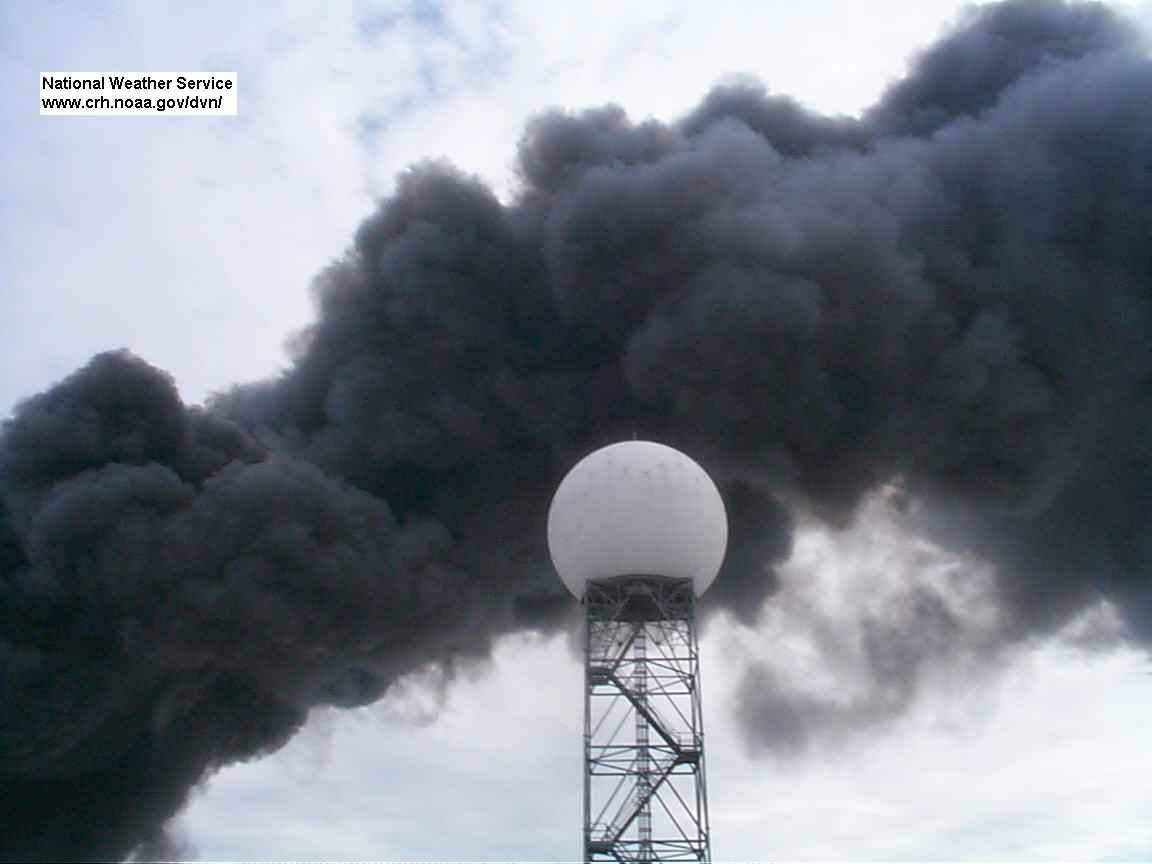
Smoke plume around 1015am CST. View is towards the northeast, from the NWS Quad Cities office grounds. NWS Quad Cities photo.
|
|
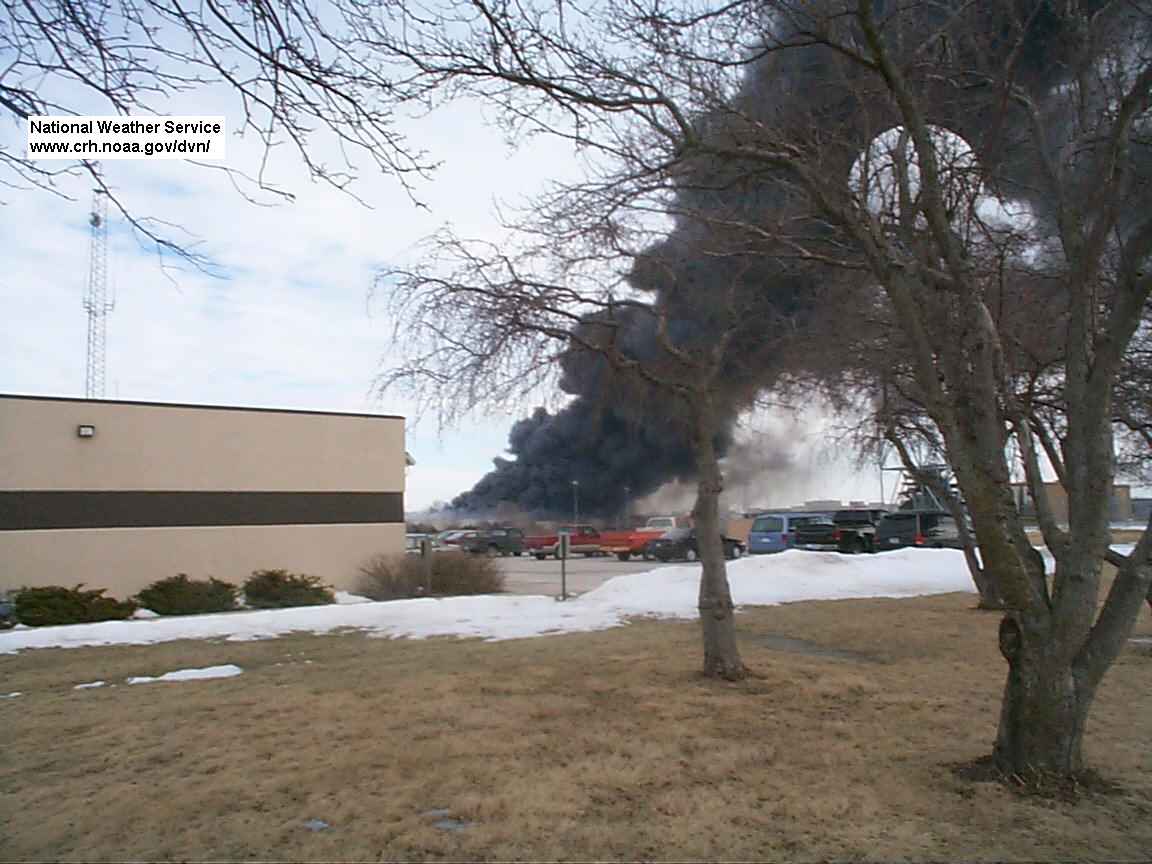
Smoke plume around 1015am CDT. View is towards the northeast, from the NWS Quad Cities office grounds. (NWS Quad Cities office building is in the picture's middle left.) NWS Quad Cities photo
|
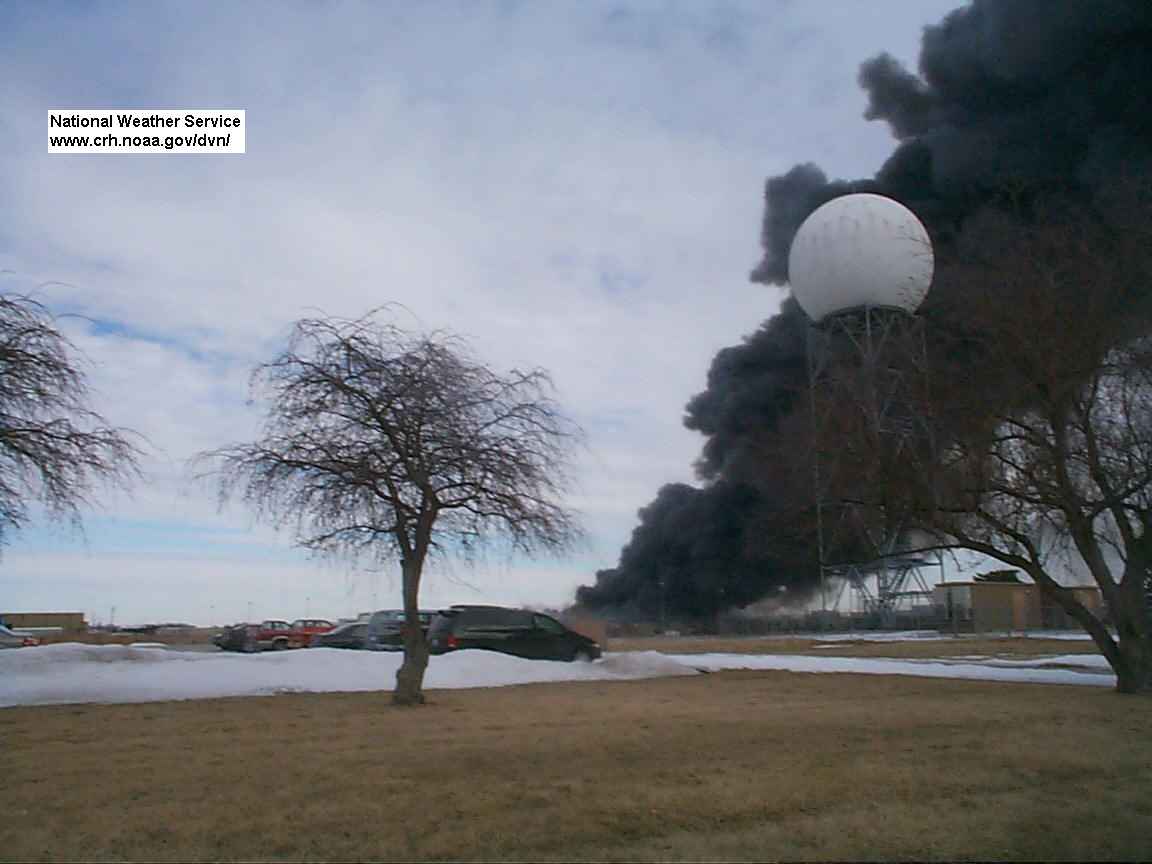
Smoke plume around 1015am CDT. View is towards the east, from the NWS Quad Cities office parking lot. (NWS Quad Cities Doppler Radar tower is in the picture's center.) NWS Quad Cities photo.
|
Upper Air Graphics
|
| Atmospheric conditions are among the major factors in determining a smoke plume's height, horizontal extent, and dispersion. Upper air soundings are useful tools to help determine atmospheric conditions.
Upper air sounding plots show a vertical cross-section of atmospheric conditions at approximately a given time (in this case, around 6am CST on Feb 20 2000). Sounding plots normally include temperature, dew point, and wind direction and speed information. These plots help show how temperature, moisture, and wind conditions change with height. The temperature line is normally to the right of (or on) the dew point line, as temperature is normally greater than (or equal to) the dew point.
The vertical scale's units normally appear in atmospheric pressure units (e.g., millibars (or mb)). Whereas elevation increases with height, atmospheric pressure decreases with height.
Below are two images derived from an upper air sounding taken at the NWS Quad Cities office in Davenport on Feb 20 2000, around 6am CST. (The Quad Cities NWS office normally makes two upper soundings per day.) Both images include temperature, dew point, and wind information. The image on the right also includes the corresponding absolute height (in meters above sea level) occurring with the given pressure level. To convert from meters to feet, multiply by 3.28. Then subtract 751 feet from these heights (i.e., the elevation of the NWS Quad Cities office above sea level) to find the height above ground level.
See additional information immediately following these two images and their captions.
|
|
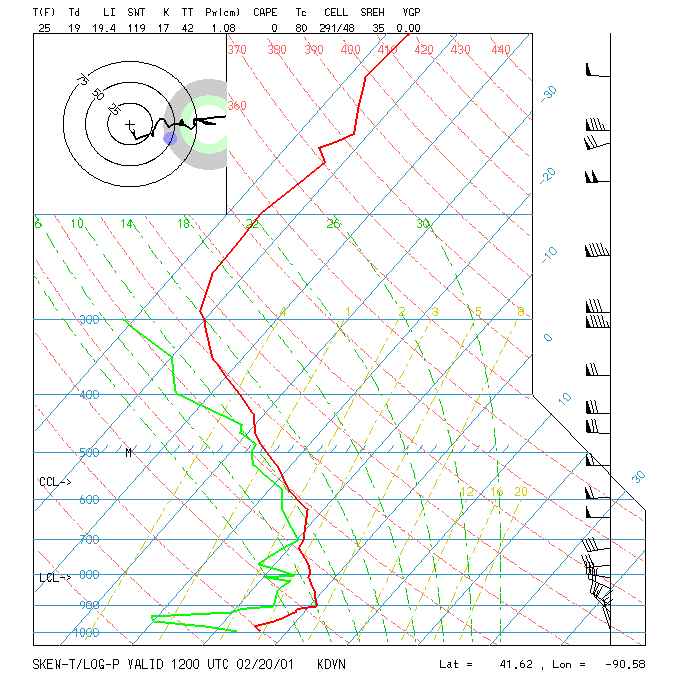
NWS Quad Cities Davenport, Iowa, Upper Air Sounding, Feb 20 2001, 6am CST. Image from UCAR.
|
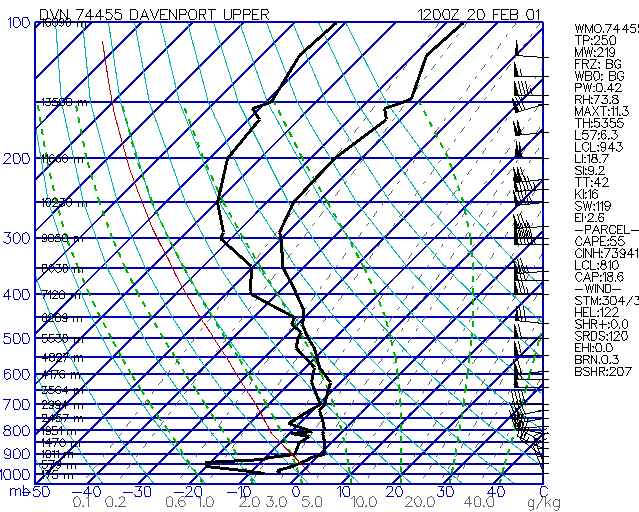
NWS Quad Cities Davenport, Iowa, Upper Air Sounding, Feb 20 2001, 6am CST. Image from the University of Wyoming.
|
| Temperature normally decreases with height. When temperature increases with height, an inversion occurs. Then, the point at which the temperature begins decreasing with height marks the top of the inversion. On the above upper air sounding plots, the temperature increases with height beginning from the lowest level and continuing to around 900 millibars (mb). Since the temperature begins decreasing with height above 900 mb, this particular height marks the top of this inversion. The image on the right indicates that 900 mb corresponds to a height of around 1,010 meters. Using the instructions above the images, this height corresponds to a height of around 2,560 feet above ground level at the NWS Quad Cities office.
Inversions are important because they can help indicate the height at which the smoke plume will transition from rising to spreading horizontally. Thus, the upper air sounding indicates this particular smoke reached a height of around 2,560 feet before it began spreading horizontally.
Normally, the heating of the day heats the atmosphere's lower levels more than higher levels, thus helping lift, weaken, or dissipate the inversion. In this particular case, the inversion lifted before it dissipated. The smoke plume reflected these changes by first lifting its base, then mixing more with air above it.
|
|

