Climate data on this page are preliminary (unofficial). Certified (official) climate data are available from the National Center for Environmental Information (NCEI).
| Top 10 years with the warmest annual mean daily temperature |
|---|
|
| Ranking | >Year | Mean Temperature (F) |
|---|
| 1 | >1954 | 59.03 |
| 2 | >1931 | 59.02 |
| 3 | >2012 | 58.78 |
| 4 | >1946 | 58.76 |
| 5 | >1938 | 58.74 |
| 6 | >1934 | 58.64 |
| 7 | >1921 | 58.52 |
| 8 | >1953 | 58.48 |
| 9 | >2006 | 58.38 |
| 10 | >1939 | 58.32 |
|
| Top 10 years with the warmest annual mean daily high temperature |
|---|
|
| Ranking | >Year | High Temperature (F) |
|---|
| 1 | >2012 | 70.1 |
| 2 | >1934 | 69.6 |
| 3 | >1938 | 69.2 |
| 4 | >1954 | 69.1 |
| 5 | >2006 | 68.9 |
| 5 | >1939 | 68.9 |
| 7 | >1946 | 68.8 |
| 8 | >1953 | 68.6 |
| 9 | >1956 | 67.9 |
| 10 | >2024 | 67.8 |
|
| Top 10 years with the warmest annual mean daily low temperature |
|---|
|
| Ranking | >Year | Low Temperature (F) |
|---|
| 1 | >1931 | 50.5 |
| 2 | >1921 | 49.6 |
| 3 | >1933 | 49.1 |
| 4 | >1954 | 49.0 |
| 5 | >1946 | 48.8 |
| 6 | >1953 | 48.4 |
| 6 | >1941 | 48.4 |
| 8 | >1938 | 48.3 |
| 9 | >2006 | 47.9 |
| 10 | >1998 | 47.8 |
|
| Top 10 years with the coldest annual mean daily temperature |
|---|
|
| Ranking | >Year | Mean Temperature (F) |
|---|
| 1 | >1985 | 51.46 |
| 2 | >1979 | 51.53 |
| 3 | >1996 | 52.02 |
| 4 | >1993 | 52.36 |
| 5 | >1978 | 52.41 |
| 6 | >1982 | 52.56 |
| 7 | >2014 | 52.72 |
| 8 | >2008 | 52.76 |
| 9 | >1917 | 52.77 |
| 10 | >1989 | 52.94 |
|
| Top 10 years with the coldest annual mean daily high temperature |
|---|
|
| Ranking | >Year | High Temperature (F) |
|---|
| 1 | >1985 | 61.1 |
| 2 | >1979 | 61.2 |
| 3 | >1892 | 61.5 |
| 4 | >1993 | 61.6 |
| 5 | >1996 | 61.8 |
| 6 | >1978 | 61.9 |
| 7 | >1982 | 62.1 |
| 7 | >1929 | 62.1 |
| 7 | >1912 | 62.1 |
| 10 | >1917 | 62.2 |
|
| Top 10 years with the coldest annual mean daily low temperature |
|---|
|
| Ranking | >Year | Low Temperature (F) |
|---|
| 1 | >1979 | 41.8 |
| 2 | >1985 | 41.9 |
| 3 | >1989 | 42.1 |
| 4 | >1996 | 42.2 |
| 5 | >2014 | 42.5 |
| 6 | >2008 | 42.7 |
| 6 | >1976 | 42.7 |
| 8 | >1978 | 43.0 |
| 9 | >1993 | 43.1 |
| 9 | >1982 | 43.1 |
|
| Top 10 years with the most annual precipitation |
|---|
|
| Ranking | >Year | Precipitation (in.) |
|---|
| 1 | >1961 | 60.25 |
| 2 | >1973 | 55.26 |
| 3 | >2001 | 53.50 |
| 4 | >2019 | 53.21 |
| 5 | >1985 | 52.72 |
| 6 | >1969 | 52.35 |
| 7 | >1993 | 51.46 |
| 8 | >1992 | 50.63 |
| 9 | >1898 | 50.25 |
| 10 | >1977 | 49.74 |
|
| Top 10 years with the least annual precipitation |
|---|
|
| Ranking | >Year | Precipitation (in.) |
|---|
| 1 | >1953 | 20.93 |
| 2 | >1936 | 21.51 |
| 3 | >2012 | 22.28 |
| 4 | >1976 | 23.68 |
| 5 | >1988 | 24.22 |
| 6 | >1963 | 24.65 |
| 7 | >1901 | 24.76 |
| 8 | >2002 | 24.77 |
| 9 | >1937 | 24.84 |
| 10 | >1956 | 25.92 |
|
| Top 10 years with the most annual snowfall |
|---|
|
| Ranking | >Year | Snowfall (in.) |
|---|
| 1 | >1912 | 63.1 |
| 2 | >1960 | 63.0 |
| 3 | >1898 | 48.0 |
| 4 | >1962 | 43.0 |
| 5 | >1897 | 40.2 |
| 6 | >1978 | 39.9 |
| 7 | >1983 | 36.1 |
| 8 | >1958 | 35.3 |
| 9 | >1926 | 35.0 |
| 10 | >1924 | 34.7 |
|
| Top 10 years with the warmest annual mean daily temperature |
|---|
|
| Ranking | >Year | Mean Temperature (F) |
|---|
| 1 | >2012 | 61.18 |
| 2 | >2016 | 59.91 |
| 3 | >2024 | 59.73 |
| 4 | >1954 | 59.03 |
| 5 | >2017 | 58.96 |
| 6 | >2023 | 58.91 |
| 7 | >2006 | 58.89 |
| 8 | >1946 | 58.76 |
| 9 | >1938 | 58.74 |
| 10 | >1934 | 58.64 |
|
| Top 10 years with the warmest annual mean daily high temperature |
|---|
|
| Ranking | >Year | High Temperature (F) |
|---|
| 1 | >2012 | 71.7 |
| 2 | >2024 | 69.8 |
| 2 | >2016 | 69.8 |
| 4 | >1934 | 69.6 |
| 5 | >2006 | 69.2 |
| 5 | >1938 | 69.2 |
| 7 | >2023 | 69.1 |
| 7 | >1954 | 69.1 |
| 9 | >1939 | 68.9 |
| 10 | >1946 | 68.8 |
|
| Top 10 years with the warmest annual mean daily low temperature |
|---|
|
| Ranking | >Year | Low Temperature (F) |
|---|
| 1 | >2012 | 50.6 |
| 2 | >2016 | 50.1 |
| 3 | >2024 | 49.7 |
| 4 | >2017 | 49.5 |
| 5 | >1981 | 49.2 |
| 6 | >1954 | 49.0 |
| 7 | >2015 | 48.9 |
| 7 | >1991 | 48.9 |
| 9 | >1999 | 48.8 |
| 9 | >1946 | 48.8 |
|
| Top 10 years with the coldest annual mean daily temperature |
|---|
|
| Ranking | >Year | Mean Temperature (F) |
|---|
| 1 | >1951 | 53.55 |
| 2 | >1961 | 54.01 |
| 3 | >1950 | 54.05 |
| 4 | >1940 | 54.39 |
| 5 | >1989 | 54.51 |
| 6 | >1985 | 54.57 |
| 7 | >1937 | 54.81 |
| 8 | >2008 | 54.82 |
| 9 | >1969 | 54.89 |
| 10 | >1945 | 54.91 |
|
| Top 10 years with the coldest annual mean daily high temperature |
|---|
|
| Ranking | >Year | High Temperature (F) |
|---|
| 1 | >1951 | 62.7 |
| 2 | >1985 | 63.2 |
| 3 | >1961 | 63.3 |
| 4 | >1969 | 63.7 |
| 5 | >1960 | 63.9 |
| 5 | >1940 | 63.9 |
| 7 | >1945 | 64.1 |
| 8 | >2008 | 64.2 |
| 9 | >2009 | 64.3 |
| 9 | >1958 | 64.3 |
|
| Top 10 years with the coldest annual mean daily low temperature |
|---|
|
| Ranking | >Year | Low Temperature (F) |
|---|
| 1 | >1950 | 43.8 |
| 2 | >1951 | 44.4 |
| 3 | >1989 | 44.7 |
| 3 | >1961 | 44.7 |
| 5 | >1940 | 44.8 |
| 6 | >1943 | 45.2 |
| 6 | >1937 | 45.2 |
| 8 | >1979 | 45.3 |
| 9 | >2008 | 45.4 |
| 9 | >1968 | 45.4 |
|
| Top 10 years with the most annual precipitation |
|---|
|
| Ranking | >Year | Precipitation (in.) |
|---|
| 1 | >1961 | 60.25 |
| 2 | >2001 | 54.12 |
| 3 | >1969 | 52.35 |
| 4 | >2008 | 51.86 |
| 5 | >2009 | 50.79 |
| 6 | >1944 | 49.64 |
| 7 | >1967 | 48.69 |
| 8 | >1965 | 47.74 |
| 9 | >1941 | 46.62 |
| 10 | >1998 | 46.51 |
|
| Top 10 years with the least annual precipitation |
|---|
|
| Ranking | >Year | Precipitation (in.) |
|---|
| 1 | >1988 | 19.17 |
| 2 | >2012 | 20.83 |
| 3 | >1953 | 20.93 |
| 4 | >1936 | 21.51 |
| 5 | >2022 | 22.96 |
| 6 | >1963 | 24.65 |
| 7 | >2018 | 24.72 |
| 8 | >1937 | 24.84 |
| 9 | >2021 | 25.26 |
| 10 | >1956 | 25.92 |
|
| Top 10 years with the warmest annual mean daily temperature |
|---|
|
| Ranking | >Year | Mean Temperature (F) |
|---|
| 1 | >2012 | 58.85 |
| 2 | >2024 | 58.74 |
| 3 | >1954 | 57.87 |
| 4 | >2023 | 57.71 |
| 5 | >2016 | 57.58 |
| 6 | >2006 | 57.19 |
| 7 | >2021 | 56.80 |
| 8 | >2017 | 56.61 |
| 9 | >2025 | 56.55 |
| 10 | >1963 | 56.46 |
|
| Top 10 years with the warmest annual mean daily high temperature |
|---|
|
| Ranking | >Year | High Temperature (F) |
|---|
| 1 | >2012 | 70.5 |
| 2 | >2024 | 69.9 |
| 3 | >2023 | 68.9 |
| 4 | >2006 | 68.3 |
| 4 | >1954 | 68.3 |
| 6 | >2016 | 68.2 |
| 7 | >2002 | 67.6 |
| 8 | >1963 | 67.4 |
| 9 | >2021 | 67.2 |
| 10 | >2025 | 67.1 |
|
| Top 10 years with the warmest annual mean daily low temperature |
|---|
|
| Ranking | >Year | Low Temperature (F) |
|---|
| 1 | >2024 | 47.5 |
| 2 | >1954 | 47.4 |
| 3 | >2012 | 47.2 |
| 4 | >2016 | 46.9 |
| 5 | >1998 | 46.5 |
| 6 | >2023 | 46.4 |
| 6 | >2021 | 46.4 |
| 8 | >2017 | 46.1 |
| 8 | >2006 | 46.1 |
| 10 | >2025 | 46.0 |
|
| Top 10 years with the coldest annual mean daily temperature |
|---|
|
| Ranking | >Year | Mean Temperature (F) |
|---|
| 1 | >1951 | 52.70 |
| 2 | >2014 | 52.93 |
| 3 | >1950 | 53.12 |
| 4 | >2008 | 53.13 |
| 5 | >2013 | 53.43 |
| 6 | >1960 | 53.60 |
| 7 | >1961 | 53.61 |
| 8 | >1958 | 53.64 |
| 9 | >1968 | 53.83 |
| 10 | >2009 | 53.88 |
|
| Top 10 years with the coldest annual mean daily high temperature |
|---|
|
| Ranking | >Year | High Temperature (F) |
|---|
| 1 | >1951 | 61.9 |
| 2 | >1958 | 62.9 |
| 3 | >1961 | 63.1 |
| 4 | >1960 | 63.3 |
| 5 | >2008 | 63.5 |
| 5 | >1950 | 63.5 |
| 7 | >2014 | 63.7 |
| 8 | >2013 | 63.8 |
| 9 | >2019 | 64.0 |
| 9 | >2009 | 64.0 |
|
| Top 10 years with the coldest annual mean daily low temperature |
|---|
|
| Ranking | >Year | Low Temperature (F) |
|---|
| 1 | >2014 | 42.1 |
| 2 | >1950 | 42.6 |
| 3 | >2008 | 42.7 |
| 4 | >2013 | 42.9 |
| 5 | >1951 | 43.5 |
| 6 | >1968 | 43.7 |
| 7 | >2009 | 43.8 |
| 8 | >2022 | 43.9 |
| 8 | >1960 | 43.9 |
| 10 | >2000 | 44.0 |
|
| Top 10 years with the most annual precipitation |
|---|
|
| Ranking | >Year | Precipitation (in.) |
|---|
| 1 | >1951 | 58.13 |
| 2 | >1961 | 55.97 |
| 3 | >1958 | 50.78 |
| 4 | >1967 | 50.05 |
| 5 | >2019 | 48.34 |
| 6 | >2015 | 47.59 |
| 7 | >1965 | 46.27 |
| 8 | >2017 | 45.20 |
| 9 | >2007 | 44.48 |
| 10 | >2008 | 43.70 |
|
| Top 10 years with the least annual precipitation |
|---|
|
| Ranking | >Year | Precipitation (in.) |
|---|
| 1 | >1963 | 23.02 |
| 2 | >1966 | 24.23 |
| 3 | >2012 | 26.09 |
| 4 | >2011 | 27.27 |
| 5 | >1962 | 27.82 |
| 6 | >2000 | 28.79 |
| 7 | >2002 | 28.88 |
| 8 | >2025 | 30.15 |
| 9 | >2003 | 30.96 |
| 10 | >2018 | 32.95 |
|
| Top 10 years with the warmest annual mean daily temperature |
|---|
|
| Ranking | >Year | Mean Temperature (F) |
|---|
| 1 | >1931 | 57.50 |
| 2 | >1938 | 57.32 |
| 3 | >1934 | 57.27 |
| 4 | >1921 | 57.23 |
| 5 | >2024 | 57.18 |
| 6 | >1939 | 57.11 |
| 7 | >1946 | 56.92 |
| 8 | >2012 | 56.88 |
| 9 | >1933 | 56.59 |
| 10 | >1954 | 56.28 |
|
| Top 10 years with the warmest annual mean daily high temperature |
|---|
|
| Ranking | >Year | High Temperature (F) |
|---|
| 1 | >2012 | 69.8 |
| 2 | >2024 | 69.2 |
| 3 | >1934 | 68.2 |
| 4 | >2023 | 67.9 |
| 4 | >2006 | 67.9 |
| 6 | >1938 | 67.8 |
| 7 | >1970 | 67.7 |
| 7 | >1966 | 67.7 |
| 9 | >1939 | 67.6 |
| 10 | >2016 | 67.5 |
|
| Top 10 years with the warmest annual mean daily low temperature |
|---|
|
| Ranking | >Year | Low Temperature (F) |
|---|
| 1 | >1931 | 47.9 |
| 2 | >1921 | 47.4 |
| 3 | >1946 | 47.0 |
| 3 | >1941 | 47.0 |
| 5 | >1938 | 46.8 |
| 6 | >1939 | 46.6 |
| 7 | >1934 | 46.4 |
| 8 | >1998 | 46.1 |
| 8 | >1933 | 46.1 |
| 10 | >1954 | 45.4 |
|
| Top 10 years with the coldest annual mean daily temperature |
|---|
|
| Ranking | >Year | Mean Temperature (F) |
|---|
| 1 | >1982 | 50.14 |
| 2 | >1979 | 50.31 |
| 3 | >2008 | 51.05 |
| 4 | >1951 | 51.34 |
| 5 | >2014 | 51.41 |
| 6 | >1917 | 51.44 |
| 7 | >2022 | 51.64 |
| 8 | >1924 | 51.81 |
| 9 | >1978 | 51.83 |
| 10 | >1961 | 51.87 |
|
| Top 10 years with the coldest annual mean daily high temperature |
|---|
|
| Ranking | >Year | High Temperature (F) |
|---|
| 1 | >1982 | 59.7 |
| 2 | >1979 | 60.9 |
| 3 | >1951 | 61.3 |
| 4 | >1929 | 61.4 |
| 5 | >1978 | 61.8 |
| 5 | >1924 | 61.8 |
| 5 | >1917 | 61.8 |
| 8 | >1983 | 62.0 |
| 9 | >2008 | 62.1 |
| 9 | >1915 | 62.1 |
|
| Top 10 years with the coldest annual mean daily low temperature |
|---|
|
| Ranking | >Year | Low Temperature (F) |
|---|
| 1 | >2022 | 39.3 |
| 2 | >1979 | 39.6 |
| 3 | >2008 | 39.9 |
| 4 | >2014 | 40.1 |
| 5 | >2013 | 40.5 |
| 5 | >1982 | 40.5 |
| 7 | >1950 | 40.7 |
| 8 | >1976 | 40.9 |
| 9 | >2009 | 41.1 |
| 9 | >1917 | 41.1 |
|
| Top 10 years with the most annual precipitation |
|---|
|
| Ranking | >Year | Precipitation (in.) |
|---|
| 1 | >1973 | 55.60 |
| 2 | >1951 | 53.59 |
| 3 | >1961 | 53.39 |
| 4 | >1986 | 49.34 |
| 5 | >1944 | 48.94 |
| 6 | >1965 | 47.38 |
| 7 | >1998 | 46.14 |
| 8 | >2001 | 45.57 |
| 9 | >1928 | 45.13 |
| 10 | >1959 | 44.99 |
|
| Top 10 years with the least annual precipitation |
|---|
|
| Ranking | >Year | Precipitation (in.) |
|---|
| 1 | >1901 | 20.53 |
| 2 | >1966 | 20.74 |
| 3 | >2002 | 21.74 |
| 4 | >1953 | 21.81 |
| 5 | >1906 | 21.87 |
| 6 | >1956 | 21.99 |
| 7 | >1976 | 22.13 |
| 8 | >2018 | 22.68 |
| 9 | >2012 | 23.27 |
| 10 | >1963 | 23.48 |
|
| Top 10 years with the warmest annual mean daily temperature |
|---|
|
| Ranking | >Year | Mean Temperature (F) |
|---|
| 1 | >2012 | 59.19 |
| 2 | >2023 | 58.20 |
| 3 | >2024 | 58.10 |
| 4 | >2006 | 57.67 |
| 5 | >2016 | 57.26 |
| 6 | >2021 | 57.04 |
| 7 | >1999 | 56.90 |
| 8 | >2025 | 56.83 |
| 9 | >2001 | 56.33 |
| 10 | >2017 | 56.32 |
|
| Top 10 years with the warmest annual mean daily high temperature |
|---|
|
| Ranking | >Year | High Temperature (F) |
|---|
| 1 | >2012 | 69.9 |
| 2 | >2023 | 68.6 |
| 3 | >2024 | 68.3 |
| 4 | >2006 | 67.8 |
| 5 | >2016 | 67.0 |
| 6 | >2025 | 66.6 |
| 6 | >2022 | 66.6 |
| 6 | >1999 | 66.6 |
| 9 | >2021 | 66.5 |
| 10 | >2002 | 66.1 |
|
| Top 10 years with the warmest annual mean daily low temperature |
|---|
|
| Ranking | >Year | Low Temperature (F) |
|---|
| 1 | >2012 | 48.5 |
| 2 | >2024 | 47.9 |
| 3 | >2023 | 47.8 |
| 4 | >2021 | 47.6 |
| 5 | >2006 | 47.5 |
| 6 | >2016 | 47.4 |
| 7 | >1999 | 47.2 |
| 8 | >2025 | 47.0 |
| 9 | >2007 | 46.9 |
| 10 | >2001 | 46.8 |
|
| Top 10 years with the coldest annual mean daily temperature |
|---|
|
| Ranking | >Year | Mean Temperature (F) |
|---|
| 1 | >2014 | 53.04 |
| 2 | >2008 | 53.44 |
| 3 | >2013 | 53.49 |
| 4 | >2019 | 54.01 |
| 4 | >2009 | 54.01 |
| 6 | >1997 | 54.02 |
| 7 | >2018 | 54.76 |
| 8 | >2004 | 55.18 |
| 9 | >2010 | 55.32 |
| 10 | >2011 | 55.53 |
|
| Top 10 years with the coldest annual mean daily high temperature |
|---|
|
| Ranking | >Year | High Temperature (F) |
|---|
| 1 | >2014 | 62.9 |
| 2 | >2013 | 63.1 |
| 2 | >2008 | 63.1 |
| 2 | >1997 | 63.1 |
| 5 | >2019 | 63.2 |
| 6 | >2009 | 63.4 |
| 7 | >2004 | 64.2 |
| 8 | >2018 | 64.5 |
| 9 | >2010 | 64.6 |
| 10 | >2020 | 65.3 |
|
| Top 10 years with the coldest annual mean daily low temperature |
|---|
|
| Ranking | >Year | Low Temperature (F) |
|---|
| 1 | >2014 | 43.2 |
| 2 | >2013 | 43.8 |
| 2 | >2008 | 43.8 |
| 4 | >2009 | 44.6 |
| 5 | >2019 | 44.9 |
| 5 | >1997 | 44.9 |
| 7 | >2018 | 45.0 |
| 8 | >2022 | 45.4 |
| 9 | >2003 | 45.5 |
| 10 | >2011 | 45.7 |
|
| Top 10 years with the most annual precipitation |
|---|
|
| Ranking | >Year | Precipitation (in.) |
|---|
| 1 | >2019 | 49.76 |
| 2 | >2008 | 47.68 |
| 3 | >2015 | 47.15 |
| 4 | >2017 | 45.08 |
| 5 | >2010 | 42.28 |
| 6 | >2009 | 42.02 |
| 7 | >2004 | 41.51 |
| 8 | >2007 | 41.07 |
| 9 | >2021 | 39.70 |
| 10 | >2005 | 39.14 |
|
| Top 10 years with the least annual precipitation |
|---|
|
| Ranking | >Year | Precipitation (in.) |
|---|
| 1 | >2012 | 25.47 |
| 2 | >2002 | 27.66 |
| 3 | >2000 | 27.96 |
| 4 | >2025 | 31.27 |
| 5 | >2003 | 31.76 |
| 6 | >2020 | 31.96 |
| 7 | >2023 | 32.57 |
| 8 | >2014 | 32.66 |
| 9 | >2011 | 32.67 |
| 10 | >2024 | 33.27 |
|
| Top 10 years with the warmest annual mean daily temperature |
|---|
|
| Ranking | >Year | Mean Temperature (F) |
|---|
| 1 | >2012 | 59.72 |
| 2 | >2016 | 59.34 |
| 3 | >2024 | 59.02 |
| 4 | >2023 | 57.90 |
| 5 | >2017 | 57.66 |
| 6 | >2006 | 57.64 |
| 7 | >2025 | 57.04 |
| 8 | >2020 | 57.03 |
| 9 | >2015 | 56.94 |
| 10 | >2021 | 56.91 |
|
| Top 10 years with the warmest annual mean daily high temperature |
|---|
|
| Ranking | >Year | High Temperature (F) |
|---|
| 1 | >2012 | 70.1 |
| 2 | >2024 | 69.3 |
| 3 | >2016 | 68.8 |
| 4 | >2023 | 68.3 |
| 5 | >2006 | 67.6 |
| 6 | >2017 | 67.2 |
| 7 | >2025 | 67.0 |
| 8 | >2020 | 66.4 |
| 8 | >2015 | 66.4 |
| 10 | >2021 | 66.1 |
|
| Top 10 years with the warmest annual mean daily low temperature |
|---|
|
| Ranking | >Year | Low Temperature (F) |
|---|
| 1 | >2016 | 49.8 |
| 2 | >2012 | 49.3 |
| 3 | >2024 | 49.0 |
| 4 | >2017 | 48.2 |
| 5 | >2023 | 47.7 |
| 5 | >2021 | 47.7 |
| 5 | >2006 | 47.7 |
| 8 | >2020 | 47.6 |
| 9 | >2015 | 47.5 |
| 10 | >2025 | 47.3 |
|
| Top 10 years with the coldest annual mean daily temperature |
|---|
|
| Ranking | >Year | Mean Temperature (F) |
|---|
| 1 | >2008 | 53.46 |
| 2 | >2014 | 53.49 |
| 3 | >2009 | 54.09 |
| 4 | >2013 | 54.22 |
| 5 | >2022 | 54.83 |
| 6 | >2004 | 54.85 |
| 7 | >2003 | 55.15 |
| 8 | >2018 | 55.35 |
| 9 | >2010 | 55.70 |
| 10 | >2011 | 55.95 |
|
| Top 10 years with the coldest annual mean daily high temperature |
|---|
|
| Ranking | >Year | High Temperature (F) |
|---|
| 1 | >2008 | 62.9 |
| 2 | >2014 | 63.1 |
| 3 | >2009 | 63.3 |
| 4 | >2013 | 63.7 |
| 4 | >2004 | 63.7 |
| 6 | >2019 | 64.4 |
| 7 | >2010 | 64.7 |
| 8 | >2003 | 64.9 |
| 9 | >2018 | 65.3 |
| 10 | >2022 | 65.6 |
|
| Top 10 years with the coldest annual mean daily low temperature |
|---|
|
| Ranking | >Year | Low Temperature (F) |
|---|
| 1 | >2014 | 43.9 |
| 2 | >2008 | 44.0 |
| 3 | >2022 | 44.6 |
| 4 | >2013 | 44.8 |
| 5 | >2009 | 44.9 |
| 6 | >2003 | 45.4 |
| 7 | >2018 | 45.9 |
| 8 | >2004 | 46.0 |
| 9 | >2011 | 46.2 |
| 10 | >2010 | 46.6 |
|
| Top 10 years with the most annual precipitation |
|---|
|
| Ranking | >Year | Precipitation (in.) |
|---|
| 1 | >2019 | 53.54 |
| 2 | >2004 | 49.15 |
| 3 | >2008 | 48.68 |
| 4 | >2017 | 44.83 |
| 5 | >2009 | 42.59 |
| 6 | >2015 | 42.31 |
| 7 | >2003 | 41.40 |
| 8 | >2010 | 38.89 |
| 9 | >2005 | 38.18 |
| 10 | >2007 | 37.16 |
|
| Top 10 years with the least annual precipitation |
|---|
|
| Ranking | >Year | Precipitation (in.) |
|---|
| 1 | >2012 | 26.90 |
| 2 | >2025 | 27.07 |
| 3 | >2002 | 27.99 |
| 4 | >2006 | 28.76 |
| 5 | >2011 | 30.21 |
| 6 | >2024 | 30.41 |
| 7 | >2022 | 31.18 |
| 8 | >2023 | 31.31 |
| 9 | >2014 | 31.44 |
| 10 | >2021 | 33.46 |
|
| Top 10 years with the warmest annual mean daily temperature |
|---|
|
| Ranking | >Year | Mean Temperature (F) |
|---|
| 1 | >2012 | 60.85 |
| 2 | >2016 | 59.01 |
| 3 | >2024 | 58.95 |
| 4 | >2023 | 58.71 |
| 5 | >2017 | 58.44 |
| 6 | >2006 | 58.25 |
| 7 | >2015 | 57.68 |
| 8 | >2021 | 57.67 |
| 9 | >2011 | 57.44 |
| 10 | >1998 | 57.03 |
|
| Top 10 years with the warmest annual mean daily high temperature |
|---|
|
| Ranking | >Year | High Temperature (F) |
|---|
| 1 | >2012 | 71.8 |
| 2 | >2023 | 69.5 |
| 3 | >2024 | 69.3 |
| 4 | >2016 | 69.1 |
| 5 | >2017 | 68.8 |
| 6 | >2006 | 68.7 |
| 7 | >2015 | 67.6 |
| 8 | >2011 | 67.1 |
| 8 | >1999 | 67.1 |
| 10 | >2021 | 67.0 |
|
| Top 10 years with the warmest annual mean daily low temperature |
|---|
|
| Ranking | >Year | Low Temperature (F) |
|---|
| 1 | >2012 | 49.9 |
| 2 | >2016 | 48.9 |
| 3 | >2024 | 48.7 |
| 4 | >2021 | 48.3 |
| 5 | >2017 | 48.2 |
| 5 | >1998 | 48.2 |
| 7 | >2023 | 48.0 |
| 8 | >2015 | 47.8 |
| 8 | >2006 | 47.8 |
| 10 | >2011 | 47.7 |
|
| Top 10 years with the coldest annual mean daily temperature |
|---|
|
| Ranking | >Year | Mean Temperature (F) |
|---|
| 1 | >2008 | 53.79 |
| 2 | >1997 | 53.82 |
| 3 | >2019 | 54.03 |
| 4 | >2014 | 54.44 |
| 5 | >2013 | 54.98 |
| 6 | >2003 | 55.15 |
| 7 | >2009 | 55.25 |
| 8 | >2004 | 55.31 |
| 9 | >2000 | 55.39 |
| 10 | >2002 | 55.84 |
|
| Top 10 years with the coldest annual mean daily high temperature |
|---|
|
| Ranking | >Year | High Temperature (F) |
|---|
| 1 | >1997 | 63.0 |
| 2 | >2019 | 63.2 |
| 3 | >2008 | 63.5 |
| 4 | >2014 | 64.5 |
| 4 | >2004 | 64.5 |
| 6 | >2009 | 64.7 |
| 7 | >2013 | 64.8 |
| 8 | >2003 | 65.3 |
| 9 | >2000 | 65.4 |
| 10 | >2018 | 65.8 |
|
| Top 10 years with the coldest annual mean daily low temperature |
|---|
|
| Ranking | >Year | Low Temperature (F) |
|---|
| 1 | >2008 | 44.1 |
| 2 | >2014 | 44.4 |
| 3 | >1997 | 44.6 |
| 4 | >2019 | 44.8 |
| 5 | >2003 | 45.0 |
| 6 | >2013 | 45.1 |
| 7 | >2000 | 45.4 |
| 8 | >2022 | 45.6 |
| 8 | >2002 | 45.6 |
| 10 | >2009 | 45.7 |
|
| Top 10 years with the most annual precipitation |
|---|
|
| Ranking | >Year | Precipitation (in.) |
|---|
| 1 | >2019 | 46.14 |
| 2 | >2015 | 43.72 |
| 3 | >2009 | 43.70 |
| 4 | >2024 | 43.57 |
| 5 | >2025 | 41.91 |
| 6 | >2001 | 41.25 |
| 7 | >2013 | 40.69 |
| 8 | >2008 | 39.61 |
| 9 | >2021 | 39.58 |
| 10 | >2022 | 39.06 |
|
| Top 10 years with the least annual precipitation |
|---|
|
| Ranking | >Year | Precipitation (in.) |
|---|
| 1 | >2006 | 21.26 |
| 2 | >1999 | 24.15 |
| 3 | >2007 | 27.56 |
| 4 | >2010 | 28.38 |
| 5 | >2002 | 30.00 |
| 6 | >2012 | 30.02 |
| 7 | >2011 | 30.52 |
| 8 | >2016 | 31.98 |
| 9 | >2018 | 34.00 |
| 10 | >2020 | 34.28 |
|
| Top 10 years with the warmest annual mean daily temperature |
|---|
|
| Ranking | >Year | Mean Temperature (F) |
|---|
| 1 | >2012 | 55.01 |
| 2 | >2024 | 54.89 |
| 3 | >2016 | 54.87 |
| 4 | >2017 | 54.25 |
| 5 | >2023 | 53.90 |
| 6 | >2015 | 53.63 |
| 7 | >2021 | 53.59 |
| 8 | >2006 | 53.40 |
| 9 | >1954 | 53.19 |
| 10 | >1953 | 53.14 |
|
| Top 10 years with the warmest annual mean daily high temperature |
|---|
|
| Ranking | >Year | High Temperature (F) |
|---|
| 1 | >2012 | 67.2 |
| 2 | >2024 | 65.9 |
| 3 | >2023 | 65.3 |
| 3 | >2017 | 65.3 |
| 5 | >2016 | 65.2 |
| 6 | >1953 | 65.1 |
| 7 | >1954 | 64.2 |
| 8 | >2015 | 64.1 |
| 9 | >2025 | 64.0 |
| 9 | >1956 | 64.0 |
|
| Top 10 years with the warmest annual mean daily low temperature |
|---|
|
| Ranking | >Year | Low Temperature (F) |
|---|
| 1 | >2016 | 44.4 |
| 2 | >2024 | 43.9 |
| 3 | >2021 | 43.4 |
| 4 | >2017 | 43.2 |
| 4 | >2015 | 43.2 |
| 6 | >2006 | 43.0 |
| 7 | >2012 | 42.8 |
| 8 | >2001 | 42.6 |
| 8 | >1999 | 42.6 |
| 10 | >2023 | 42.5 |
|
| Top 10 years with the coldest annual mean daily temperature |
|---|
|
| Ranking | >Year | Mean Temperature (F) |
|---|
| 1 | >1951 | 48.71 |
| 2 | >1950 | 49.11 |
| 3 | >2008 | 49.36 |
| 4 | >1972 | 50.00 |
| 5 | >1967 | 50.08 |
| 6 | >2013 | 50.17 |
| 7 | >1958 | 50.18 |
| 8 | >2014 | 50.19 |
| 8 | >1960 | 50.19 |
| 10 | >2009 | 50.23 |
|
| Top 10 years with the coldest annual mean daily high temperature |
|---|
|
| Ranking | >Year | High Temperature (F) |
|---|
| 1 | >1951 | 59.1 |
| 2 | >2008 | 59.7 |
| 3 | >1967 | 60.3 |
| 4 | >1972 | 60.4 |
| 5 | >2009 | 60.5 |
| 5 | >1969 | 60.5 |
| 5 | >1958 | 60.5 |
| 5 | >1950 | 60.5 |
| 9 | >1960 | 60.6 |
| 10 | >2014 | 60.8 |
|
| Top 10 years with the coldest annual mean daily low temperature |
|---|
|
| Ranking | >Year | Low Temperature (F) |
|---|
| 1 | >1950 | 37.7 |
| 2 | >1951 | 38.3 |
| 3 | >2013 | 39.0 |
| 3 | >2008 | 39.0 |
| 5 | >2014 | 39.4 |
| 5 | >1966 | 39.4 |
| 7 | >1972 | 39.6 |
| 8 | >1967 | 39.8 |
| 8 | >1960 | 39.8 |
| 8 | >1956 | 39.8 |
|
| Top 10 years with the most annual precipitation |
|---|
|
| Ranking | >Year | Precipitation (in.) |
|---|
| 1 | >2019 | 64.54 |
| 2 | >2008 | 63.12 |
| 3 | >2010 | 53.08 |
| 4 | >2009 | 49.98 |
| 5 | >1969 | 47.51 |
| 6 | >1967 | 46.82 |
| 7 | >1970 | 46.18 |
| 8 | >2014 | 44.53 |
| 9 | >2011 | 44.14 |
| 10 | >2015 | 44.12 |
|
| Top 10 years with the least annual precipitation |
|---|
|
| Ranking | >Year | Precipitation (in.) |
|---|
| 1 | >1953 | 24.66 |
| 2 | >2000 | 25.02 |
| 3 | >1950 | 25.13 |
| 4 | >1956 | 26.51 |
| 5 | >1963 | 26.62 |
| 6 | >1999 | 27.07 |
| 7 | >2012 | 28.24 |
| 8 | >1955 | 29.45 |
| 9 | >1966 | 29.72 |
| 10 | >1968 | 30.08 |
|


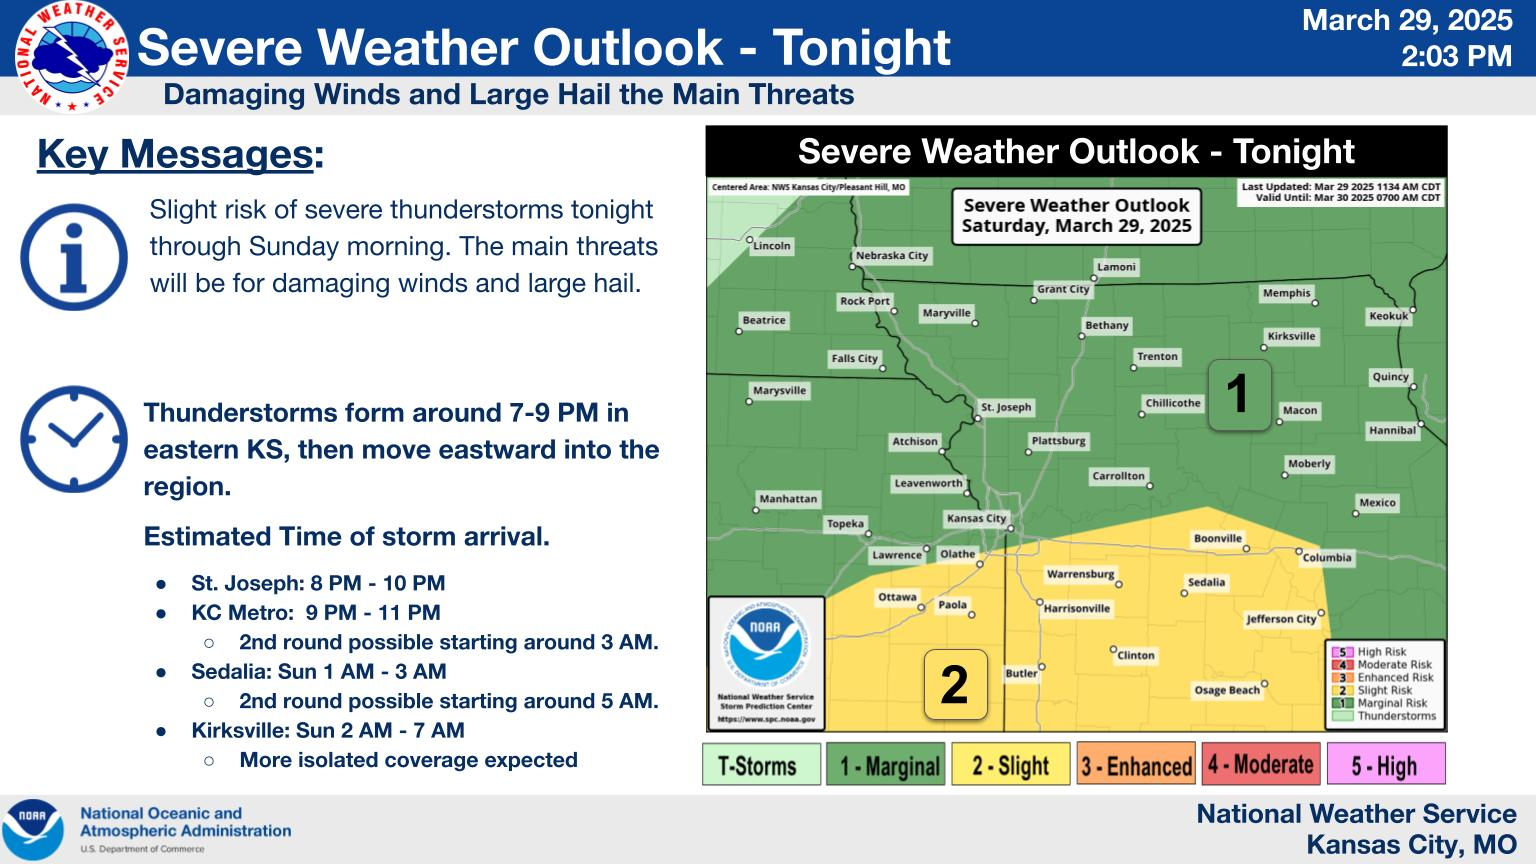 Weather Story
 Weather Map
 Local Radar