
Flash flooding threatens areas from the Tennessee Valley to the Carolinas as storms repeat along a stalled front. Monsoonal storms may trigger flooding in the Southwest. Dangerous heat expands across the Desert Southwest, Plains, mid-Mississippi Valley and Southern Tier. Critical fire weather for interior Pacific Northwest. Cooler, drier air brings brief relief to the Great Lakes and Northeast. Read More >
Kansas City Daily Climate Extremes and Normals*
June 1889-Present*
* Normals are computed from 1991-2020 time frame.
* Last updated 5/13/2022
| Date | Max Temp | Year | Normal Max | Min Temp | Year | Normal Min | Max Precip | Year | Normal Precip |
|---|---|---|---|---|---|---|---|---|---|
| 1 | 101 | 1934 | 81 | 43 | 1983 | 60 | 1.97 | 1892 | 5.25 |
| 2 | 98 | 1934 | 81 | 47 | 2012 | 60 | 1.46 | 1939 | |
| 3 | 97 | 1972 | 81 | 46 | 2013 | 61 | 2.25 | 2015 | |
| 4 | 97 | 1960 | 82 | 42 | 1990 | 61 | 2.17 | 2005 | |
| 5 | 99 | 1934 | 82 | 44 | 1993 | 61 | 2.04 | 1916 | |
| 6 | 99 | 1934 | 82 | 44 | 1998 | 62 | 1.59 | 2003 | |
| 7 | 99 | 1934 | 82 | 46 | 1935 | 62 | 3.09 | 1921 | |
| 8 | 100 | 1911 | 83 | 48 | 2003 | 62 | 3.26 | 1910 | |
| 9 | 98 | 1953 | 83 | 49 | 1913 | 63 | 2.51 | 1941 | |
| 10 | 99 | 1953 | 83 | 47 | 1988 | 63 | 2.85 | 1939 | |
| 11 | 104 | 1953 | 83 | 51 | 2019 | 63 | 1.80 | 1970 | |
| 12 | 100 | 1953 | 84 | 50 | 1985 | 63 | 3.06 | 1966 | |
| 13 | 103 | 1953 | 84 | 47 | 1985 | 64 | 2.99 | 1961 | |
| 14 | 99 | 1936 | 84 | 48 | 1942 | 64 | 2.52 | 1958 | |
| 15 | 102 | 1953 | 84 | 52 | 1917 | 64 | 2.16 | 2009 | |
| 16 | 102 | 1946 | 85 | 51 | 1989 | 64 | 2.18 | 1996 | |
| 17 | 100 | 1918 | 85 | 48 | 1999 | 65 | 2.49 | 1895 | |
| 18 | 104 | 1953 | 85 | 52 | 2000 | 65 | 2.35 | 1983 | |
| 19 | 107 | 1936 | 85 | 49 | 1976 | 65 | 3.97 | 2001 | |
| 20 | 103 | 1934 | 85 | 53 | 1976 | 65 | 2.30 | 2000 | |
| 21 | 101 | 1988 | 86 | 50 | 1992 | 66 | 3.39 | 1952 | |
| 22 | 102 | 1988 | 85 | 50 | 1902 | 66 | 3.92 | 1929 | |
| 23 | 108 | 1934 | 86 | 55 | 2004 | 66 | 2.42 | 1976 | |
| 24 | 103 | 1988 | 86 | 51 | 1961 | 66 | 2.05 | 1921 | |
| 25 | 102 | 1988 | 86 | 53 | 2017 | 66 | 2.54 | 1894 | |
| 26 | 103 | 1936 | 86 | 52 | 2004 | 66 | 2.58 | 1921 | |
| 27 | 105 | 1980 | 87 | 52 | 1968 | 67 | 2.60 | 1941 | |
| 28 | 107 | 1936 | 87 | 52 | 1985 | 67 | 1.27 | 1908 | |
| 29 | 105 | 1934 | 87 | 54 | 1985 | 67 | 2.48 | 1981 | |
| 30 | 102 | 1933 | 87 | 55 | 1943 | 67 | 3.26 | 2005 |


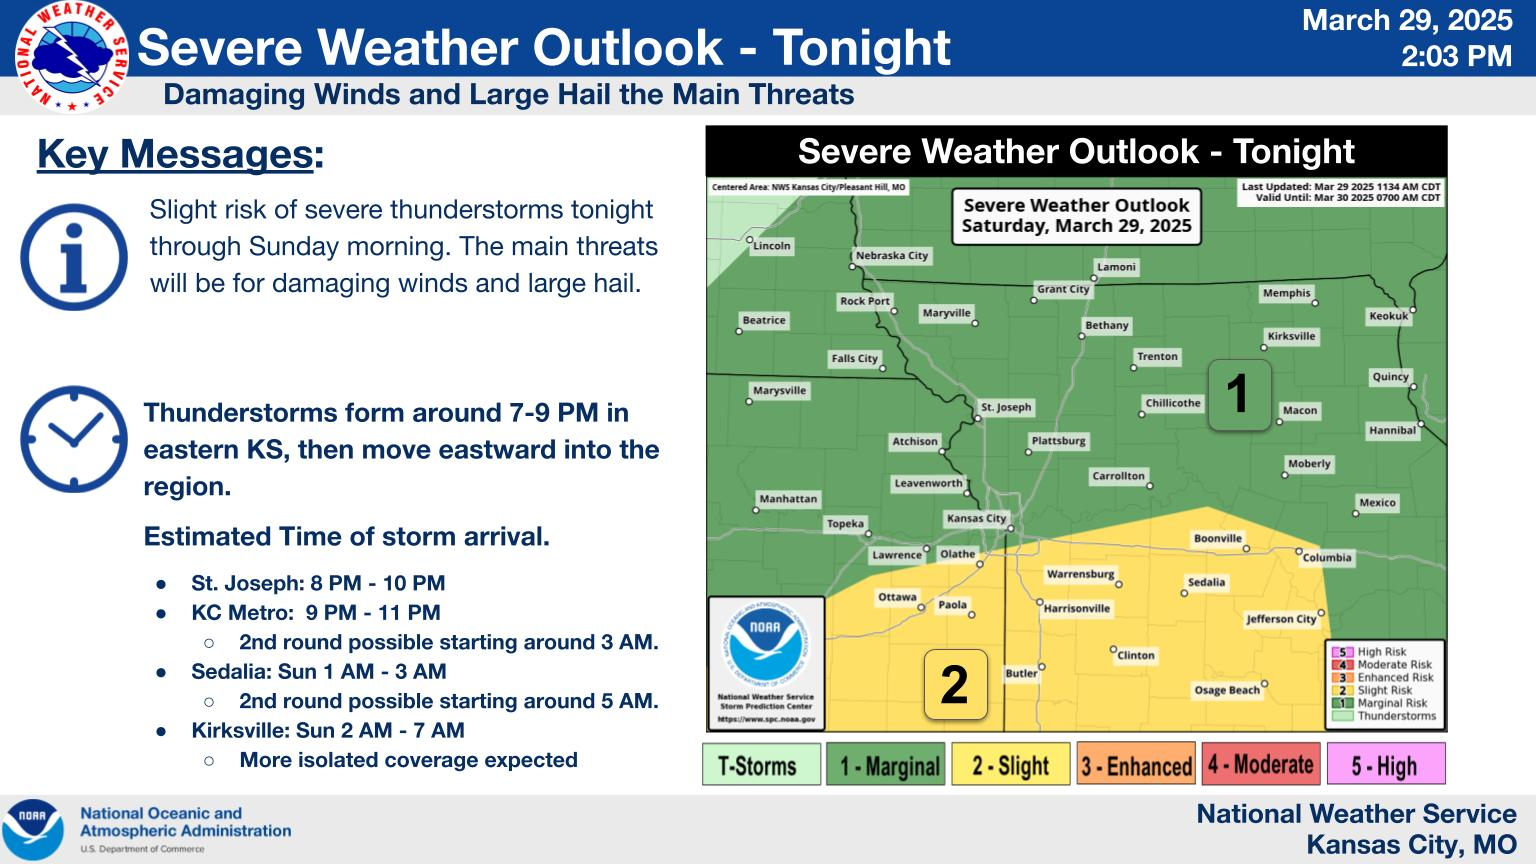 Weather Story
 Weather Map
 Local Radar