Kansas City Daily Climate Extremes and Normals*
November 1888-Present
* Normals are computed from 1991-2020 time frame.
* Last updated 5/13/2022
| Date | Max Temp | Year | Normal Max | Min Temp | Year | Normal Min | Max Precip | Year | Max Snow | Year | Normal Precip |
|---|---|---|---|---|---|---|---|---|---|---|---|
| 1 | 83 | 1937 | 60 | 20 | 1991 | 39 | 1.98 | 1998 | 0.4 | 1991 | 2.00 |
| 2 | 81 | 1964 | 60 | 12 | 1991 | 39 | 1.32 | 1961 | 0.4 | 1995 | Avg Snowfall |
| 3 | 82 | 1978 | 59 | 10 | 1991 | 39 | 1.73 | 1938 | 0.5 | 1997 | 1.1 |
| 4 | 81 | 1978 | 59 | 7 | 1991 | 38 | 1.65 | 1956 | 0.4 | 1974 | |
| 5 | 79 | 1924 | 58 | 16 | 1982 | 38 | 1.82 | 1912 | 1.7 | 1990 | |
| 6 | 83 | 1915 | 58 | 16 | 1991 | 37 | 1.92 | 1895 | 1.5 | 1991 | |
| 7 | 78 | 1934 | 57 | 7 | 1991 | 37 | 2.74 | 1918 | 2.5 | 1925 | |
| 8 | 82 | 2005 | 57 | 1 | 1991 | 37 | 1.88 | 1916 | 2.0 | 1932 | |
| 9 | 78 | 1999 | 56 | 13 | 2018 | 36 | 0.99 | 1939 | 0.1 | 1960 | |
| 10 | 77 | 1964 | 56 | 9 | 2018 | 36 | 1.25 | 2021 | 0.5 | 1986 | |
| 11 | 81 | 1949 | 56 | 9 | 1986 | 35 | 1.16 | 2012 | 0.6 | 2019 | |
| 12 | 77 | 2005 | 55 | 6 | 1911 | 35 | 1.40 | 2010 | 2.5 | 1893 | |
| 13 | 79 | 1999 | 55 | 3 | 1986 | 35 | 0.82 | 1902 | 0.4 | 1908 | |
| 14 | 81 | 1964 | 54 | 10 | 1940 | 34 | 2.80 | 1931 | 0.6 | 1969 | |
| 15 | 79 | 1950 | 54 | 8 | 1940 | 34 | 3.69 | 1964 | 4.4 | 1932 | |
| 16 | 77 | 1952 | 53 | 9 | 1959 | 33 | 5.70 | 1928 | 1.4 | 1972 | |
| 17 | 76 | 2016 | 53 | 7 | 1959 | 33 | 1.31 | 2015 | 3.0 | 1892 | |
| 18 | 78 | 1976 | 52 | 6 | 2014 | 33 | 0.49 | 1985 | 2.2 | 1937 | |
| 19 | 77 | 1942 | 52 | 9 | 1914 | 32 | 1.63 | 1992 | 3.8 | 1906 | |
| 20 | 79 | 1897 | 51 | 8 | 1937 | 32 | 2.03 | 1973 | 0.9 | 1926 | |
| 21 | 78 | 1966 | 51 | 5 | 1937 | 31 | 1.90 | 1934 | 1.8 | 1906 | |
| 22 | 76 | 1966 | 51 | 7 | 1898 | 31 | 1.78 | 1963 | 2.5 | 1991 | |
| 23 | 75 | 1966 | 50 | 6 | 1898 | 31 | 1.47 | 1931 | 0.7 | 1983 | |
| 24 | 73 | 1990 | 50 | 9 | 1950 | 30 | 0.80 | 1966 | 5.1 | 2004 | |
| 25 | 70 | 1926 | 49 | 11 | 1977 | 30 | 1.04 | 1988 | 5.8 | 2018 | |
| 26 | 78 | 1990 | 49 | 8 | 1898 | 30 | 1.61 | 2015 | 3.9 | 1975 | |
| 27 | 71 | 1960 | 49 | 9 | 1896 | 29 | 0.84 | 2006 | 4.5 | 1958 | |
| 28 | 71 | 1998 | 48 | 1 | 1976 | 29 | 1.30 | 2006 | 3.2 | 1918 | |
| 29 | 77 | 1933 | 48 | 3 | 1976 | 29 | 1.39 | 1930 | 9.1 | 1923 | |
| 30 | 72 | 1995 | 47 | 5 | 1896 | 28 | 1.32 | 1981 | 4.8 | 1996 |


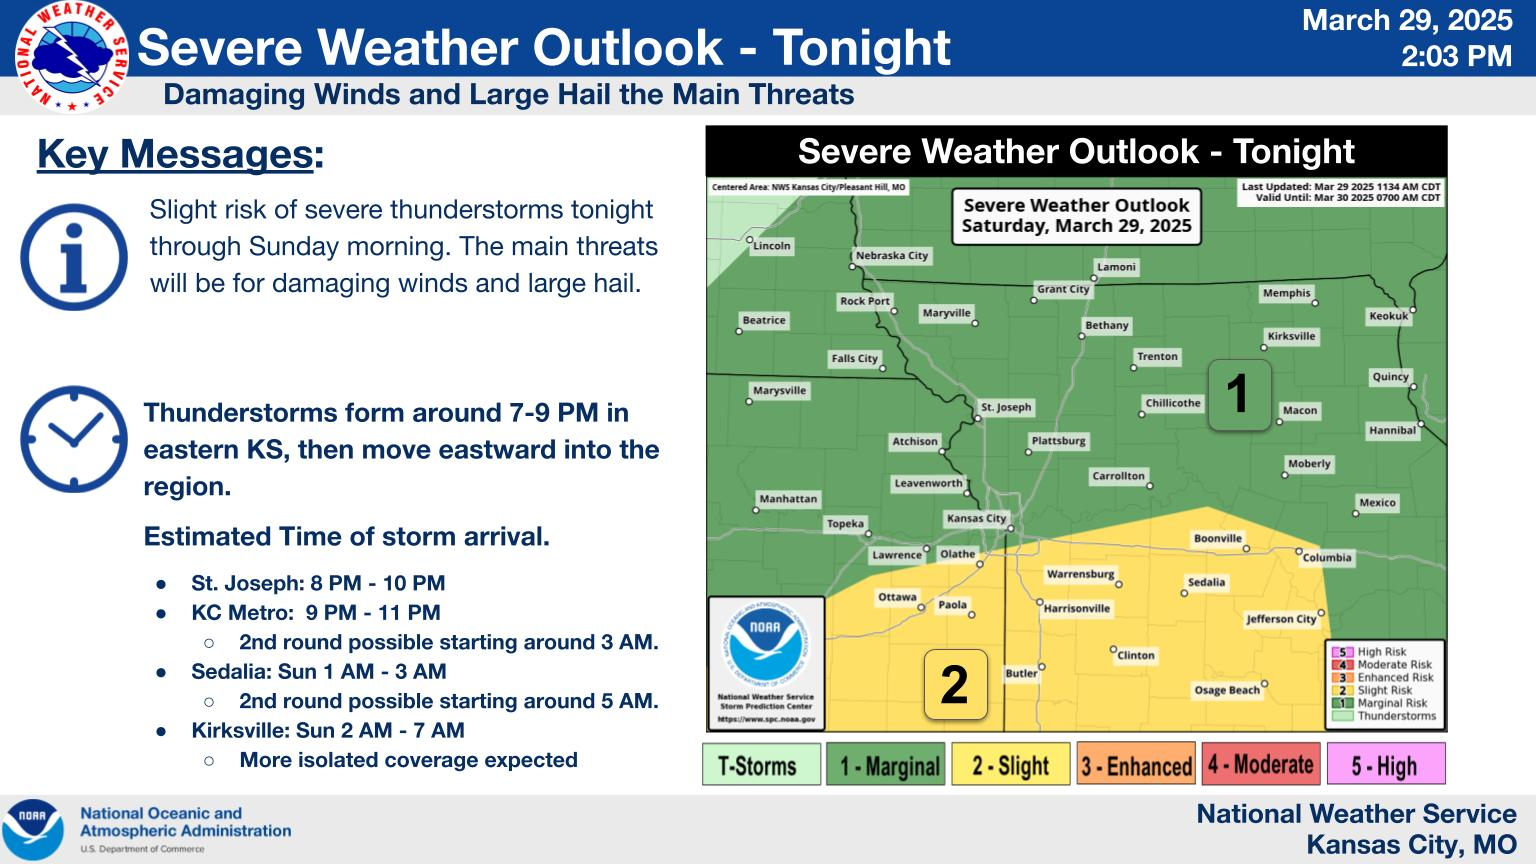 Weather Story
 Weather Map
 Local Radar