North and Central Georgia
February 2019 and Winter 2018-2019 Climate Summary
| Previous month | Next Month |
For February, the majority of locations were about 4 to 7 degrees warmer than normal and 0 to 3 inches drier than normal. Sites across portions of northern Georgia were 1 to 5 inches wetter than normal.
For the Winter 2018-2019 Season, the majority of locations were about 2 to 5 degrees warmer than normal with well above average rainfall.
|
Monthly Top 10 Rankings |
Seasonal Top 10 Rankings |
|---|---|
|
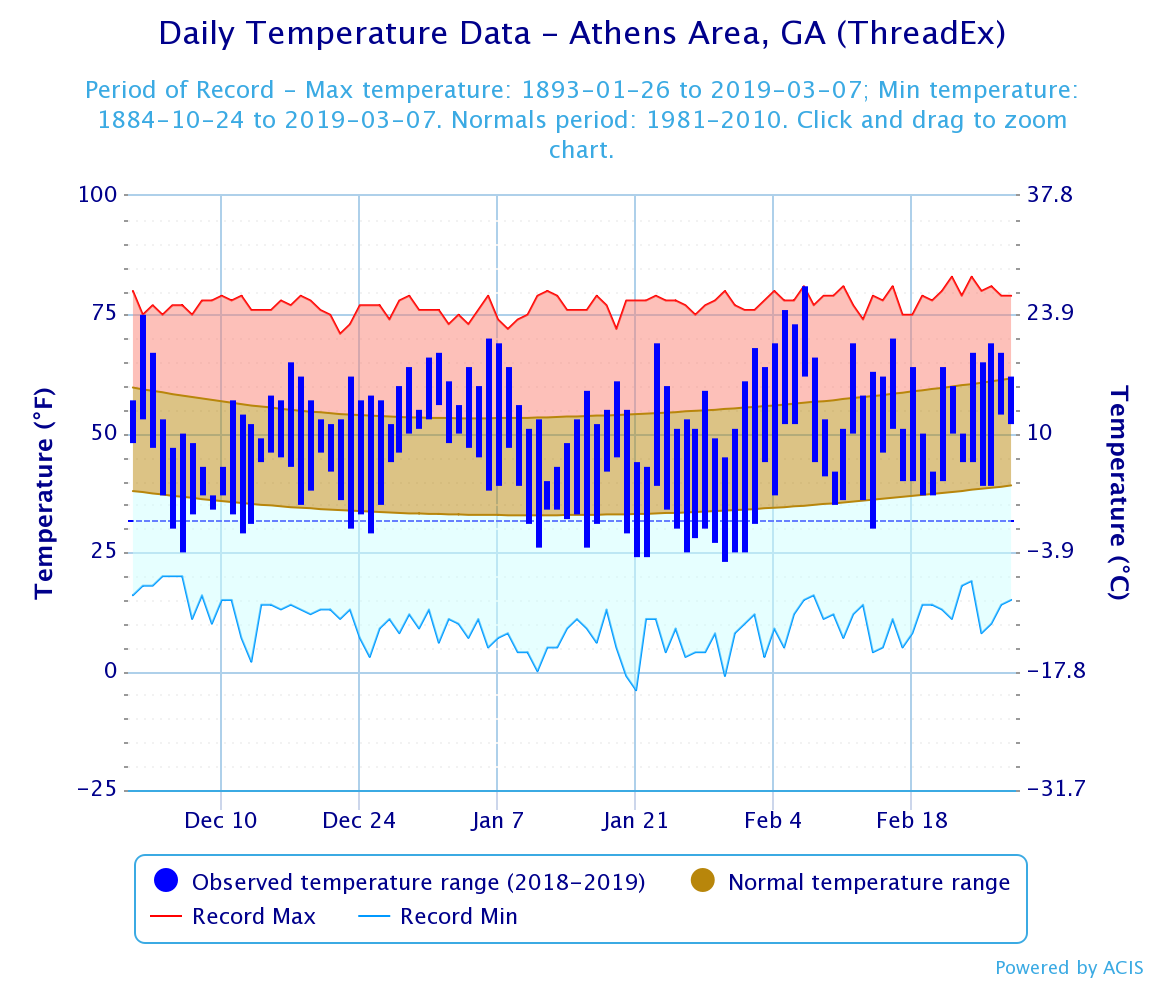
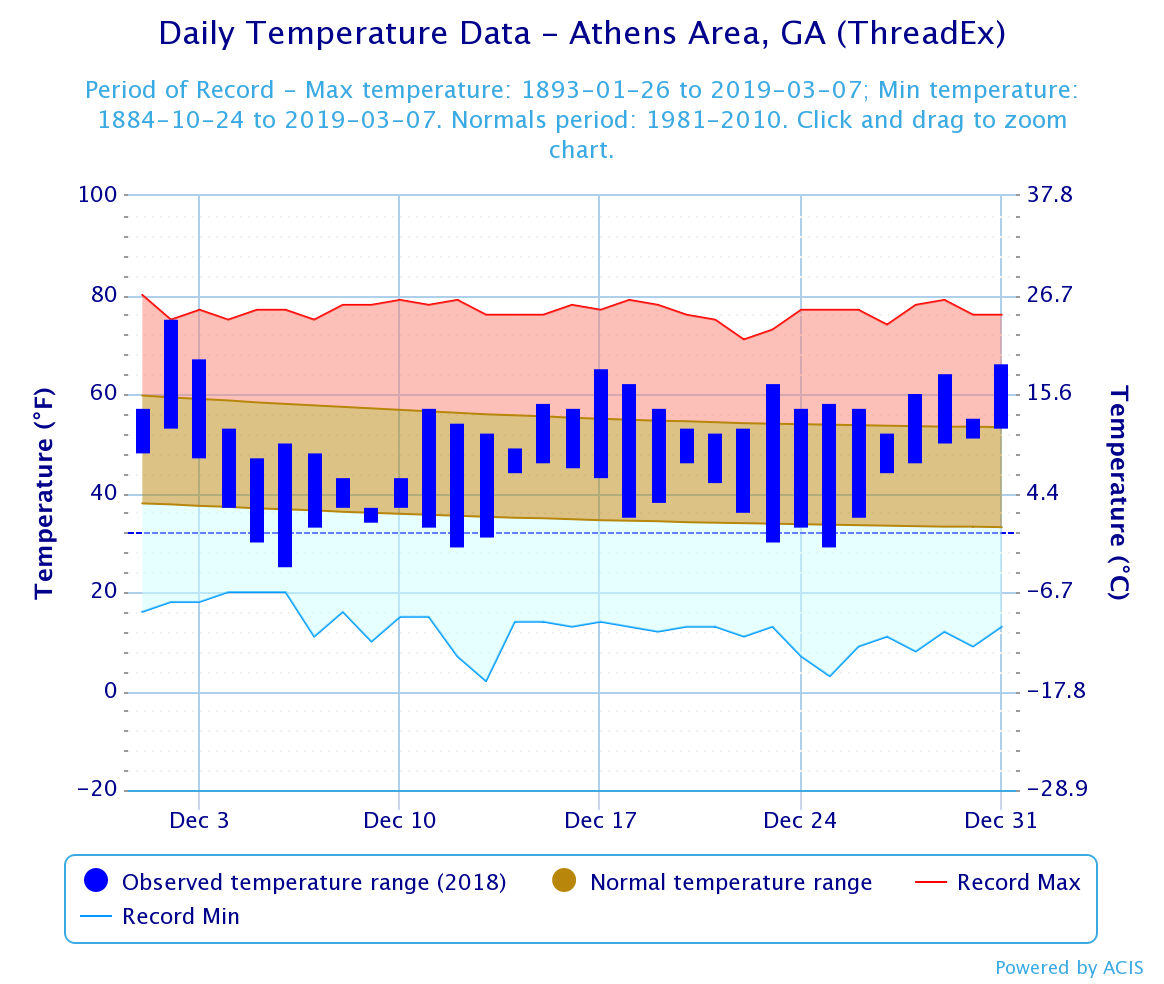
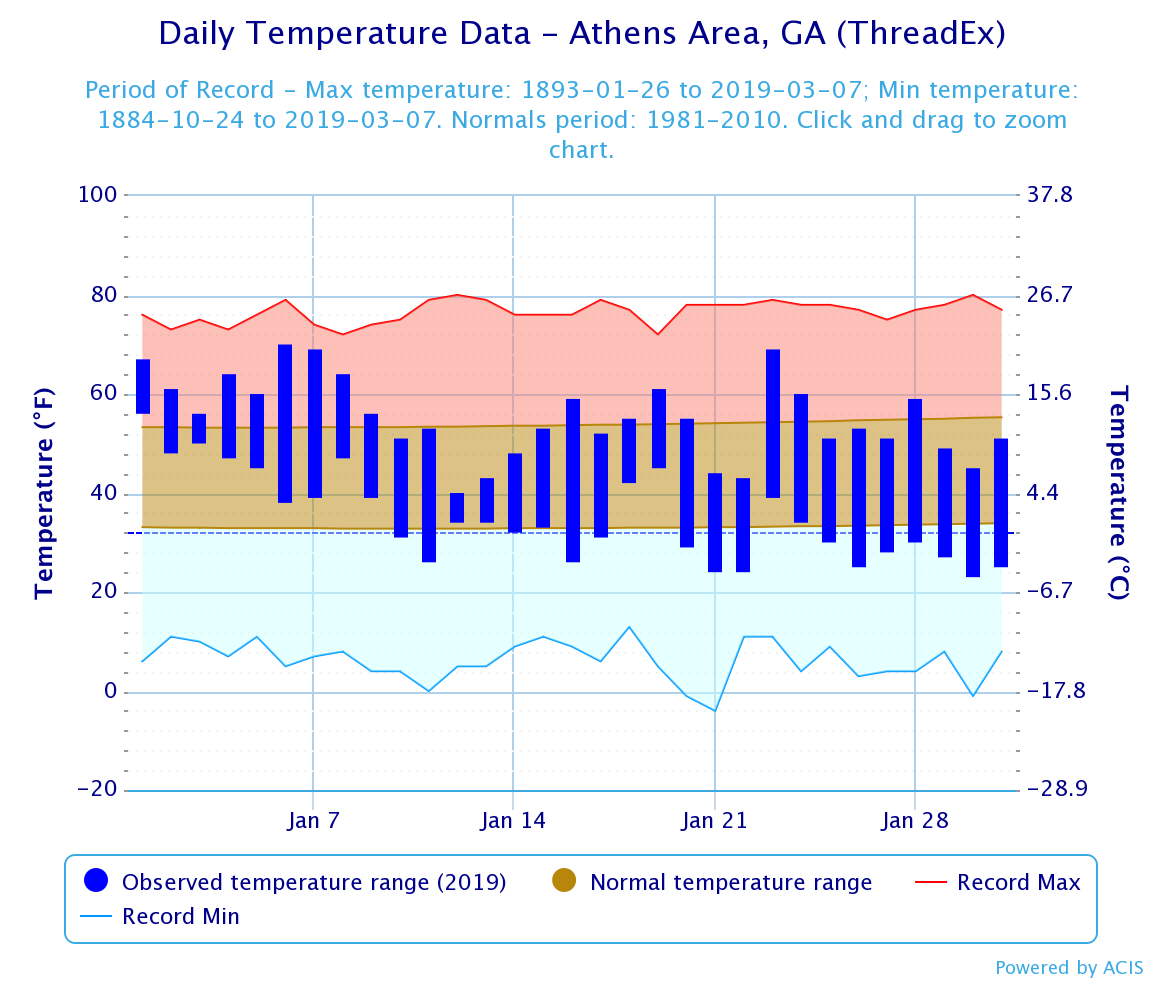
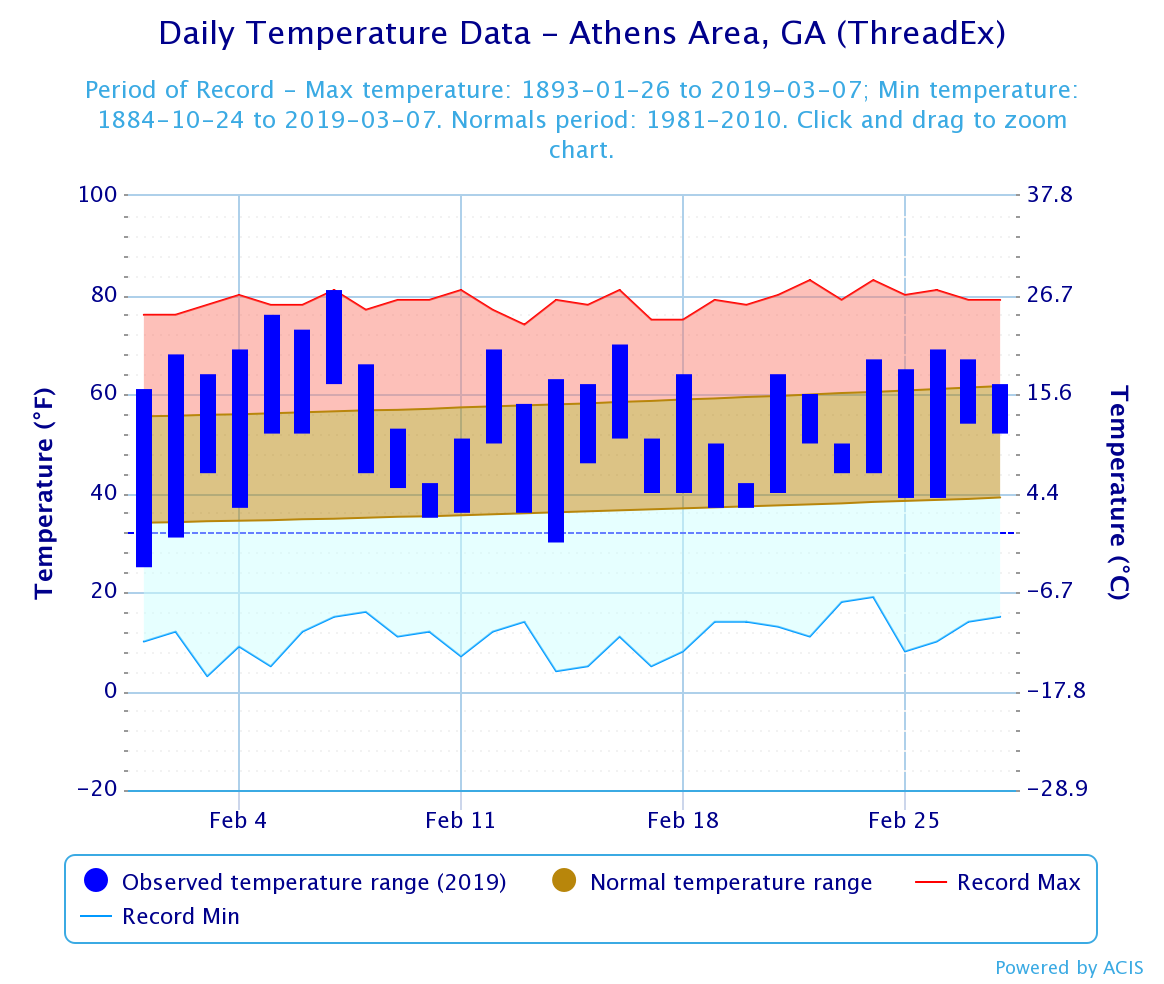
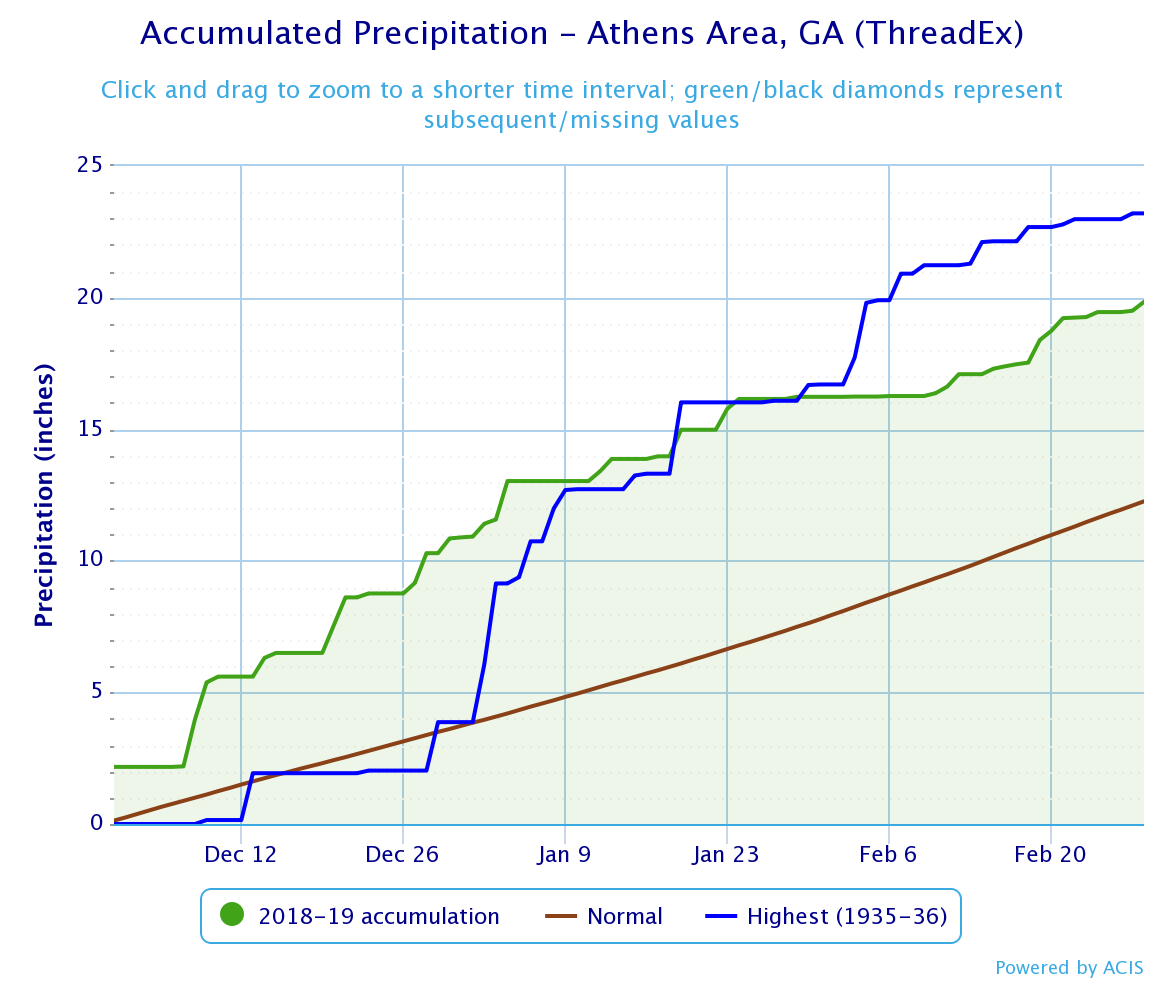
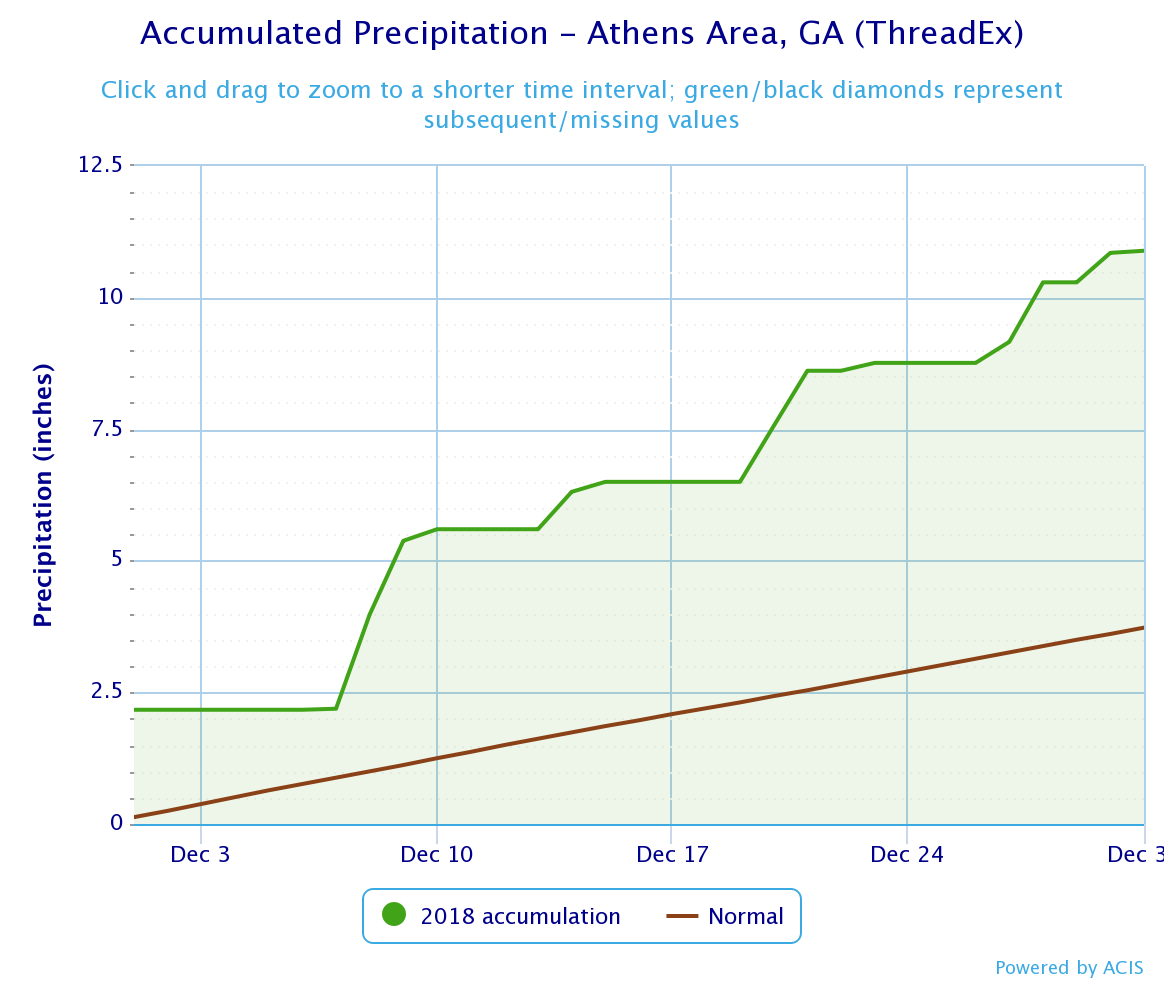
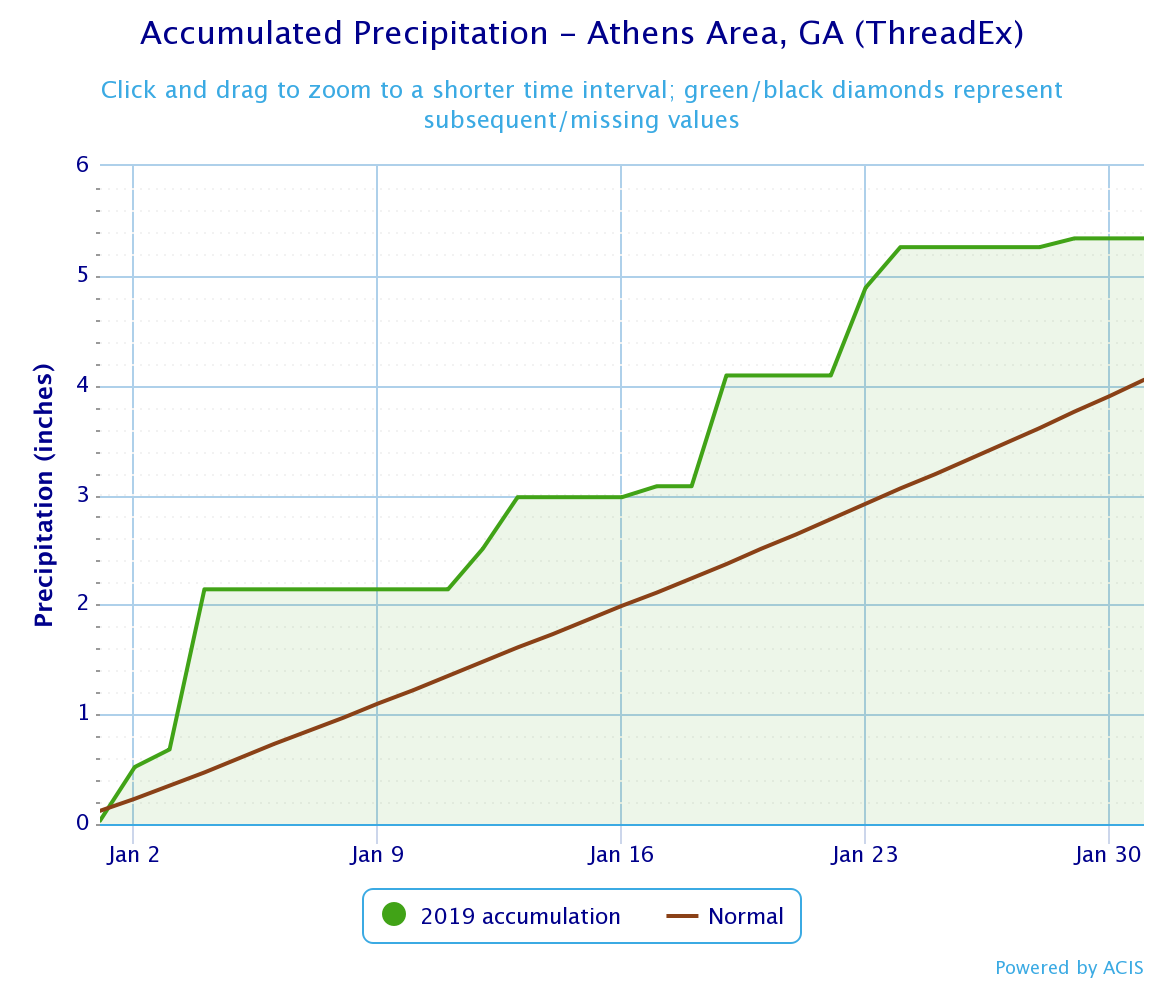
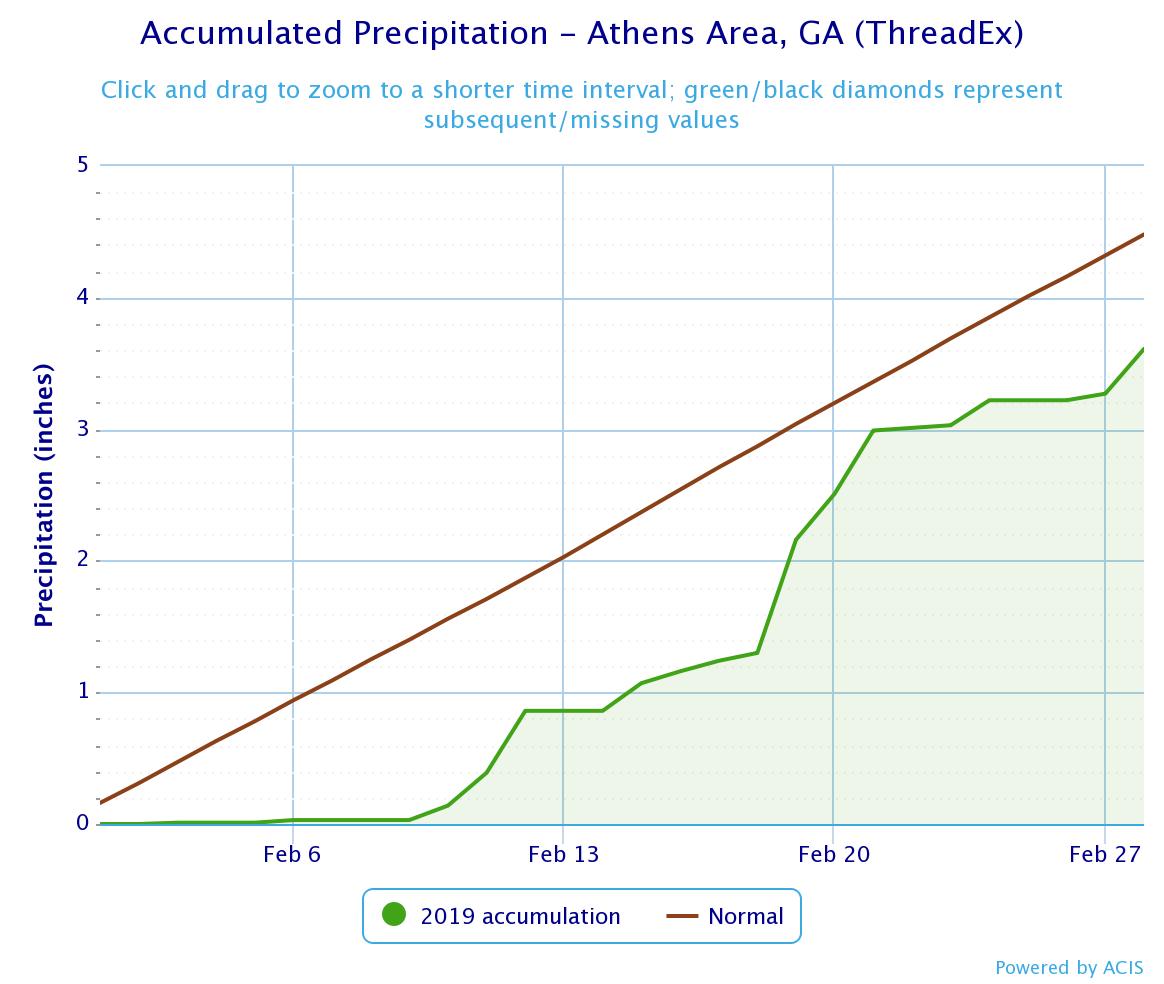
Athens 10th Warmest February on record 3rd Wettest December on record |
Athens 7th Wettest Winter on record |
|
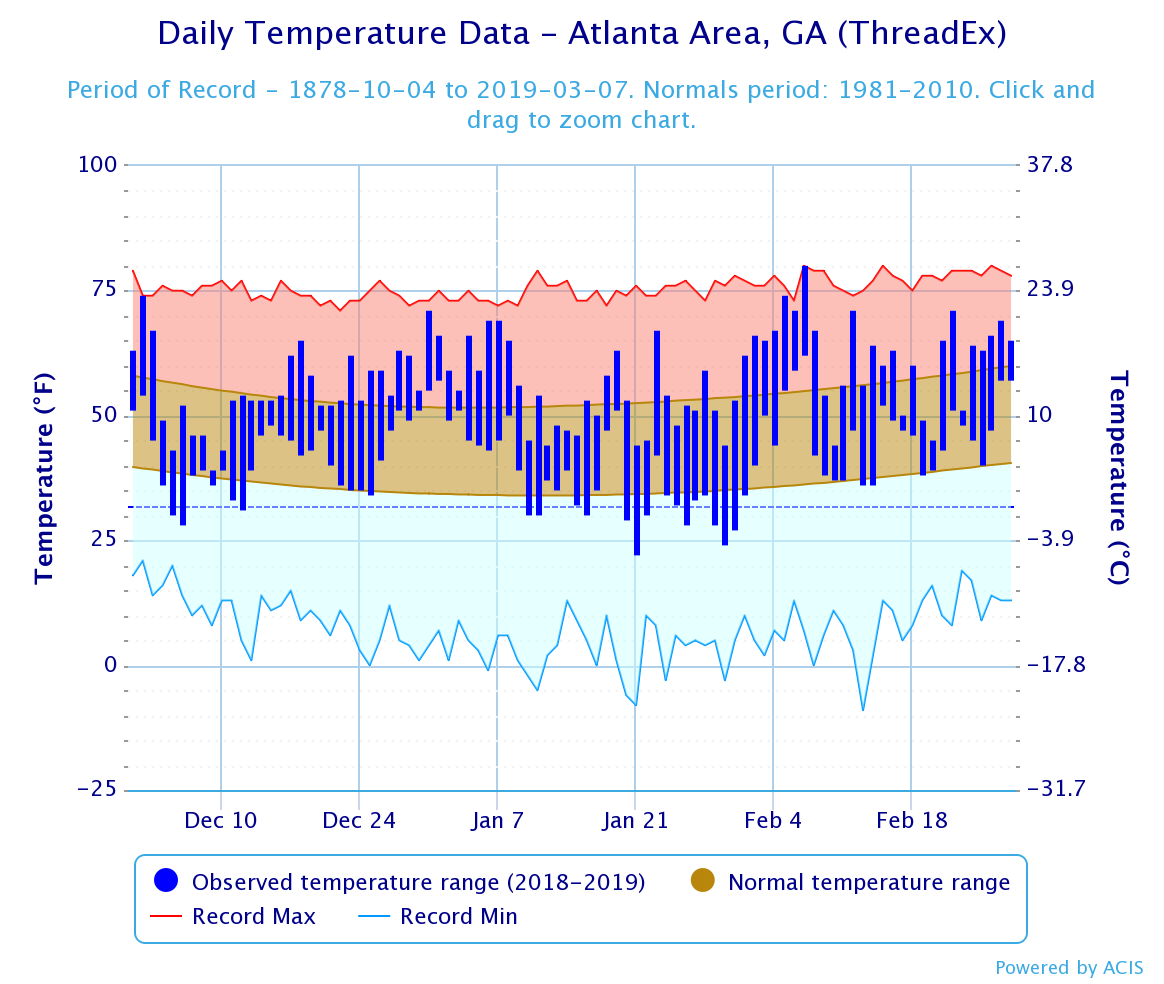
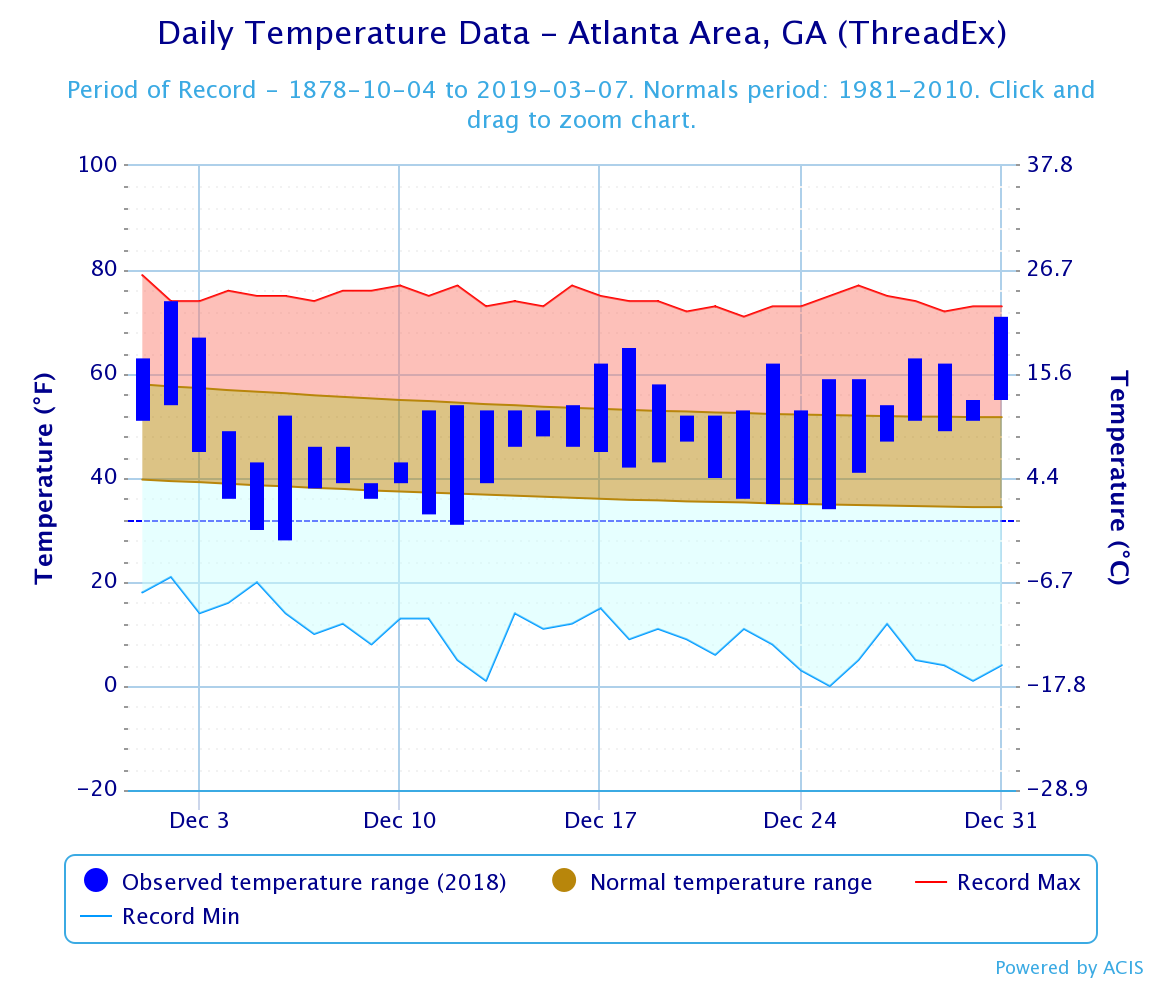
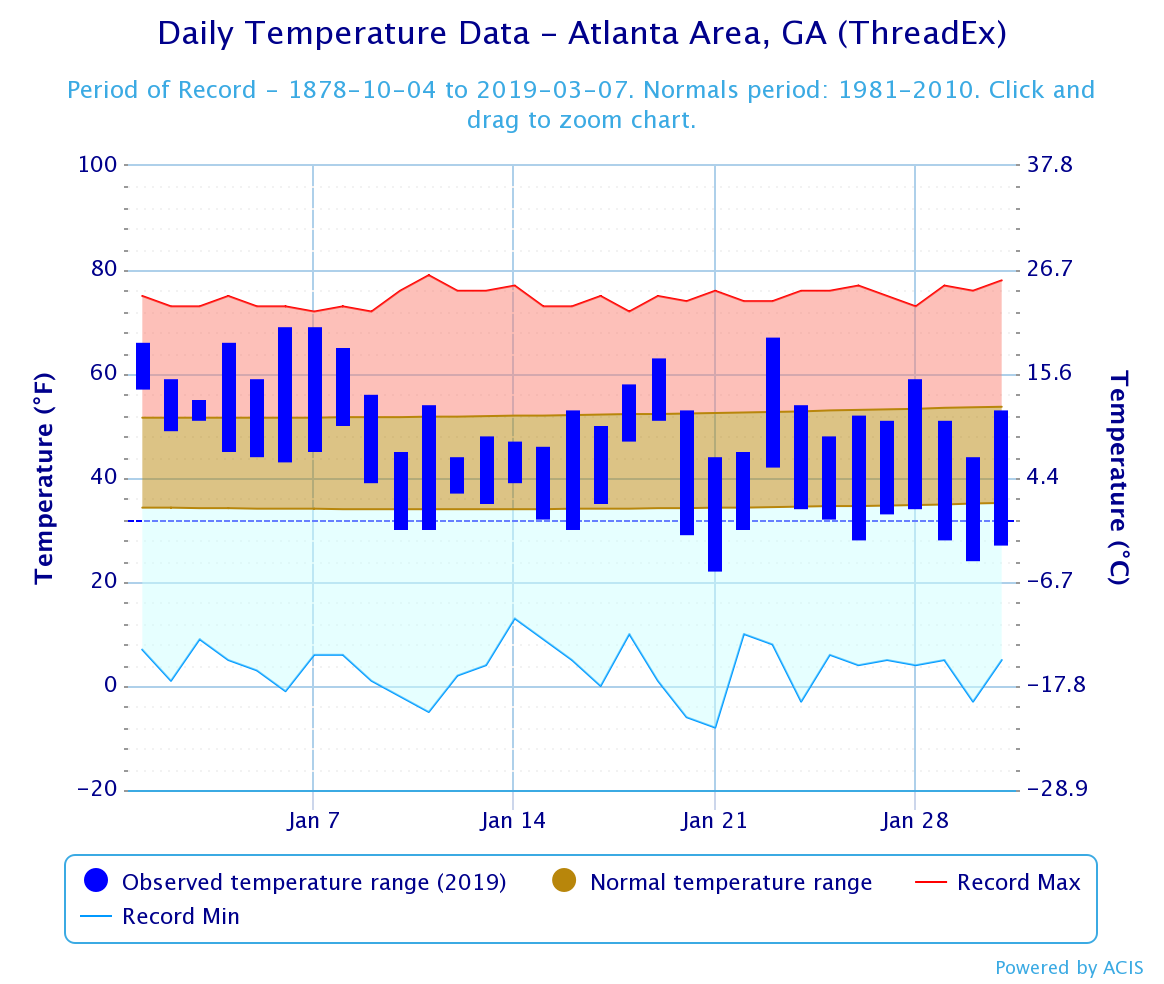
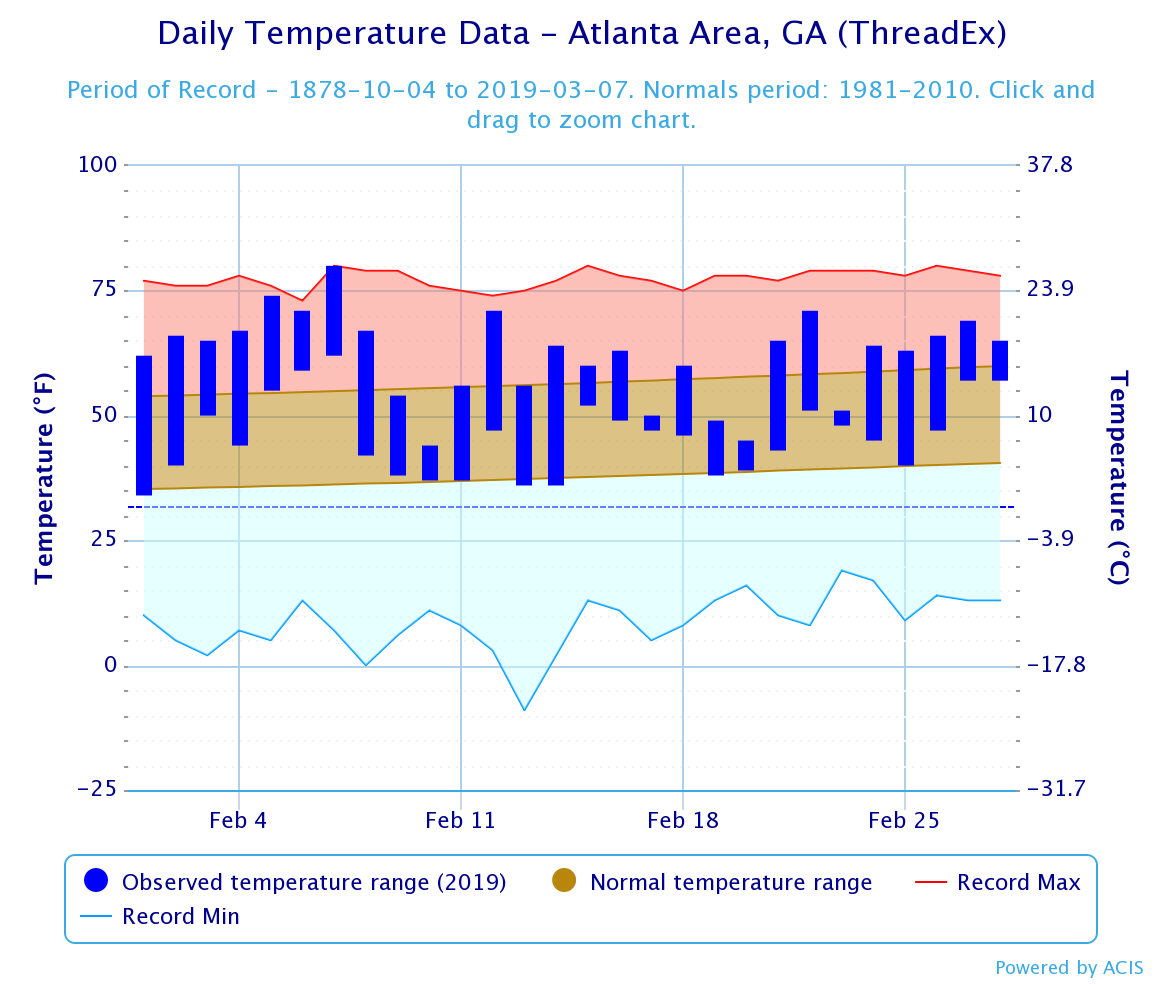
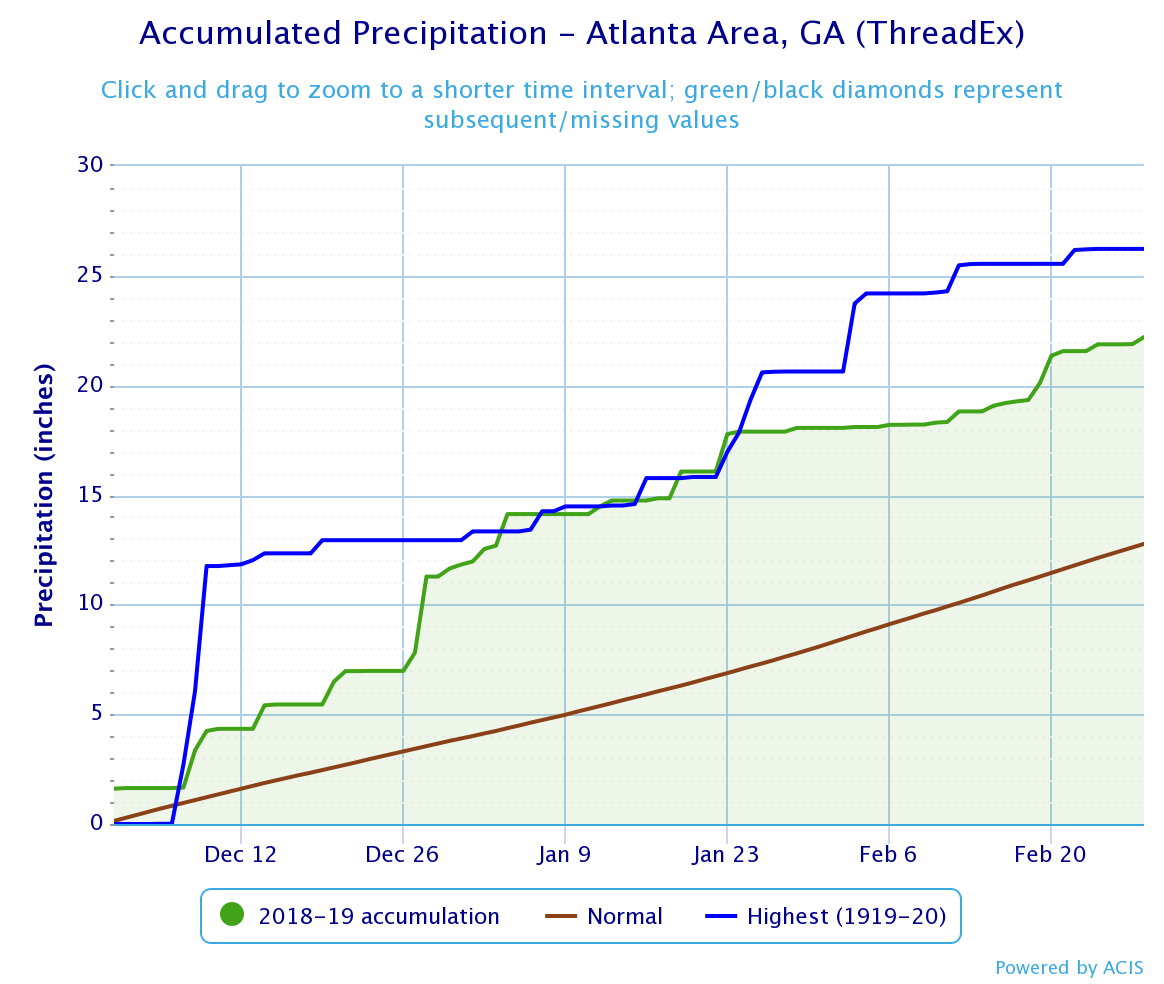
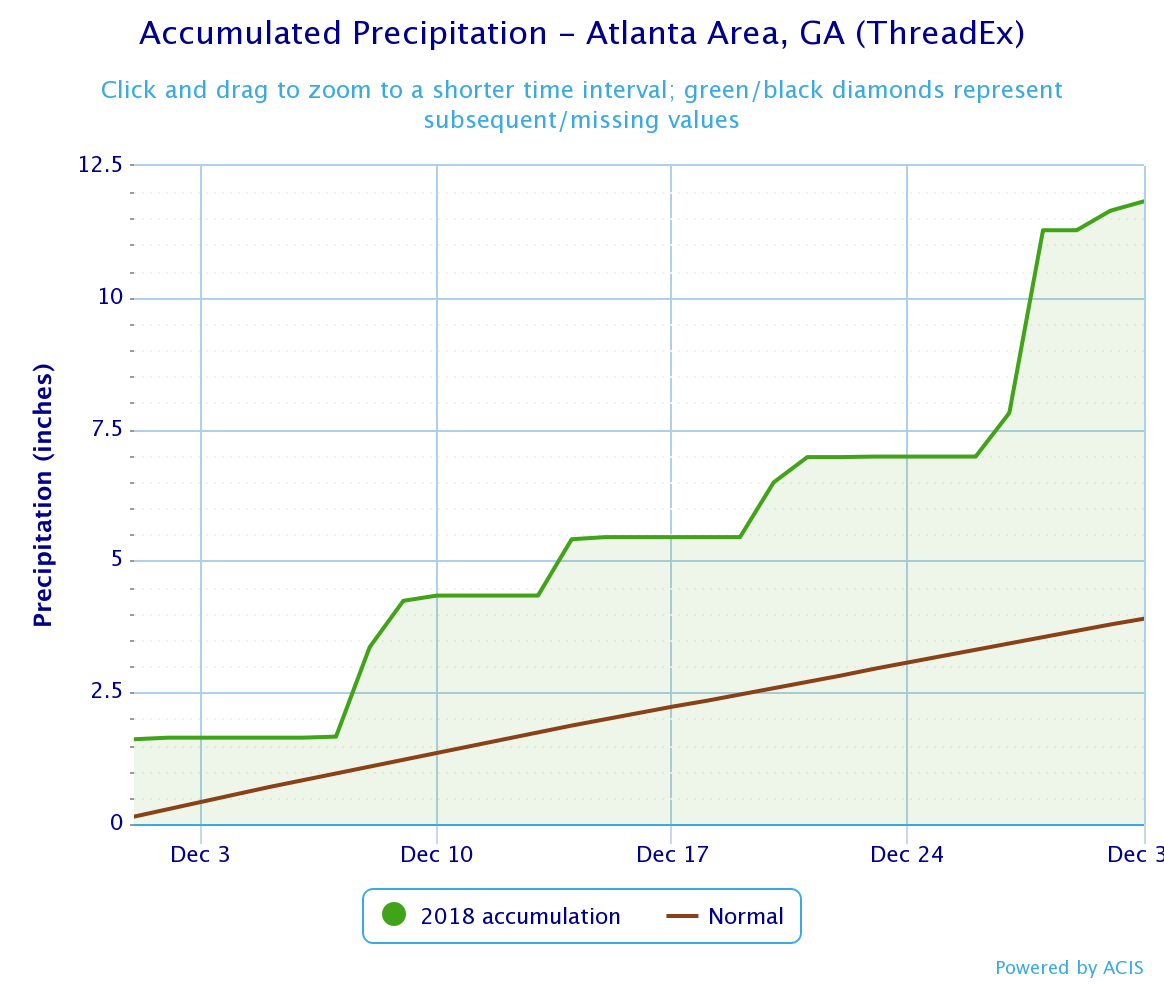
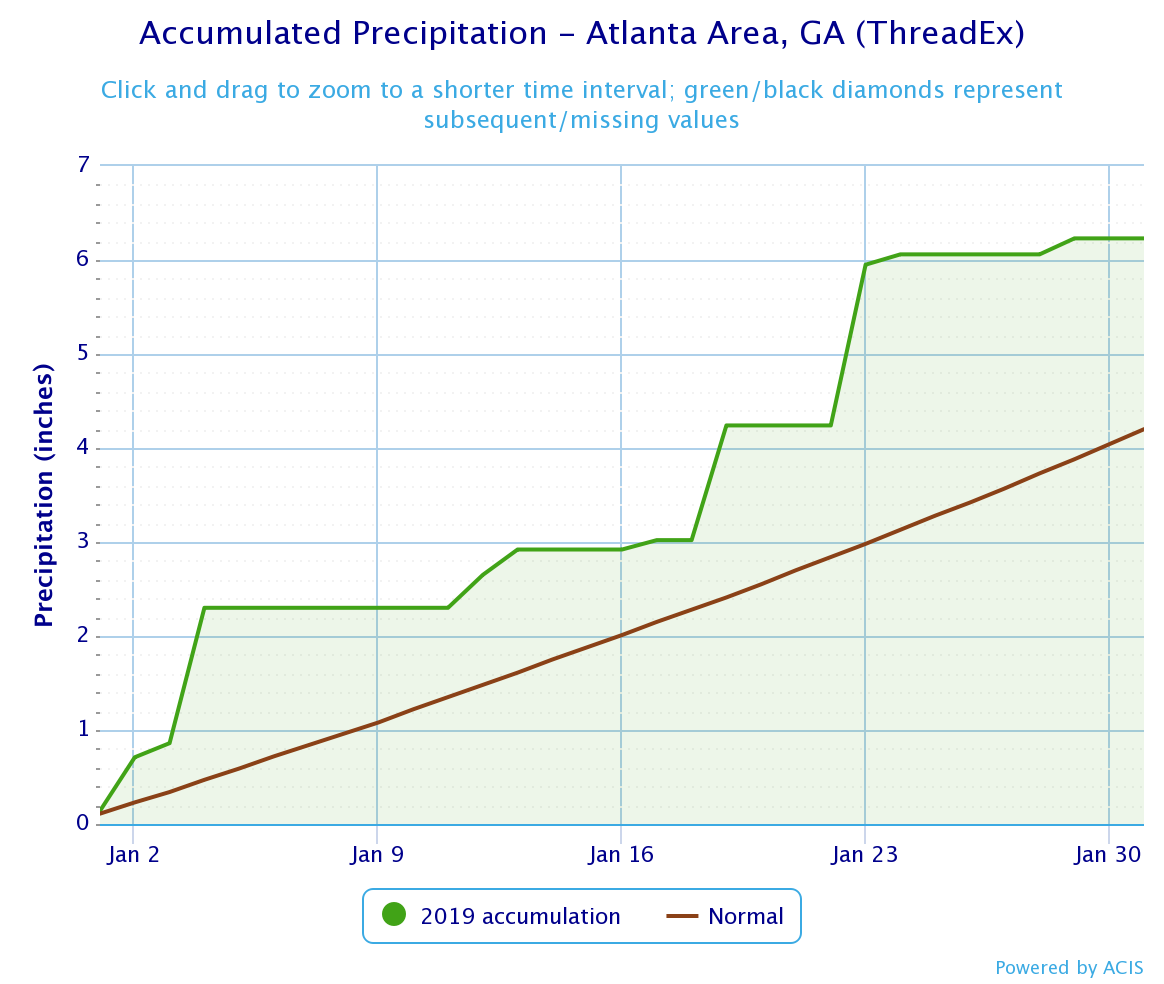
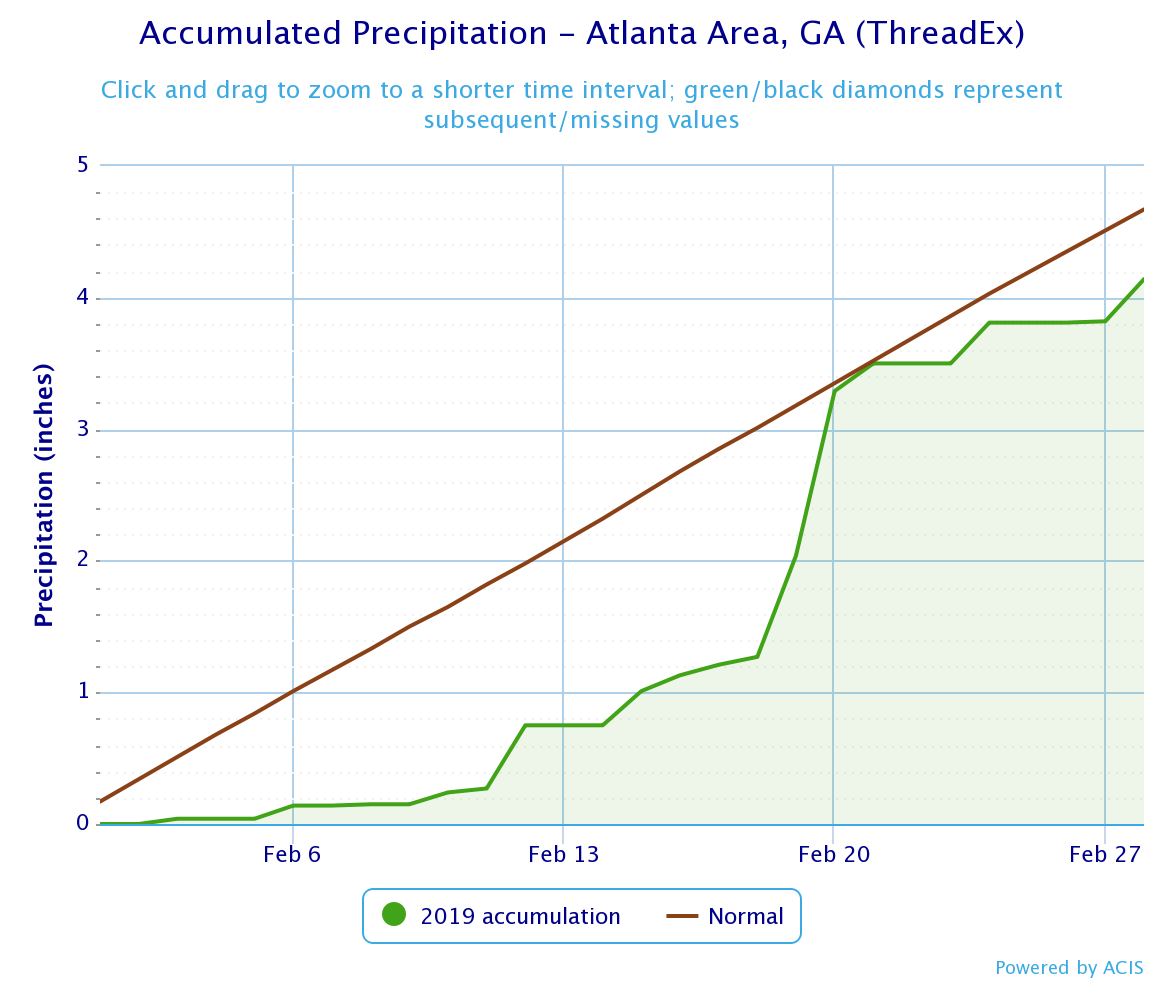
Atlanta 7th Warmest February on record 4th Wettest December on record |
Atlanta 8th Wettest Winter on record |
|
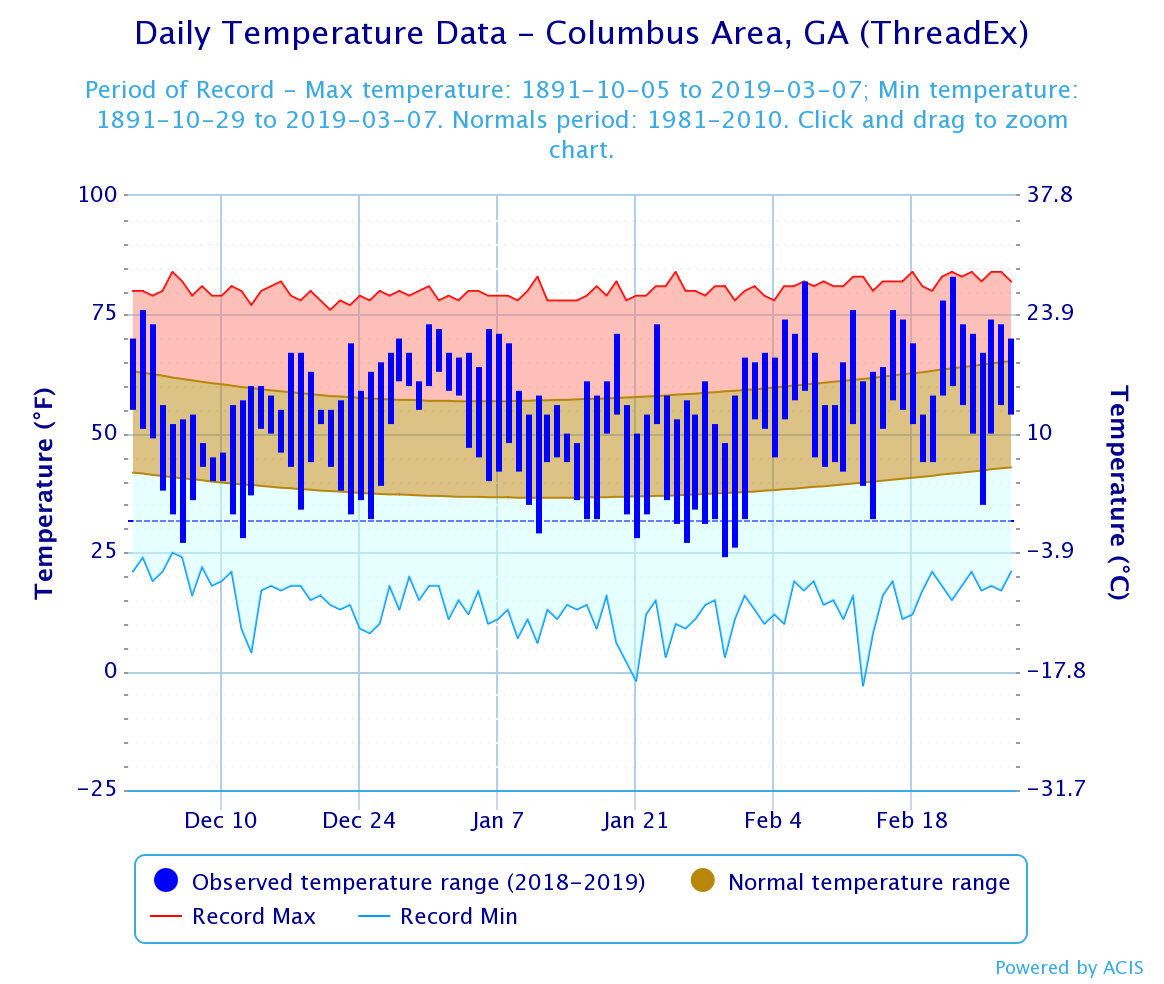
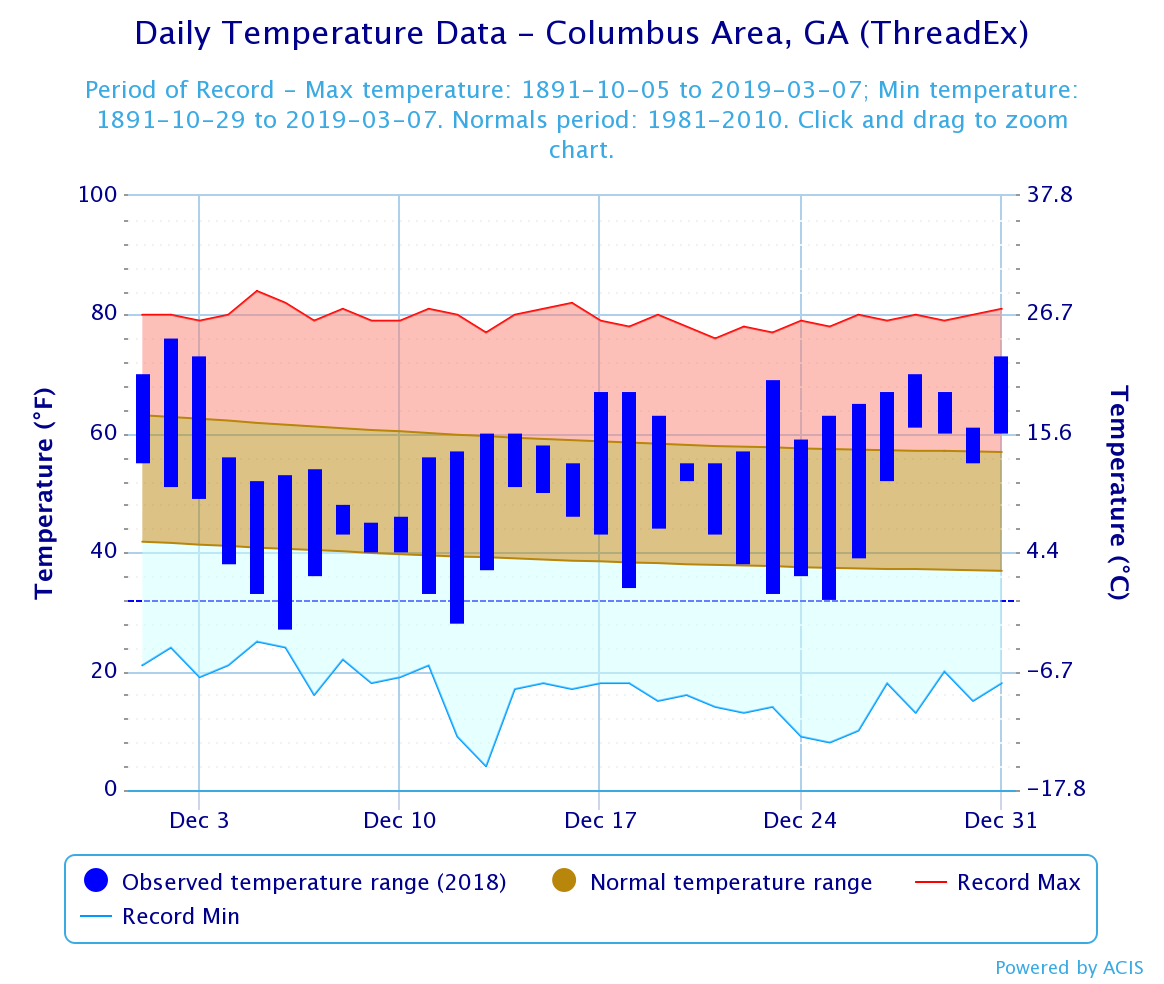
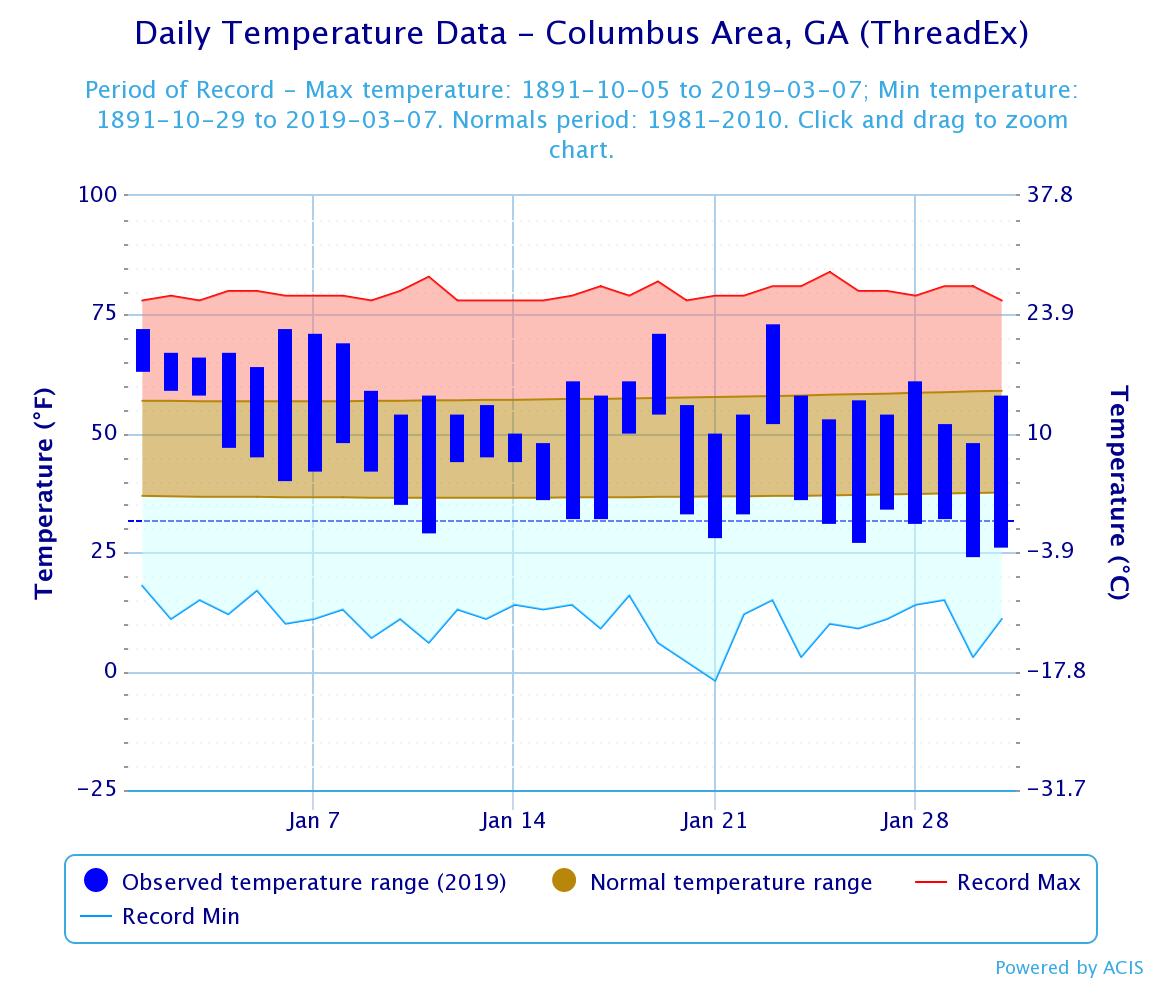
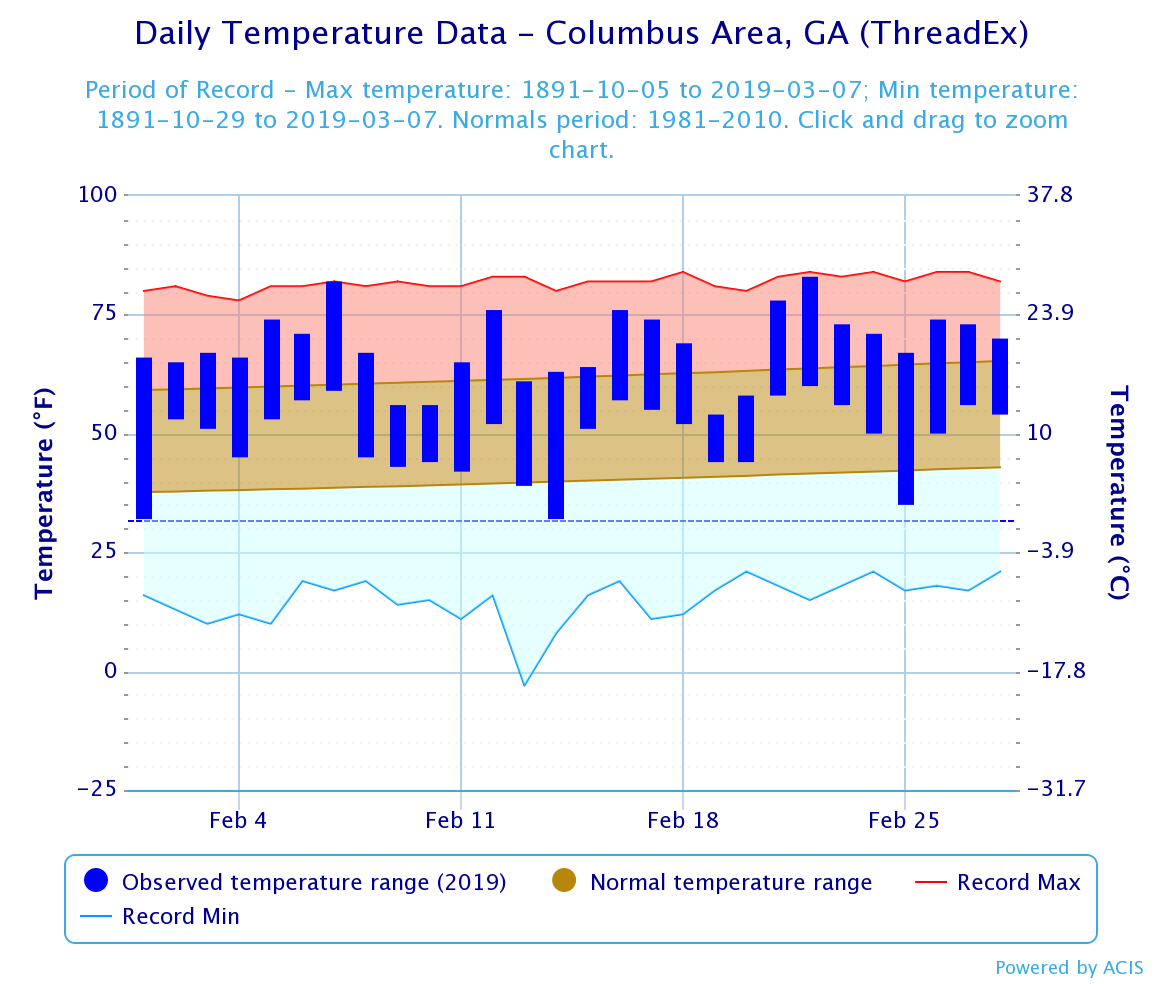
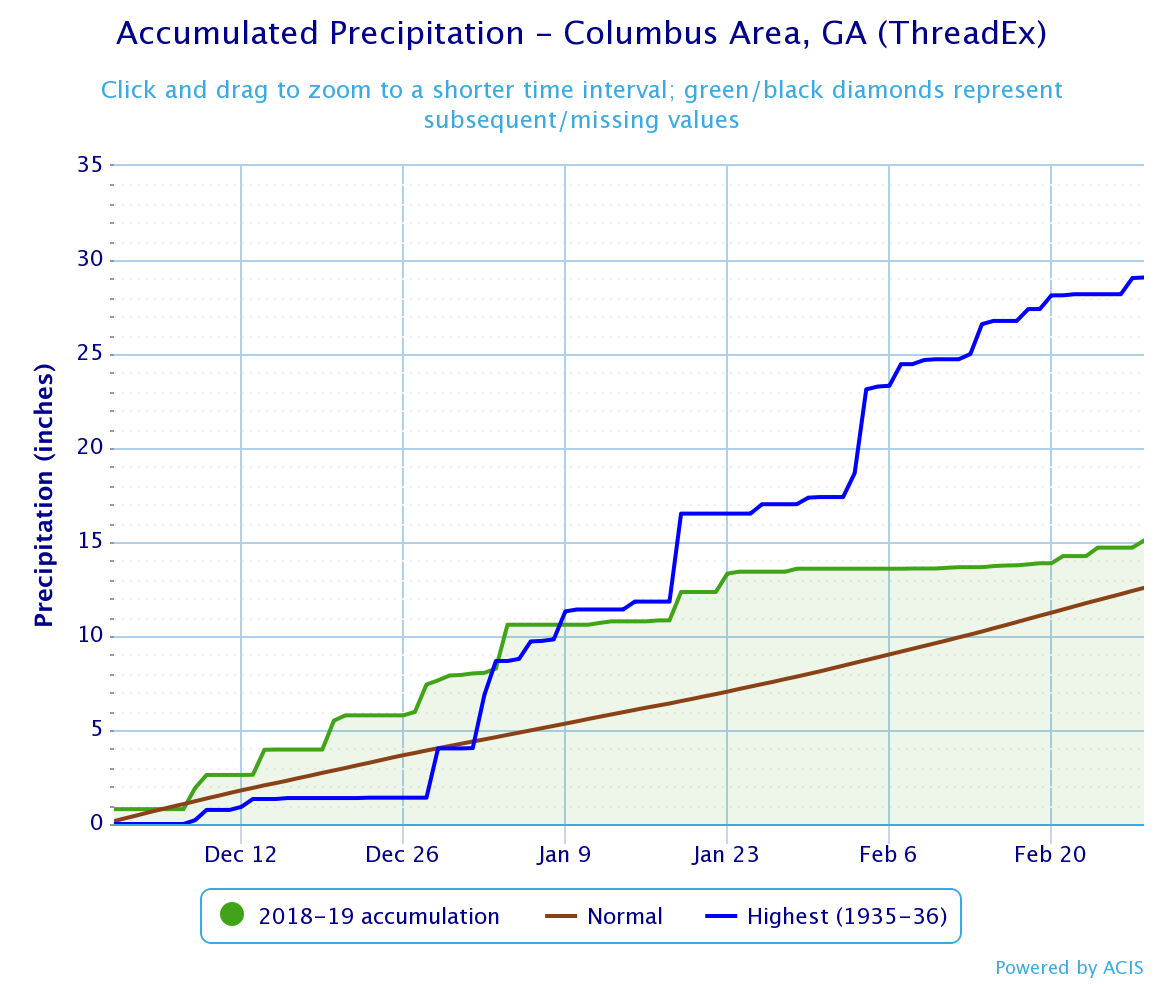
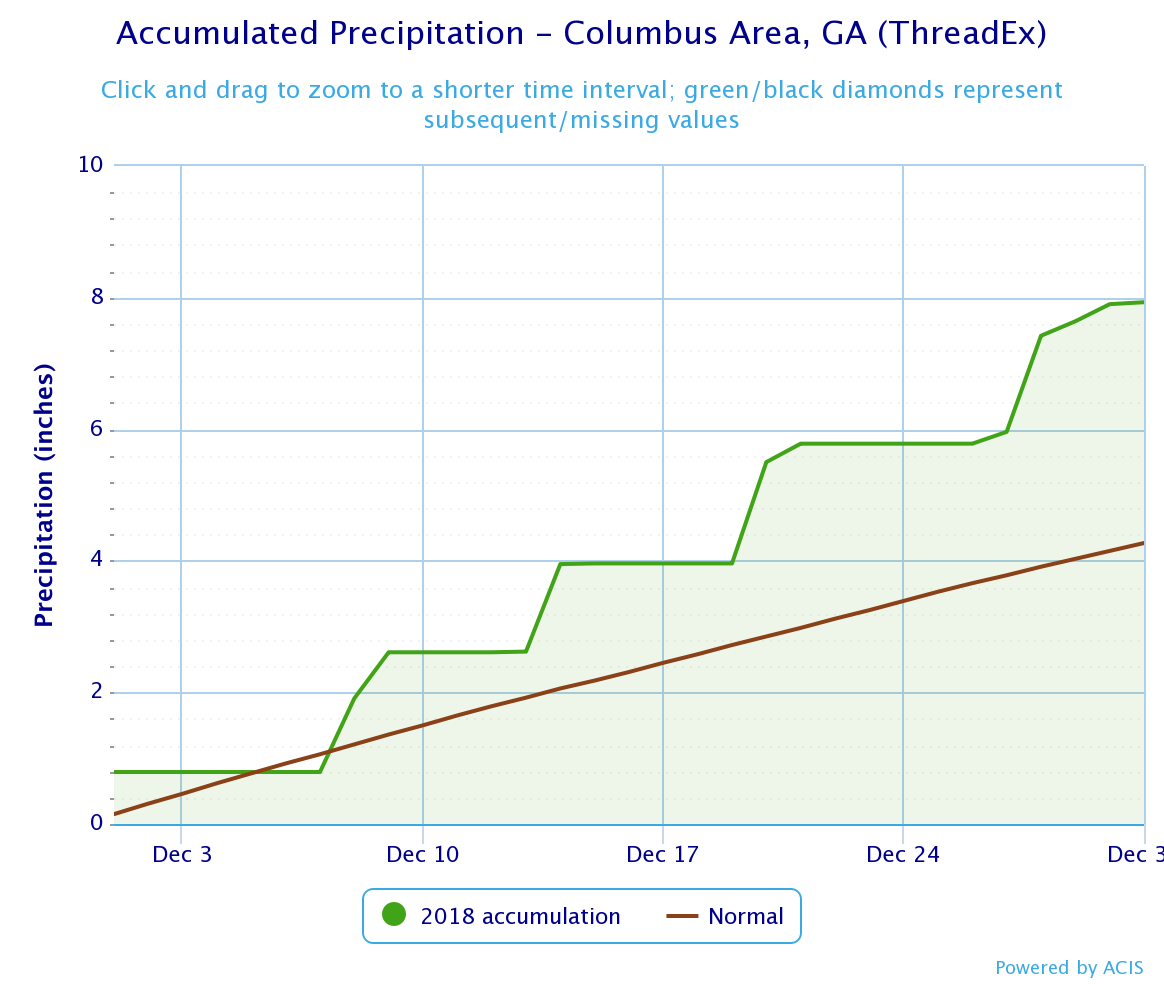
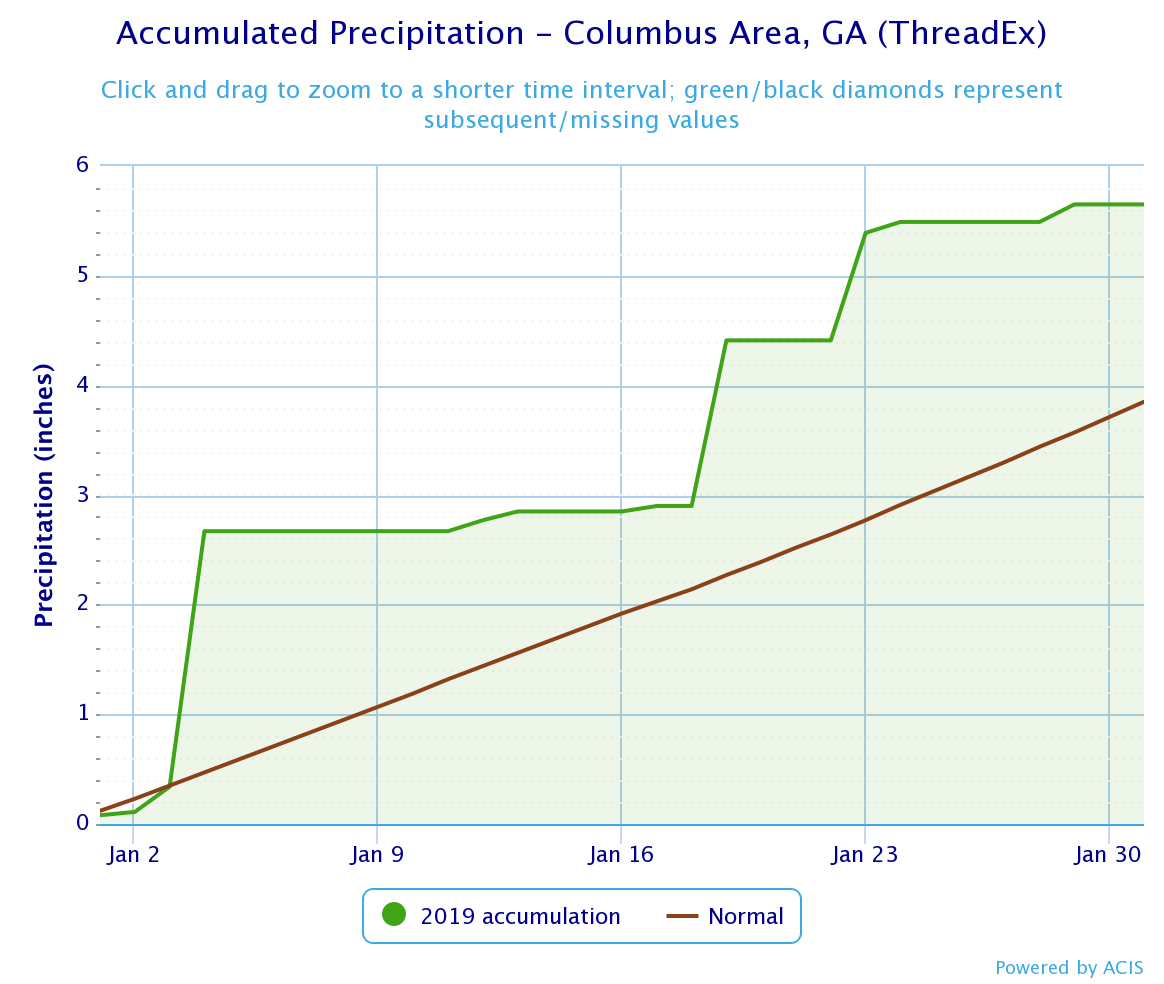
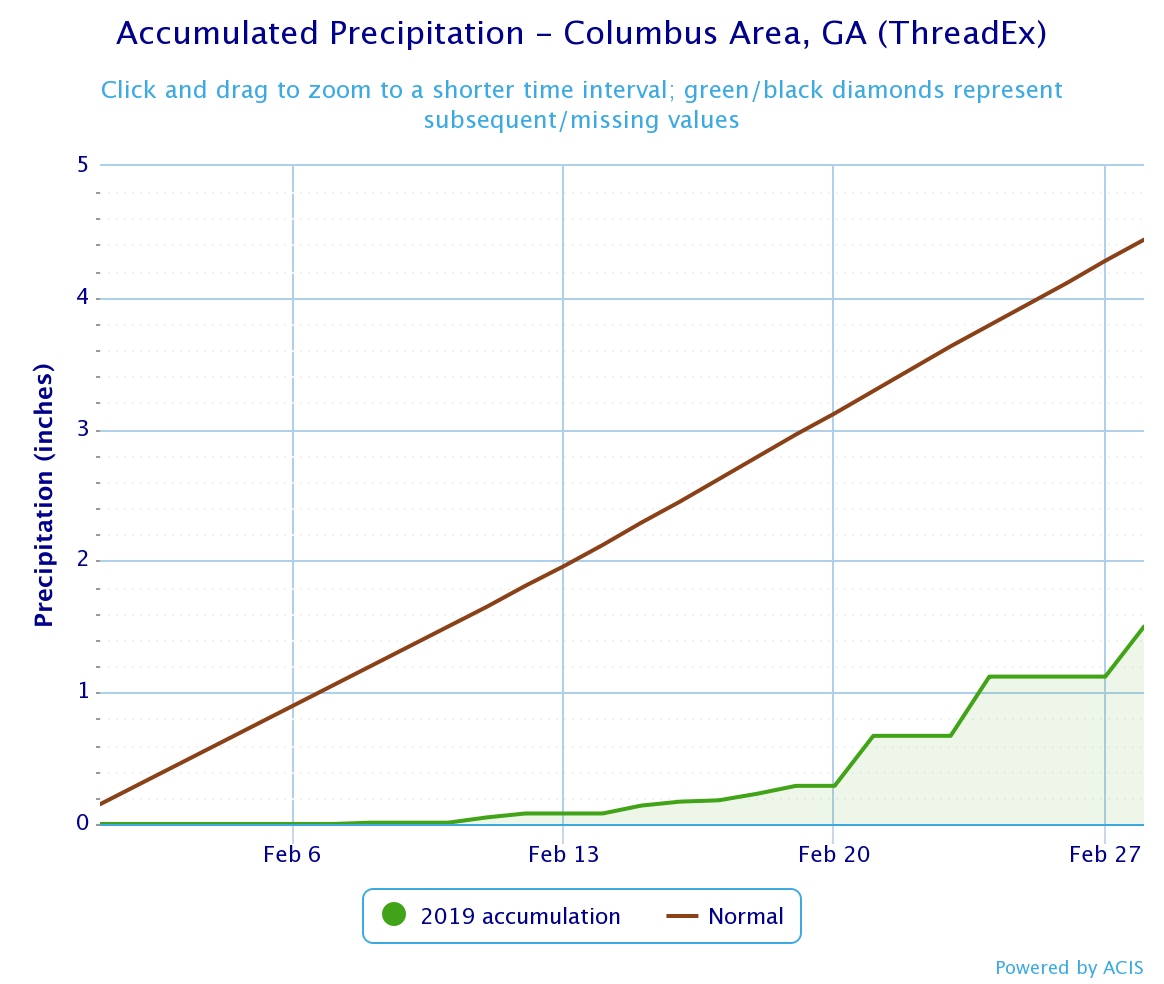
Columbus 5th Warmest February on record 9th Driest February on record |
Columbus None |
|
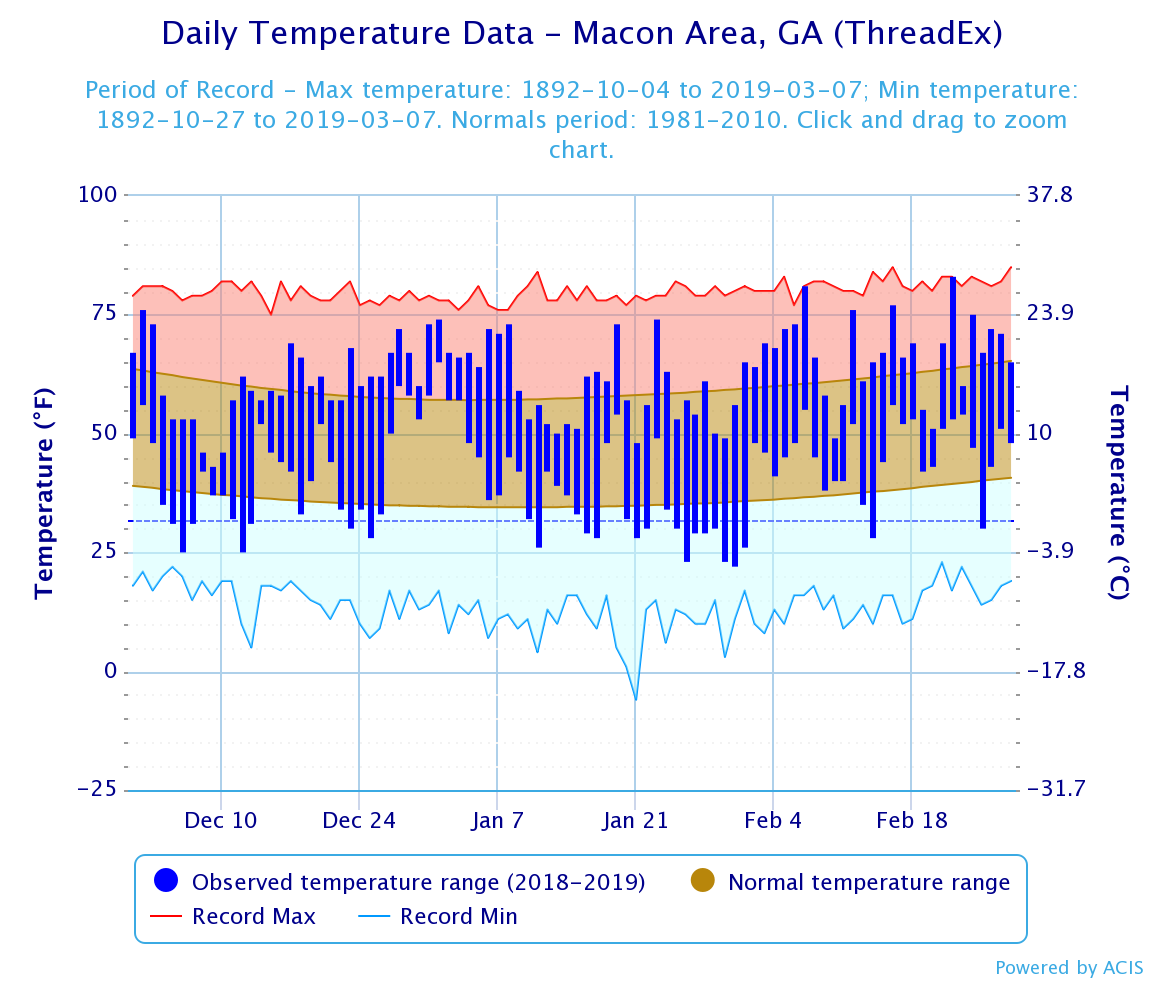
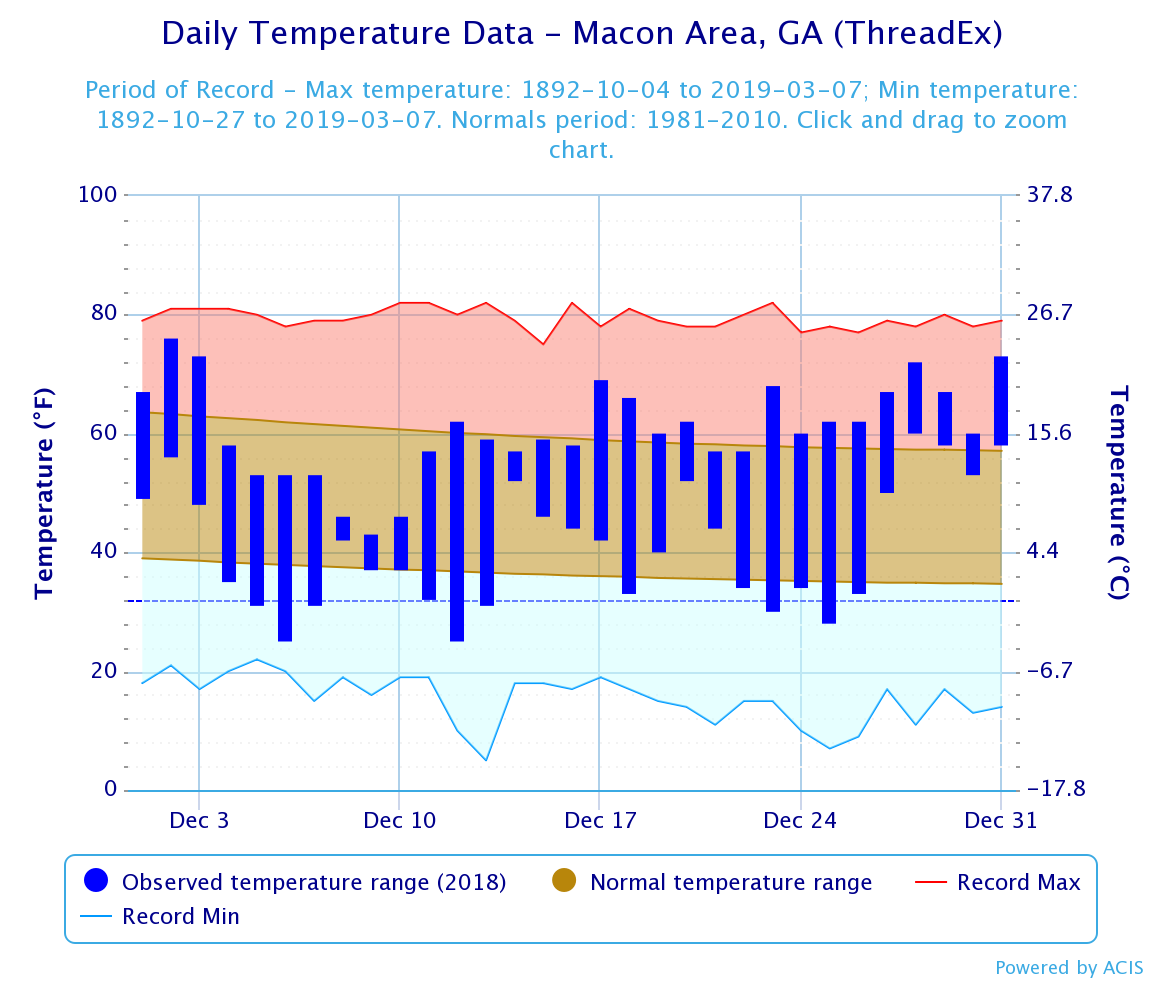
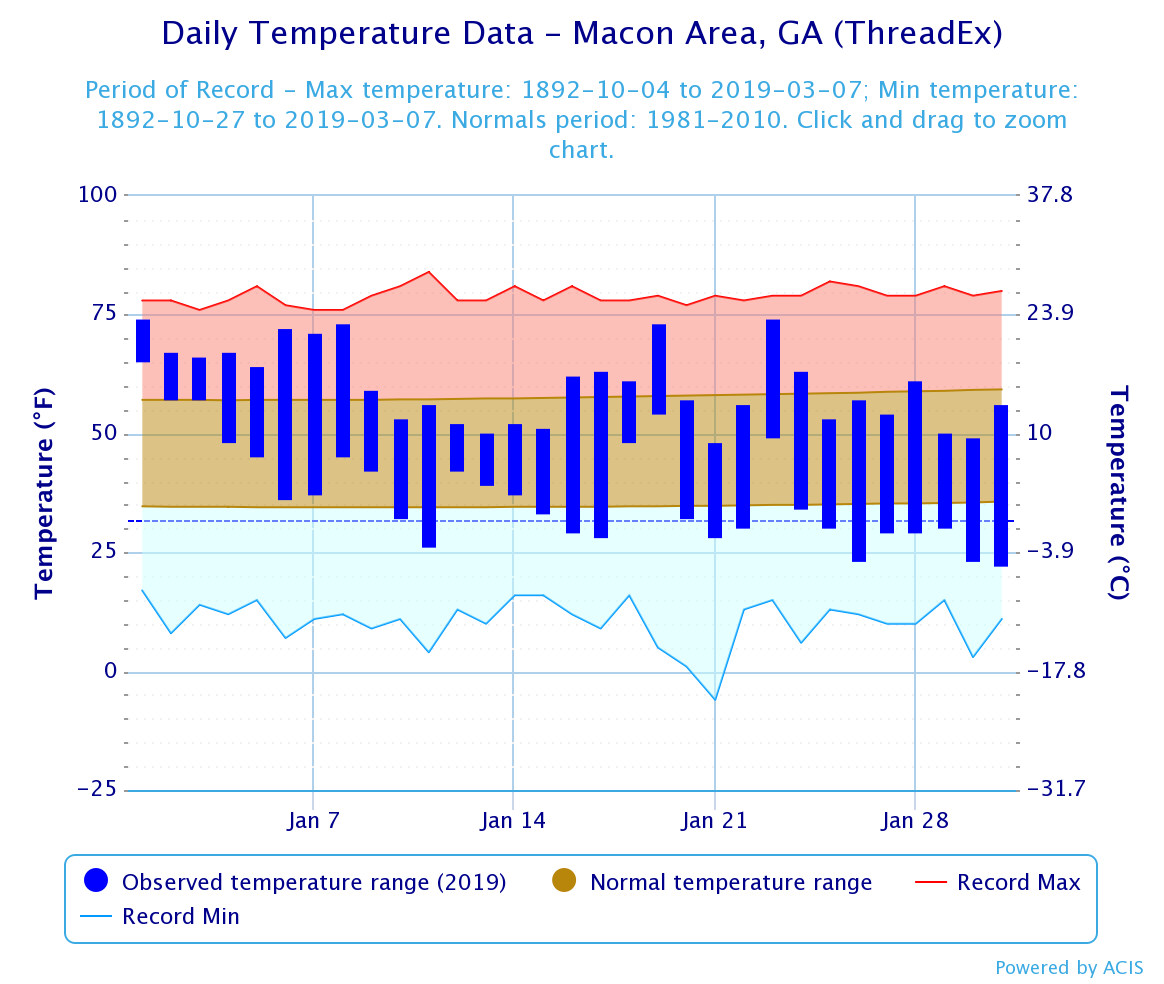
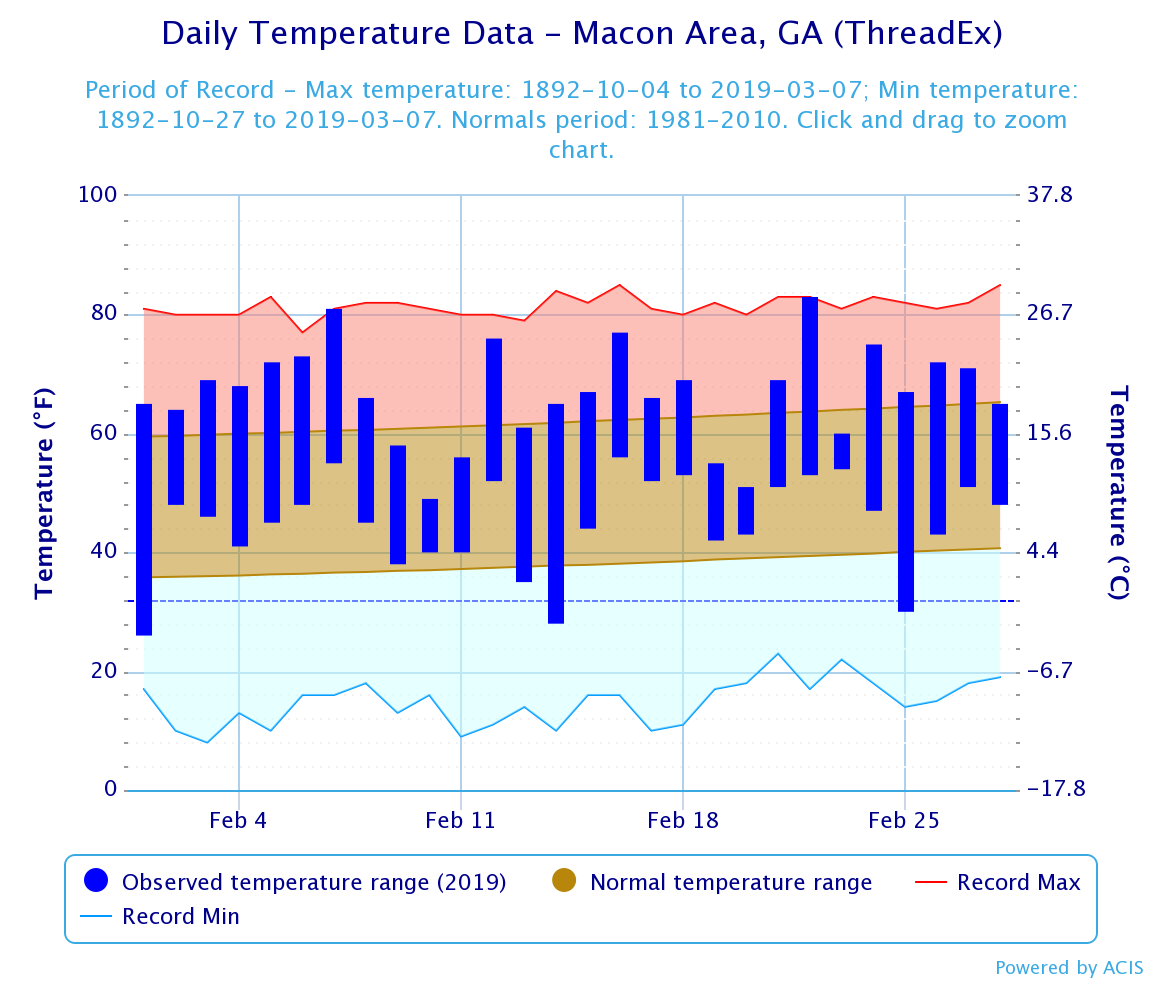
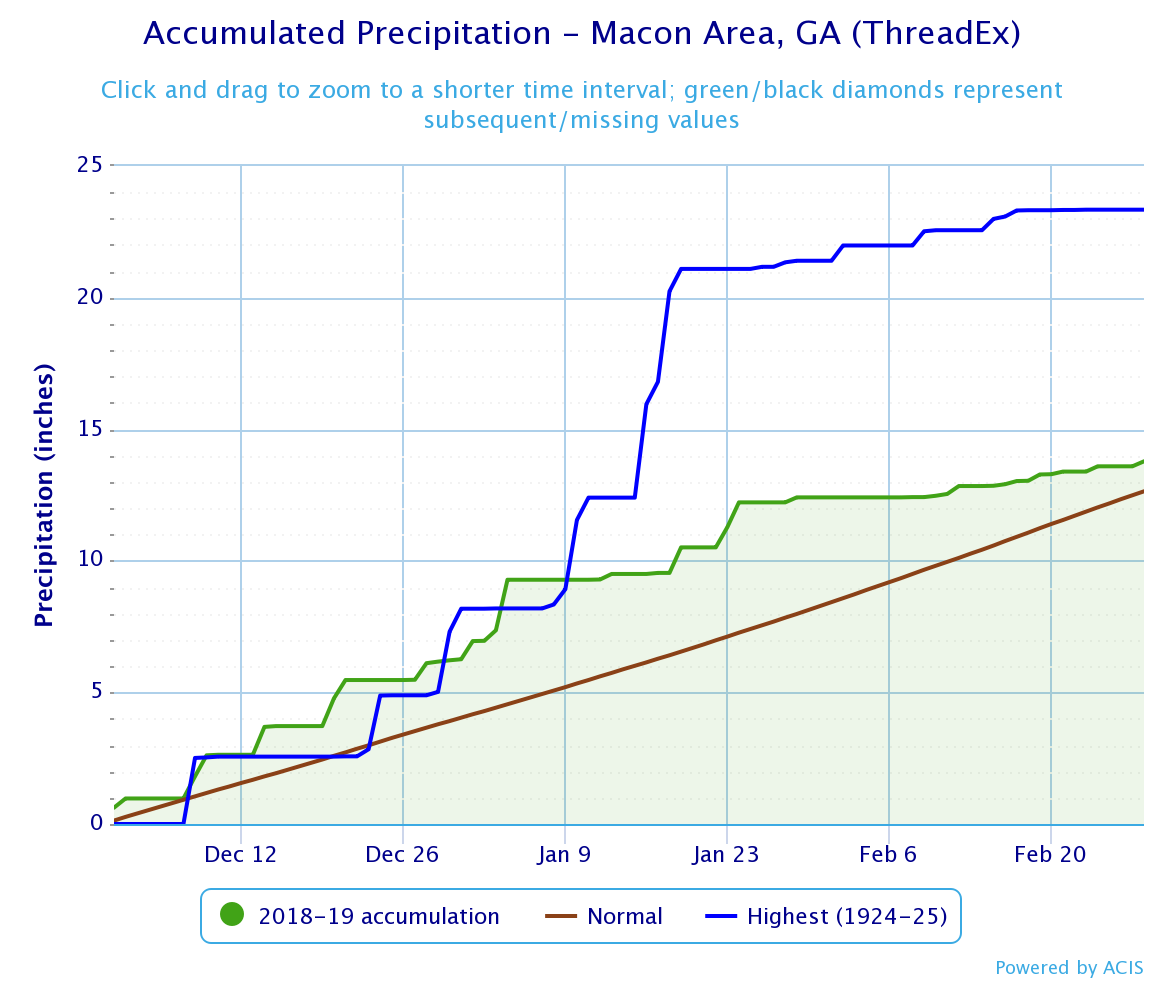
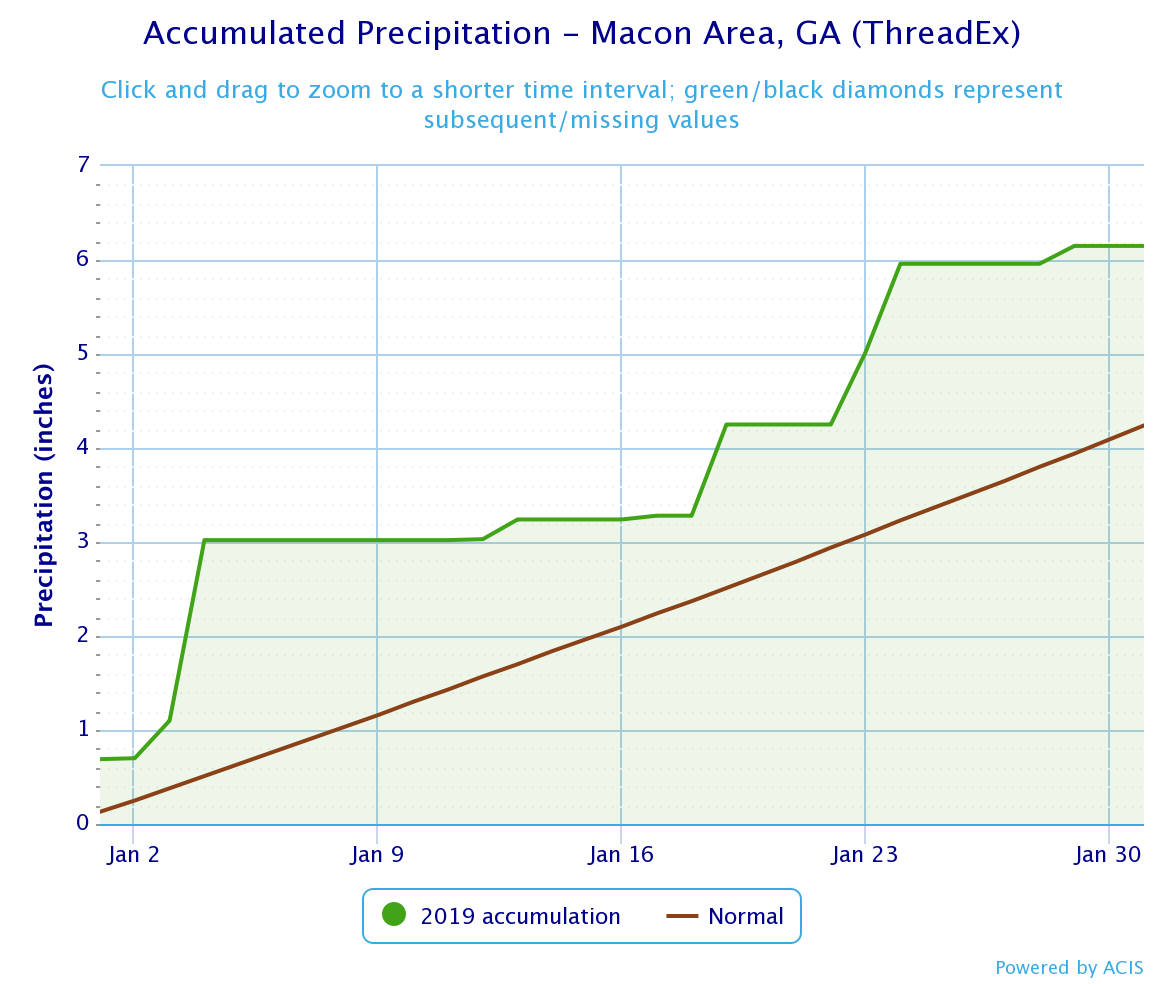
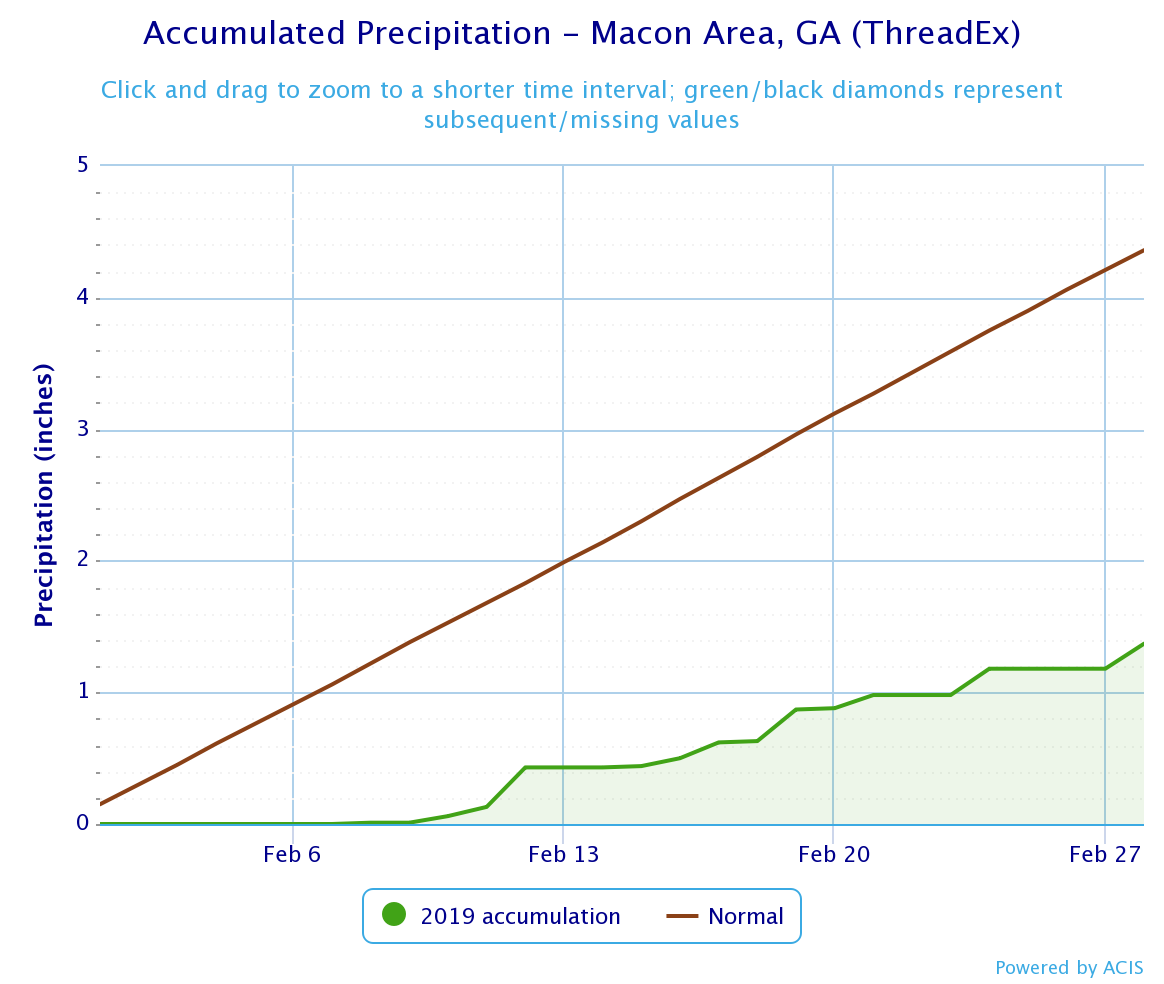
Macon 9th Warmest February on record 7th Driest February on record |
Macon None
|
*Complete rankings in tables below
Seasonal Avg. Temperature (°F) and Rankings for December-February
* Click on site name below to view a graph with additional data
|
Site |
Avg. Temp. and Current Ranking |
Normal |
Dep. from Normal |
Previous Records |
|
48.2 (17th Warmest) |
45.4 |
+2.8 |
54.2 (1931-32) |
|
|
49.4 (11th Warmest) |
45.3 |
+4.2 |
54.3 (1889-90) |
|
|
53.4 (11th Warmest) |
49.1 |
+4.3 |
57.5 (1926-27) |
|
|
51.8 (13th Warmest) |
48.1 |
+3.7 |
56.2 (1931-32) |
|
|
Cartersville |
46.0 |
42.8 |
+3.3 |
|
|
DeKalb Peachtree Arpt |
46.5 |
44.2 |
+2.3 |
|
|
Fulton Co. Arpt |
48.0 |
44.7 |
+3.3 |
|
|
Gainesville |
46.2 |
43.6 |
+2.6 |
|
|
Peachtree City |
49.6 |
44.6 |
+4.9 |
|
|
Rome |
47.1 |
42.7 |
+4.4 |
|
Temp. Extremes (ºF) for Dec-Feb
|
Site |
Warmest Temp. |
Coldest Temp. |
|
Athens |
81 (2/7)* |
23 (1/30) |
|
Atlanta |
80 (2/7)* |
22 (1/21) |
|
Columbus |
83 (2/22) |
24 (1/30) |
|
Macon |
83 (2/22)* |
22 (1/31) |
|
Cartersville |
81 (2/7)* |
18 (1/30) |
|
DeKalb Peachtree Arpt |
79 (2/7)* |
20 (1/21,1/30) |
|
Fulton Co. Arpt |
81 (2/7)* |
21 (1/21) |
|
Gainesville |
78 (2/7)* |
21 (1/21) |
|
Peachtree City |
82 (2/7)* |
21 (1/30,1/31) |
|
Rome |
82 (2/7)* |
18 (1/30) |
* Set record for day
December 2018 Avg. Temperature (°F) and Rankings
* Click on site name below to view a graph with additional data
|
Site |
Avg. Temp. and Current Ranking |
Normal |
Dep. from Normal |
Record |
|
47.4 (34th Warmest) |
45.4 |
+2.0 |
56.4 (2015) |
|
|
48.6 (26th Warmest) |
45.3 |
+3.3 |
57.6 (2015) |
|
|
51.9 (32nd Warmest) |
49.1 |
+2.8 |
59.1 (2015) |
|
|
50.8 (35th Warmest) |
48.0 |
+2.8 |
58.6 (2015) |
|
|
Cartersville |
45.0 |
42.6 |
+2.4 |
|
|
DeKalb Peachtree Arpt |
45.6 |
44.3 |
+1.3 |
|
|
Fulton Co. Arpt |
47.0 |
44.8 |
+2.2 |
|
|
Gainesville |
45.3 |
43.7 |
+1.6 |
|
|
Peachtree City |
48.3 |
44.4 |
+3.9 |
|
|
Rome |
46.2 |
42.6 |
+3.6 |
|
January Avg. Temperature (°F) and Rankings
* Click on site name below to view a graph with additional data
|
Site |
Avg. Temp. and Current Ranking |
Normal |
Dep. from Normal |
Record |
|
45.0 (44th Warmest) |
43.5 |
+1.5 |
54.4 (1950) |
|
|
45.9 (38th Warmest) |
43.3 |
+2.6 |
55.4 (1950) |
|
|
49.7 (40th Warmest) |
47.2 |
+2.5 |
60.4 (1950) |
|
|
48.8 (43rd Warmest) |
46.3 |
+2.5 |
60.5 (1950) |
|
|
Cartersville |
42.5 |
41.1 |
+1.4 |
|
|
DeKalb Peachtree Arpt |
43.4 |
42.2 |
+1.2 |
|
|
Fulton Co. Arpt |
44.8 |
43.1 |
+1.7 |
|
|
Gainesville |
42.9 |
41.7 |
+1.2 |
|
|
Peachtree City |
46.1 |
42.8 |
+3.3 |
|
|
Rome |
43.5 |
41.1 |
+2.4 |
February Avg. Temperature (°F) and Rankings
* Click on site name below to view a graph with additional data
|
Site |
Avg. Temp. and Current Ranking |
Normal |
Dep. from Normal |
Record |
|
52.2 (10th Warmest) |
47.2 |
+5.0 |
57.4 (2018) |
|
|
53.8 (7th Warmest) |
47.2 |
+6.6 |
57.3 (2018) |
|
|
58.7 (5th Warmest) |
51.1 |
+7.6 |
62.3 (2018) |
|
|
55.8 (9th Warmest) |
50.0 |
+5.8 |
60.3 (2018) |
|
|
Cartersville |
50.6 |
44.6 |
+6.0 |
|
|
DeKalb Peachtree Arpt |
50.6 |
46.1 |
+4.5 |
|
|
Fulton Co. Arpt |
52.2 |
46.3 |
+5.9 |
|
|
Gainesville |
50.4 |
45.5 |
+4.9 |
|
|
Peachtree City |
54.3 |
46.7 |
+7.6 |
|
|
Rome |
51.6 |
44.3 |
+7.3 |
Temp. Extremes (°F) for February
|
Site |
Warmest Temp. |
Coldest Temp. |
|
Athens |
81 (2/7)* |
25 (2/1) |
|
Atlanta |
80 (2/7)* |
34 (2/1) |
|
Columbus |
83 (2/22) |
32 (2/1, 2/14) |
|
Macon |
83 (2/22)* |
26 (2/1) |
|
Cartersville |
81 (2/7)* |
24 (2/1) |
|
DeKalb Peachtree Arpt |
79 (2/7)* |
25 (2/1)* |
|
Fulton Co. Arpt |
81 (2/7)* |
26 (2/1) |
|
Gainesville |
78 (2/7)* |
28 (2/1) |
|
Peachtree City |
82 (2/7)* |
26 (2/1) |
|
Rome |
82 (2/7)* |
25 (2/1) |
* Set record for day
Seasonal Precipitation Totals (in) and Rankings for Dec-Feb
* Click on site name below to view a graph with additional data
|
Site |
Total Precip. and Current Ranking |
Normal |
Dep. from Normal |
Previous Records |
|
19.84 (7th Wettest) |
12.26 |
+7.58 |
23.20 (1935-36) |
|
|
22.20 (8th Wettest) |
12.77 |
+9.43 |
26.30 (1919-20) |
|
|
15.08 (42nd Wettest) |
12.56 |
+2.52 |
29.07 (1935-36) |
|
|
13.78 (46th Wettest) |
12.64 |
+1.14 |
23.34 (1924-25) |
|
|
Cartersville |
21.99 |
13.74 |
+8.25 |
|
|
DeKalb Peachtree Arpt |
22.55 |
13.97 |
+8.58 |
|
|
Fulton Co. Arpt |
22.09 |
13.16 |
+8.93 |
|
|
Gainesville |
24.76 |
14.40 |
+10.36 |
|
|
Peachtree City |
19.42 |
13.24 |
+6.18 |
|
|
Rome |
27.98 |
14.07 |
+13.91 |
|
Precip. Extremes (in) for Dec-Feb
|
Site |
Highest Daily Amount |
|
Athens |
2.17 (12/1)* |
|
Atlanta |
3.47 (12/28) |
|
Columbus |
2.33 (1/4)* |
|
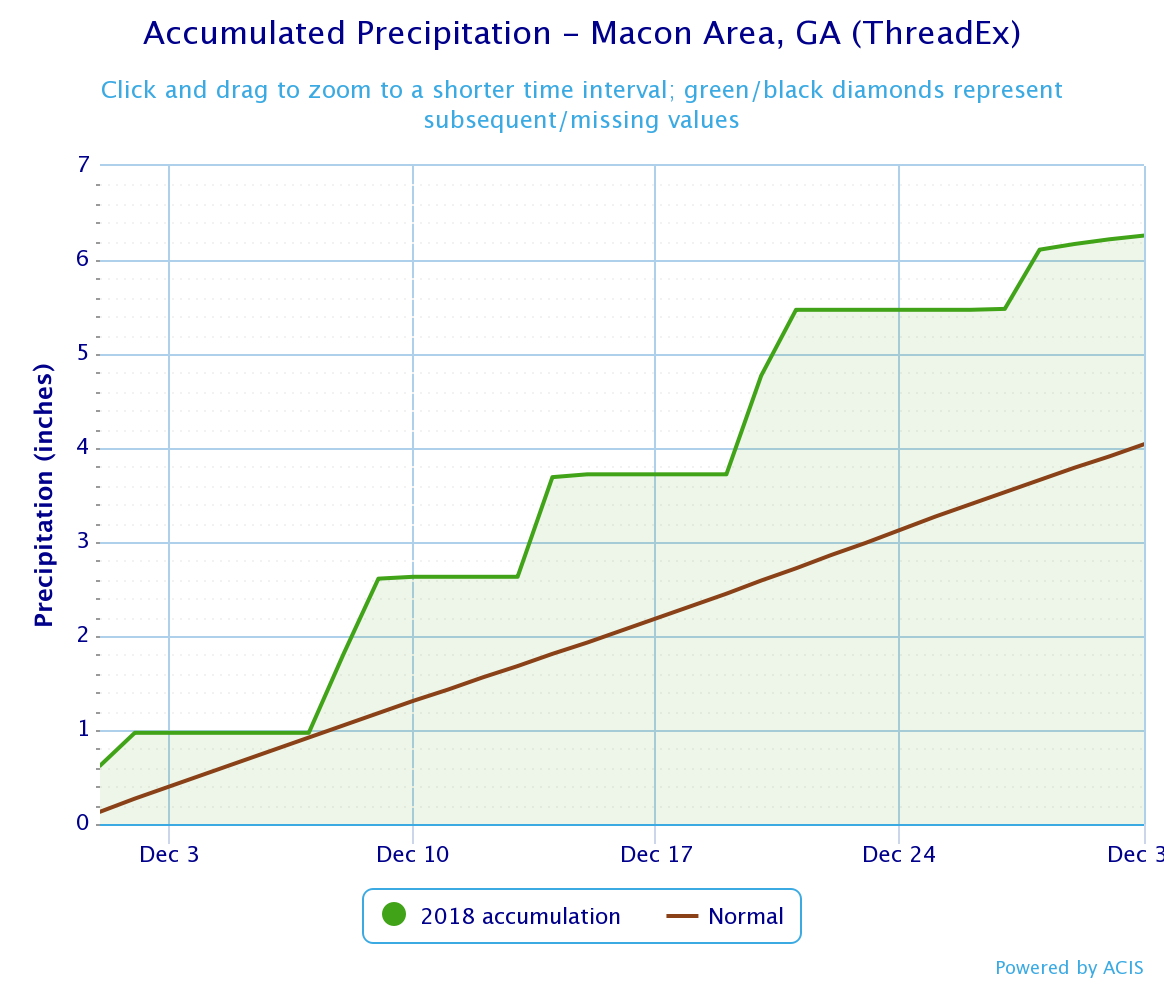
Macon |
1.98 (1/4) |
|
Cartersville |
2.10 (12/8)* |
|
DeKalb Peachtree Arpt |
3.12 (12/28)* |
|
Fulton Co. Arpt |
2.88 (12/28)* |
|
Gainesville |
2.65 (12/28)* |
|
Peachtree City |
2.21 (12/28)* |
|
Rome |
2.61 (12/8)* |
* Set record for day
December 2018 Precipitation Totals (in) and Rankings
* Click on site name below to view a graph with additional data
|
Site |
Total Precip. and Current Ranking |
Normal |
Dep. from Normal |
Record |
|
10.89 (3rd Wettest) |
3.73 |
+7.16 |
12.37 (2015) |
|
|
11.83 (4th Wettest) |
3.90 |
+7.93 |
12.94 (2015) |
|
|
7.93 (16th Wettest) |
4.27 |
+3.66 |
17.38 (2015) |
|
|
6.26 (22nd Wettest) |
4.04 |
+2.22 |
12.62 (2015) |
|
|
Cartersville |
9.73 |
4.24 |
+5.49 |
|
|
DeKalb Peachtree Arpt |
12.02 |
4.16 |
+7.86 |
|
|
Fulton Co. Arpt |
11.14 |
3.99 |
+7.15 |
|
|
Gainesville |
12.24 |
4.50 |
+7.74 |
|
|
Peachtree City |
10.66 |
4.14 |
+6.52 |
|
|
Rome |
10.33 |
4.38 |
+5.95 |
|
January Precipitation Totals (in) and Rankings
* Click on site name below to view a graph with additional data
|
Site |
Total Precip. and Current Ranking |
Normal |
Dep. from Normal |
Records |
|
5.34 (42nd Wettest) |
4.05 |
+1.29 |
12.83 (1936) |
|
|
6.23 (25th Wettest) |
4.20 |
+2.03 |
15.82 (1883) |
|
|
5.65 (29th Wettest) |
3.85 |
+1.80 |
13.76 (1925) |
|
|
6.15 (18th Wettest) |
4.24 |
+1.91 |
13.22 (1925) |
|
|
Cartersville |
4.71 |
4.60 |
+0.11 |
|
|
DeKalb Peachtree Arpt |
5.37 |
4.80 |
+0.57 |
|
|
Fulton Co. Arpt |
5.32 |
4.27 |
+1.05 |
|
|
Gainesville |
5.29 |
5.03 |
+0.26 |
|
|
Peachtree City |
6.40 |
4.20 |
+2.20 |
|
|
Rome |
6.82 |
4.82 |
+2.00 |
|
February Precipitation Totals (in) and Rankings
* Click on site name below to view a graph with additional data
|
Site |
Total Precip. and Current Ranking |
Normal |
Dep. from Normal |
Records |
|
3.61 (46th Driest) |
4.48 |
-0.87 |
0.66 (1898) |
|
| 4.14 (66th Driest) |
4.67 |
-0.53 |
0.56 (1898) |
|
|
1.50 (9th Driest) |
4.44 |
-2.94 |
0.80 (1907) |
|
|
1.37 (7th Driest) |
4.36 |
-2.99 |
0.37 (2000) |
|
|
Cartersville |
7.55 |
4.90 |
+2.65 |
|
|
DeKalb Peachtree Arpt |
5.16 |
5.01 |
+0.15 |
|
|
Fulton Co. Arpt |
5.63 |
4.90 |
+0.73 |
|
|
Gainesville |
7.23 |
4.87 |
+2.36 |
|
|
Peachtree City |
2.36 |
4.90 |
-2.54 |
|
|
Rome |
10.83 |
4.87 |
+5.96 |
|
Precip. Extremes (in) for February
|
Site |
Highest Daily Amount |
|
Athens |
0.86 (2/19) |
|
Atlanta |
1.25 (2/20) |
|
Columbus |
0.45 (2/24) |
|
Macon |
0.30 (2/12) |
|
Cartersville |
1.78 (2/19)* |
|
DeKalb Peachtree Arpt |
1.74 (2/19)* |
|
Fulton Co. Arpt |
1.80 (2/19)* |
|
Gainesville |
1.70 (2/19)* |
|
Peachtree City |
0.68 (2/21) |
|
Rome |
2.04 (2/19)* |
* Set record for day
Records Set this Winter/February
Athens:
Atlanta:
Columbus:
Macon:
March and Spring Outlook
Based on the Climate Prediction Center’s outlook for March, north Georgia has equal chances of above, below, or normal temperatures. Far central Georgia has a 33% to 40% chance of above normal temperatures. All of north and central Georgia has a 50% to 60% of above normal precipitation.
.gif) |
.gif) |
Based on the Climate Prediction Center’s spring outlook (Mar-May), all of north and central Georgia has a 33% to 40% for above normal temperatures. Much of northern Georgia has about a 33% to 40% chance for above normal precipitation, with a 40% to 50% chance for above normal precipitation across central Georgia.
 |
 |
Spring Flood Outlook
The Spring flood risk is above normal for north and central Georgia.
For the spring of 2019, the Southeast River Forecast Center is calling for an above normal river flood potential for north and central Georgia. Given that spring is a characteristically active period for river flooding, this outlook indicates that north and central Georgia can expect to see the number and magnitude of river floods to be higher than typical.
For more information, please refer to our ESF.
The National Climate Report for February 2019 contains data on a wider scale. For more information, click here.
Data prepared by the Atlanta Forecast Office.

