| Previous Month | Next Month |
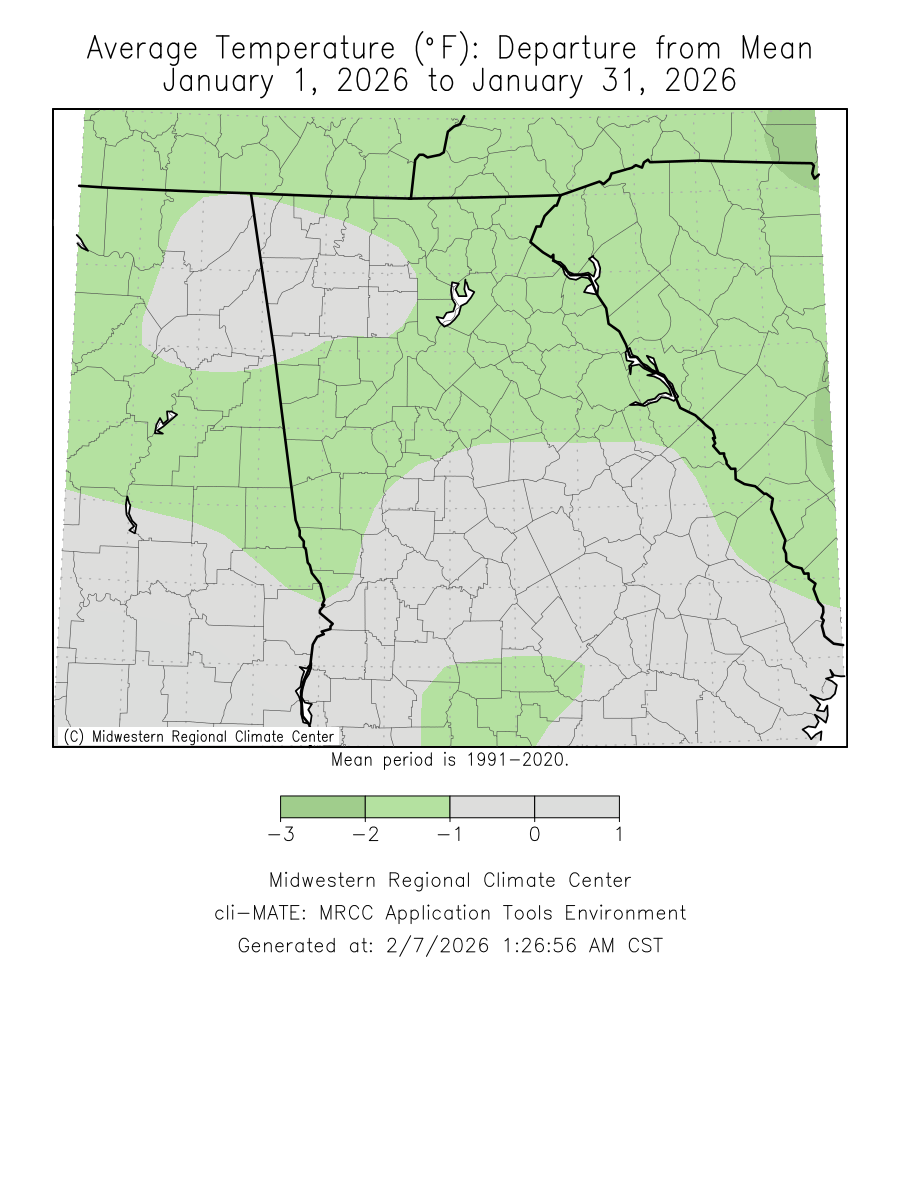
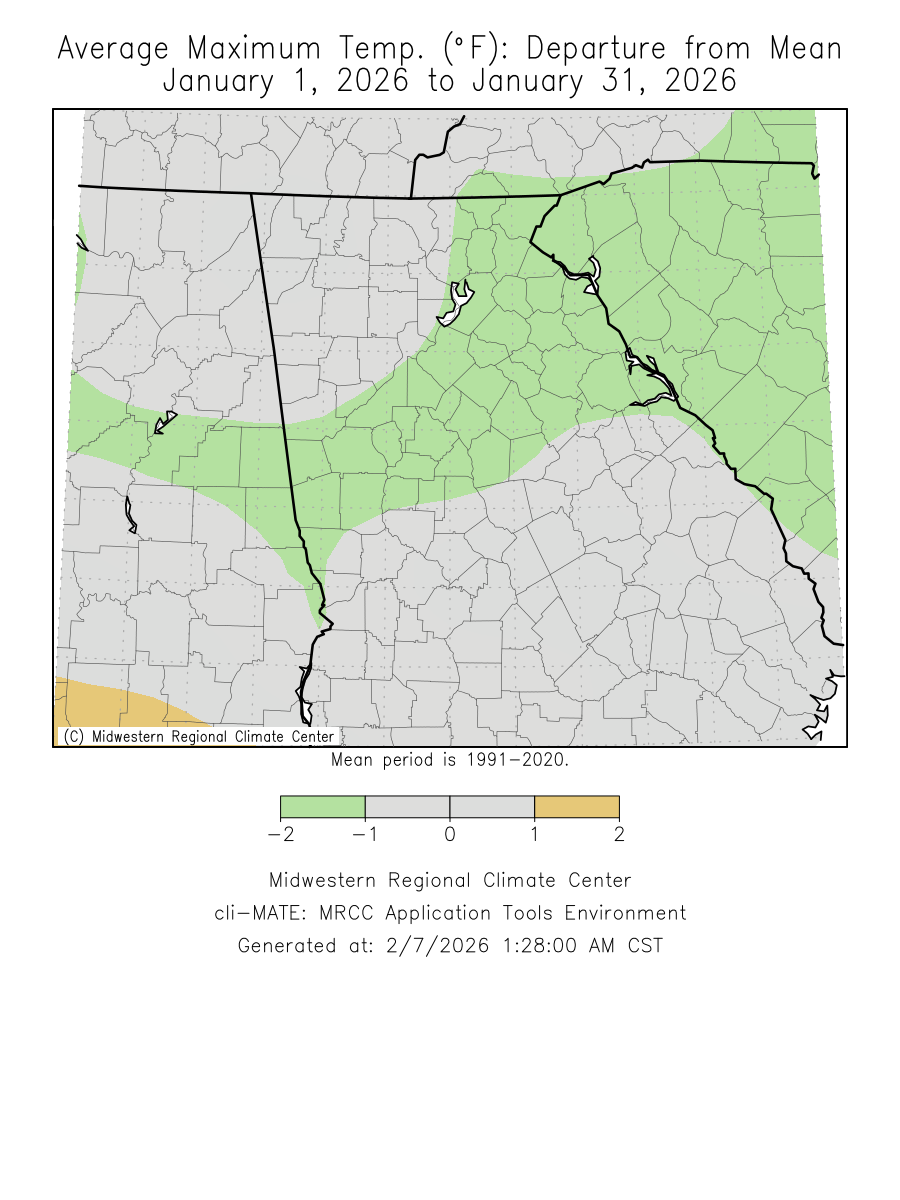
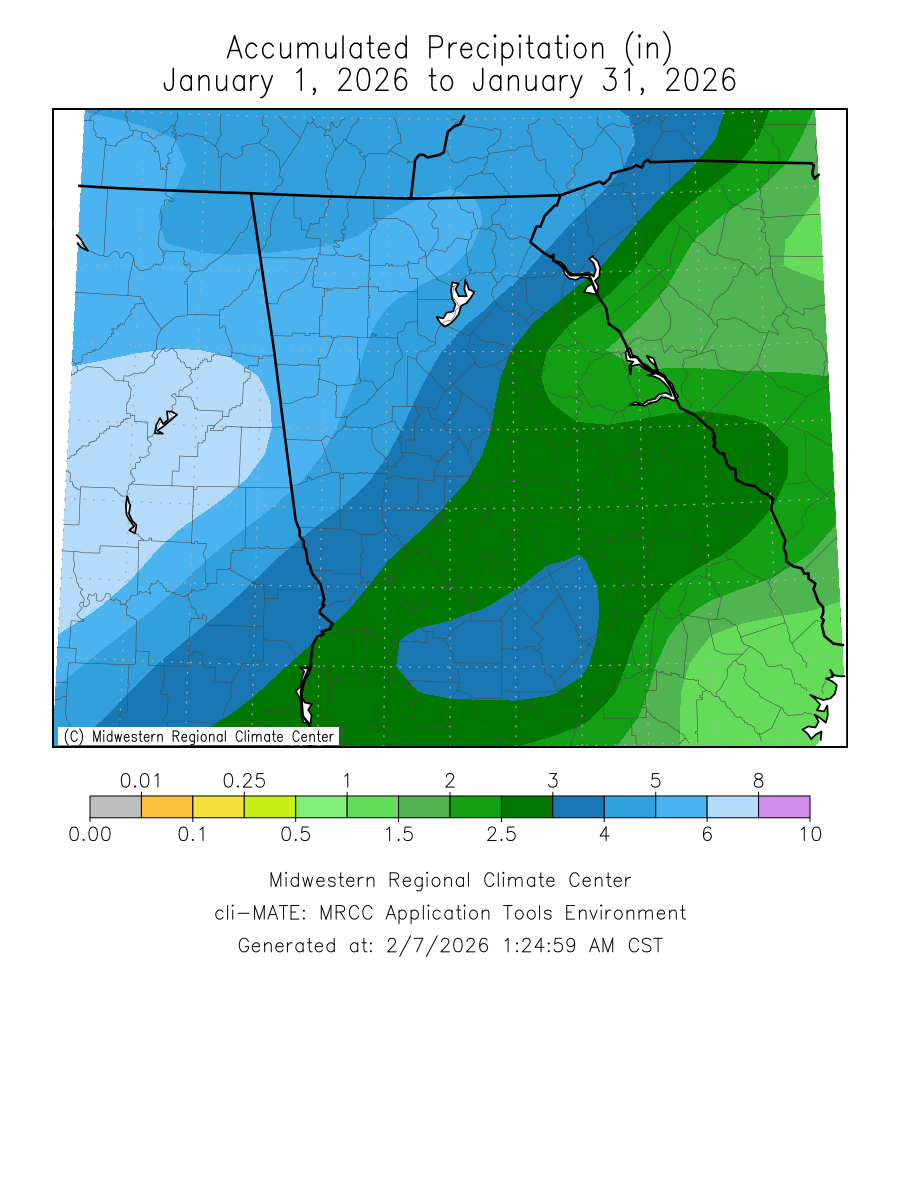
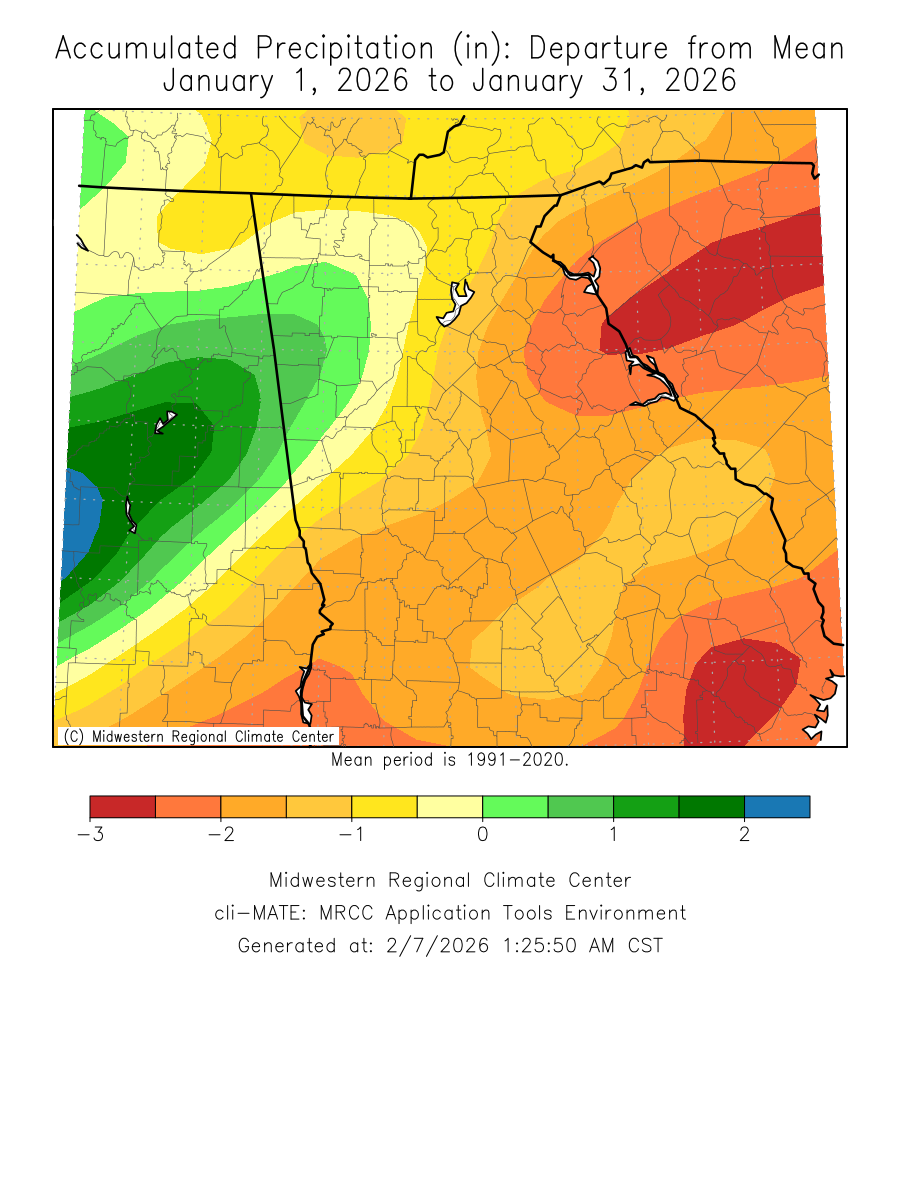
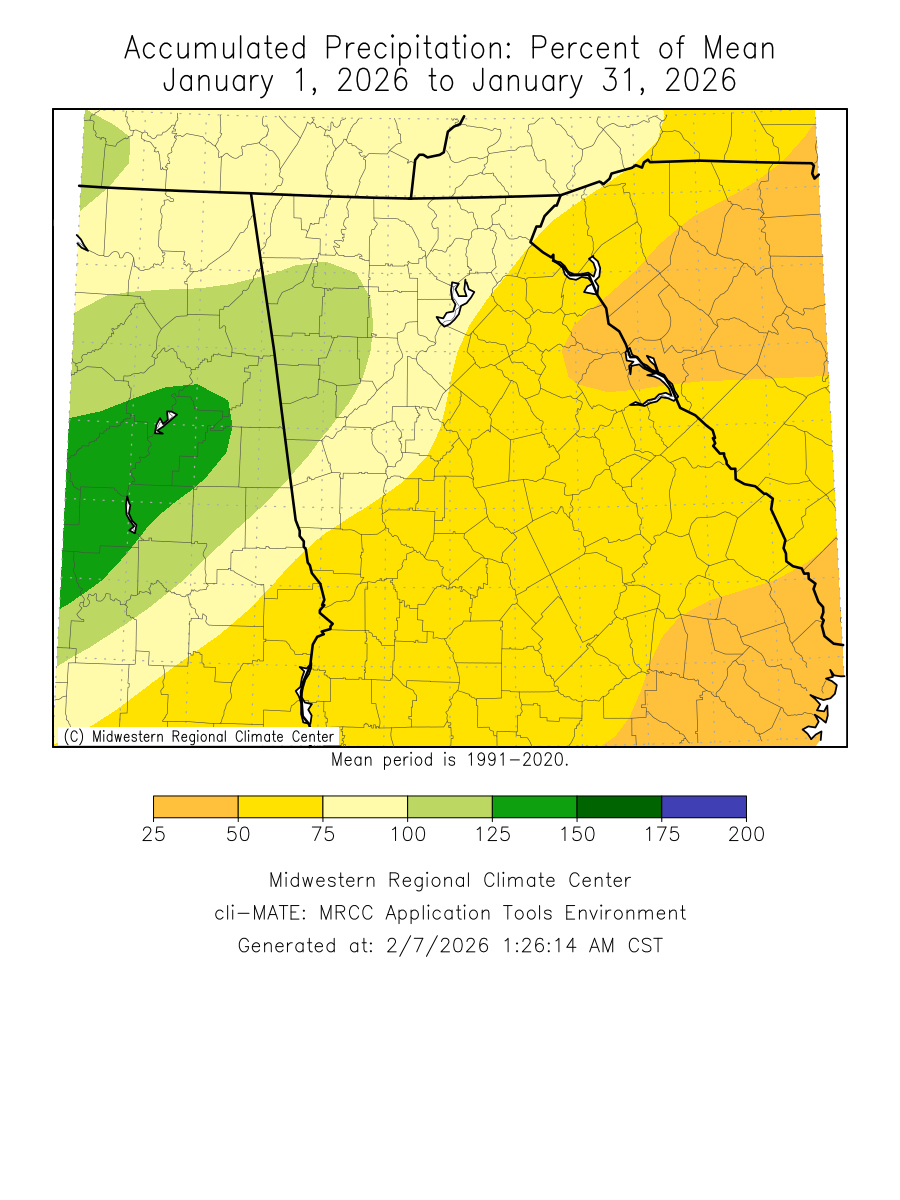
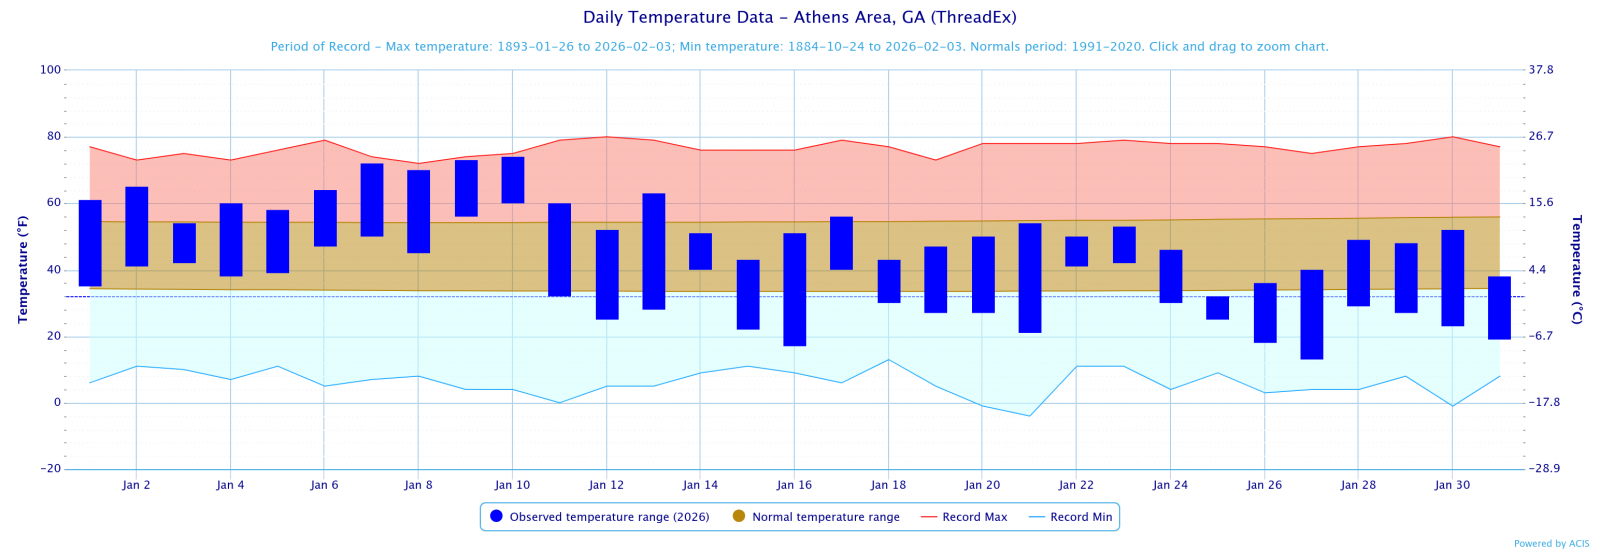
Temperatures through the month of January was around normal. Precipitation through the month of January was an inch and a half below normal.
Climate Site Maximum Temperature Max T Date Climate Site Total Precipitation DFN (Departure Climate Site Maximum Daily Precip (in inches) Max P Date Data prepared by NWS Peachtree City/Atlanta More information coming soon on the Snow and Ice Storms that took place in January 2026 Based on the Climate Prediction Center's outlook for February, north and central Georgia has a 40%-50% chance of below normal temperatures. North and central Georgia has a 33-40% below normal precipitation. Data prepared by NWS Peachtree City/Atlanta.
Overview
Climate Graphs
Records
Events
February Outlook
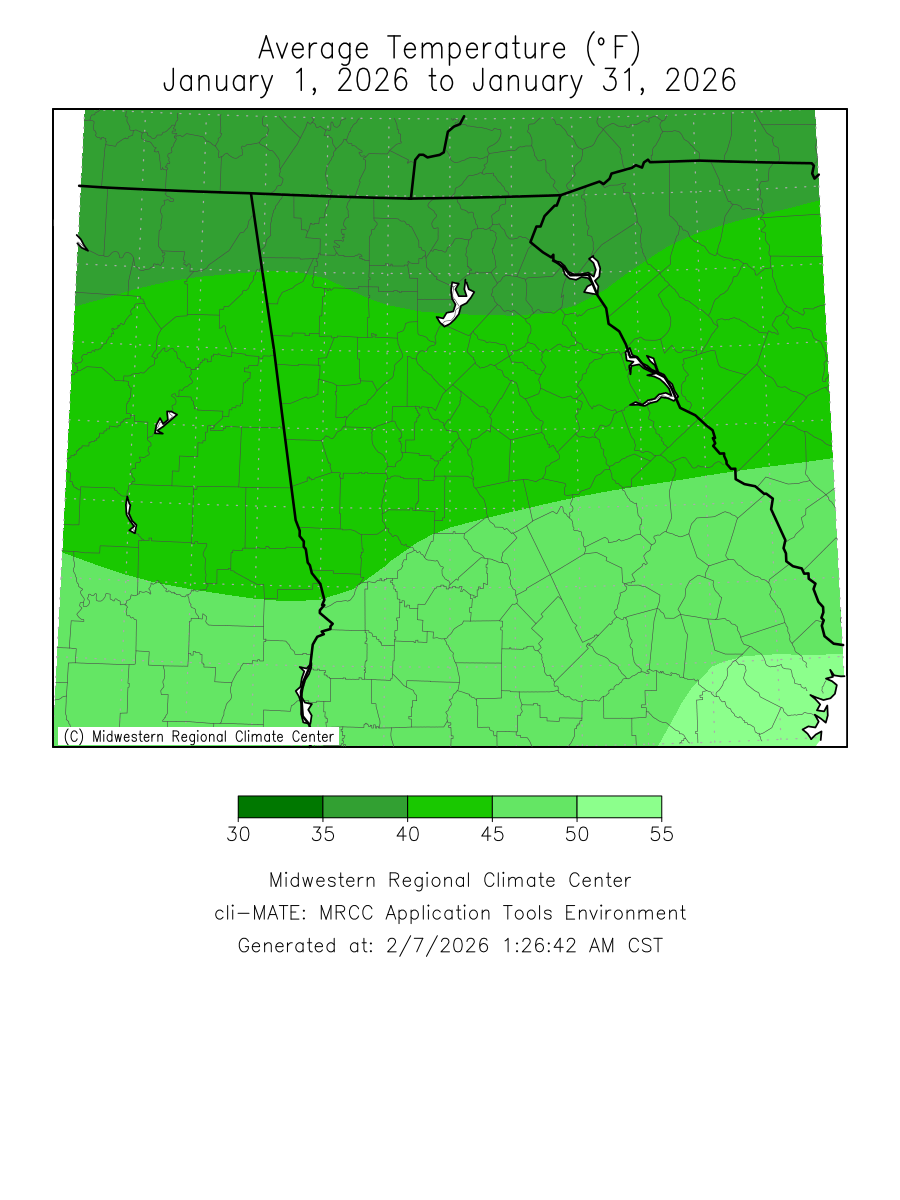
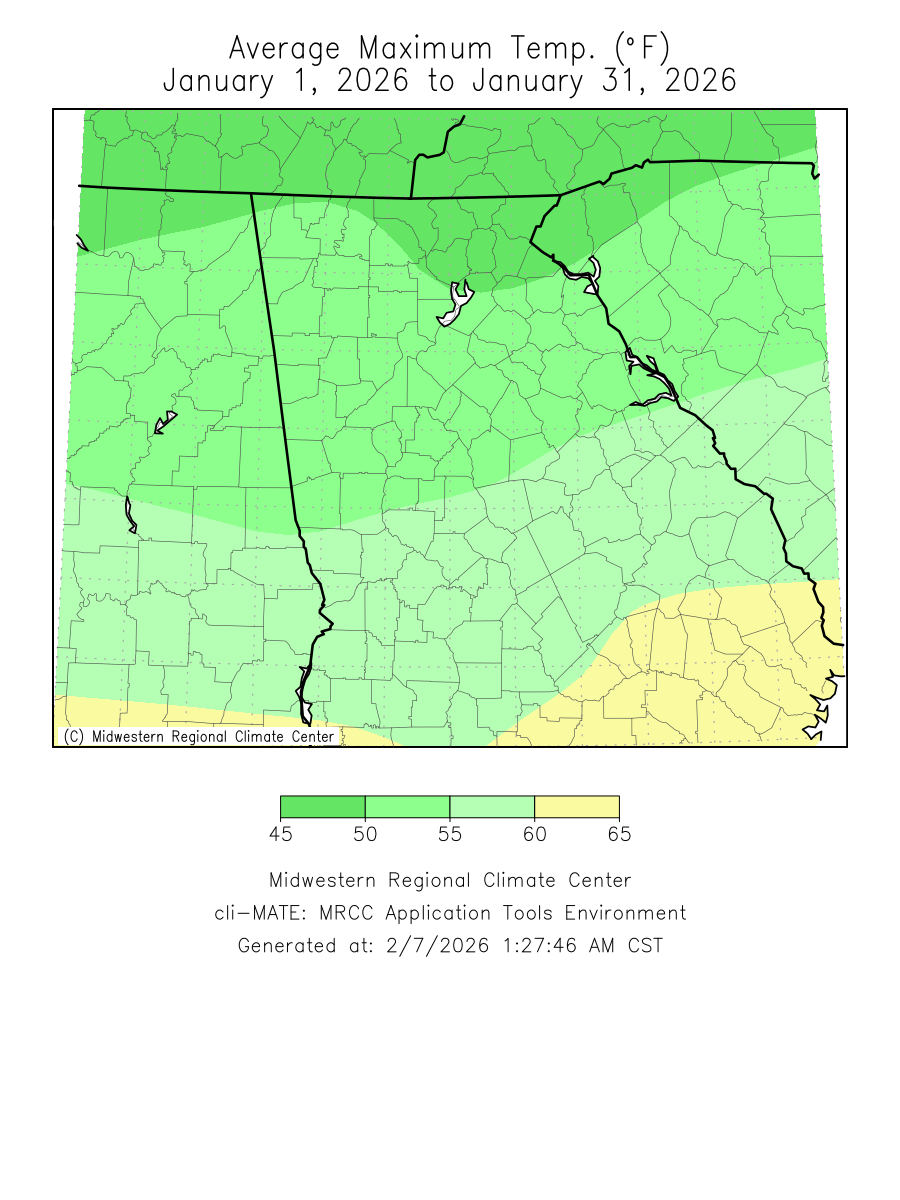
January 2026 Climate Averages
Climate Site
Jan Temp (°F)
Average Temp
Departure from Normal
Athens
43.5
44.3
-0.8
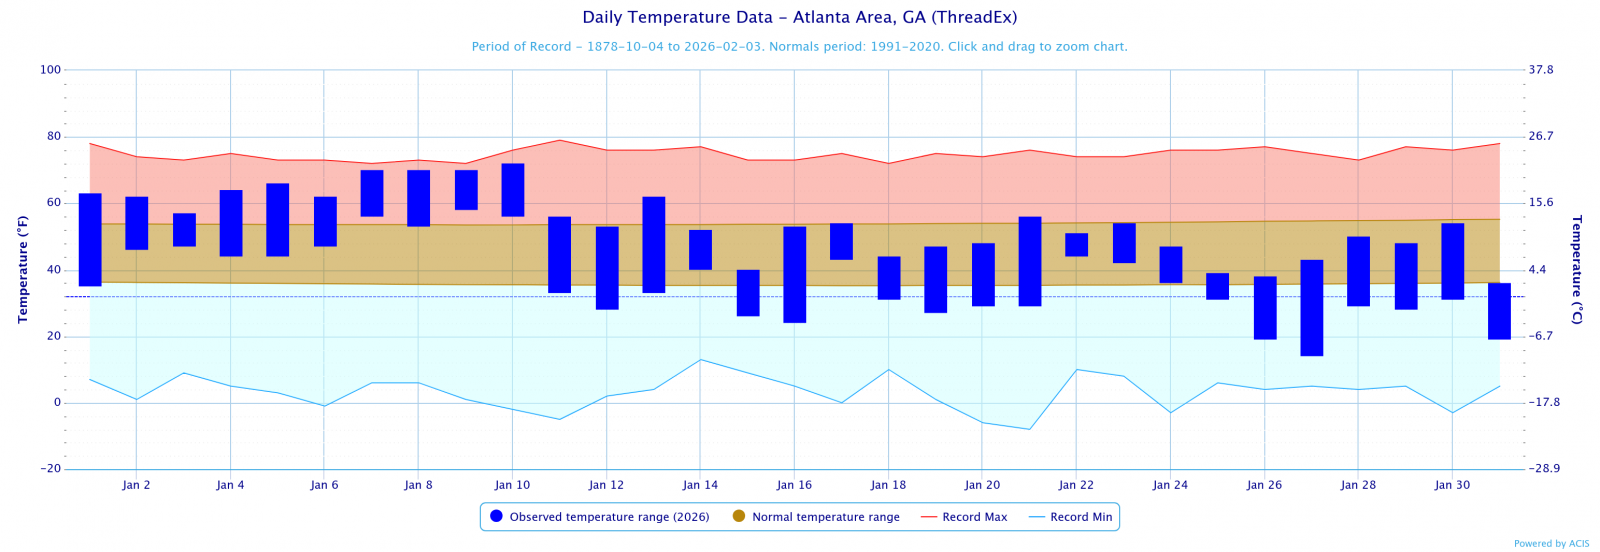
Atlanta
45.2
44.8
0.4
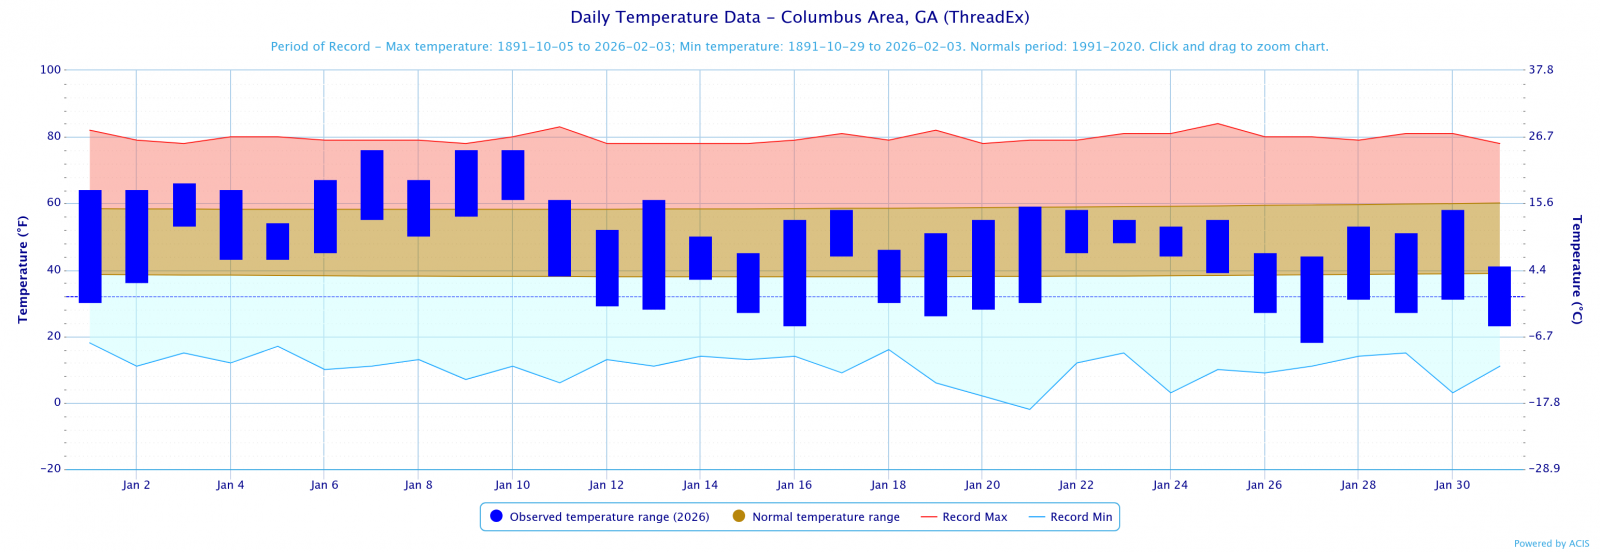
Columbus
47.2
48.5
-1.3
Macon
46.2
47.6
-1.4
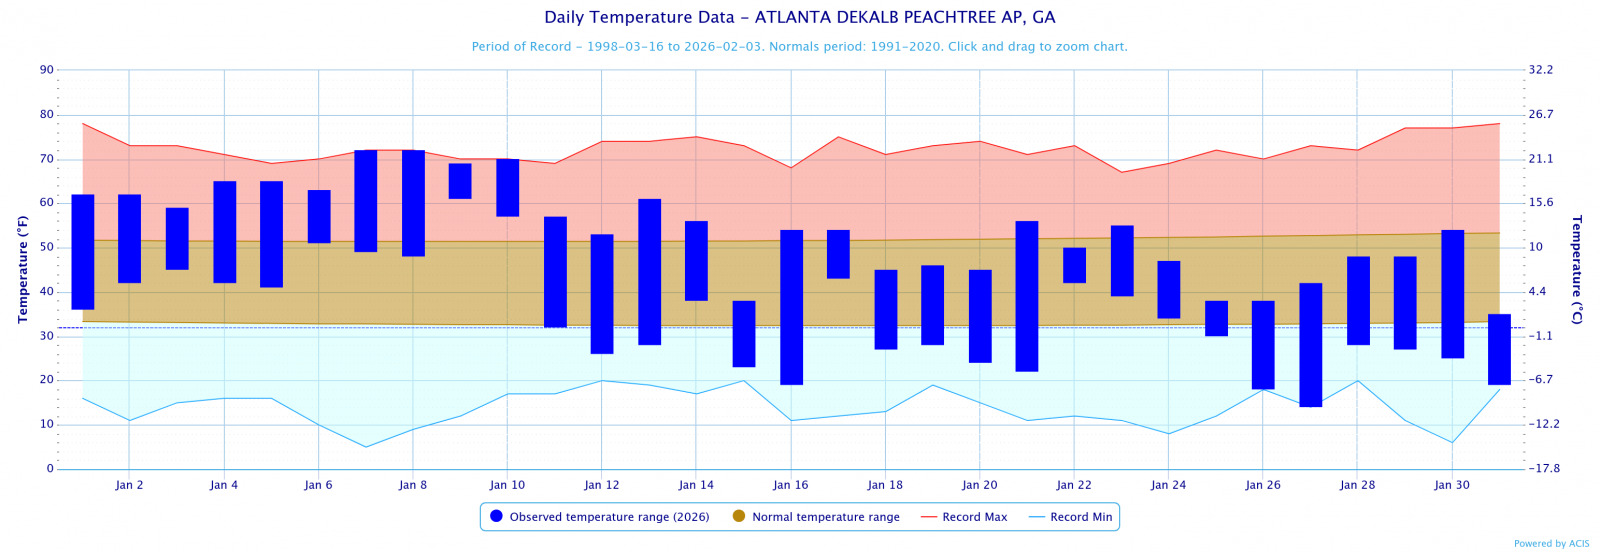
Dekalb Peachtree Arpt
44.1
42.3
1.8
Fulton Co Arpt
44.0
43.6
0.4
Gainesville
42.2
42.4
-0.2
Peachtree City
43.2
44.9
-1.7
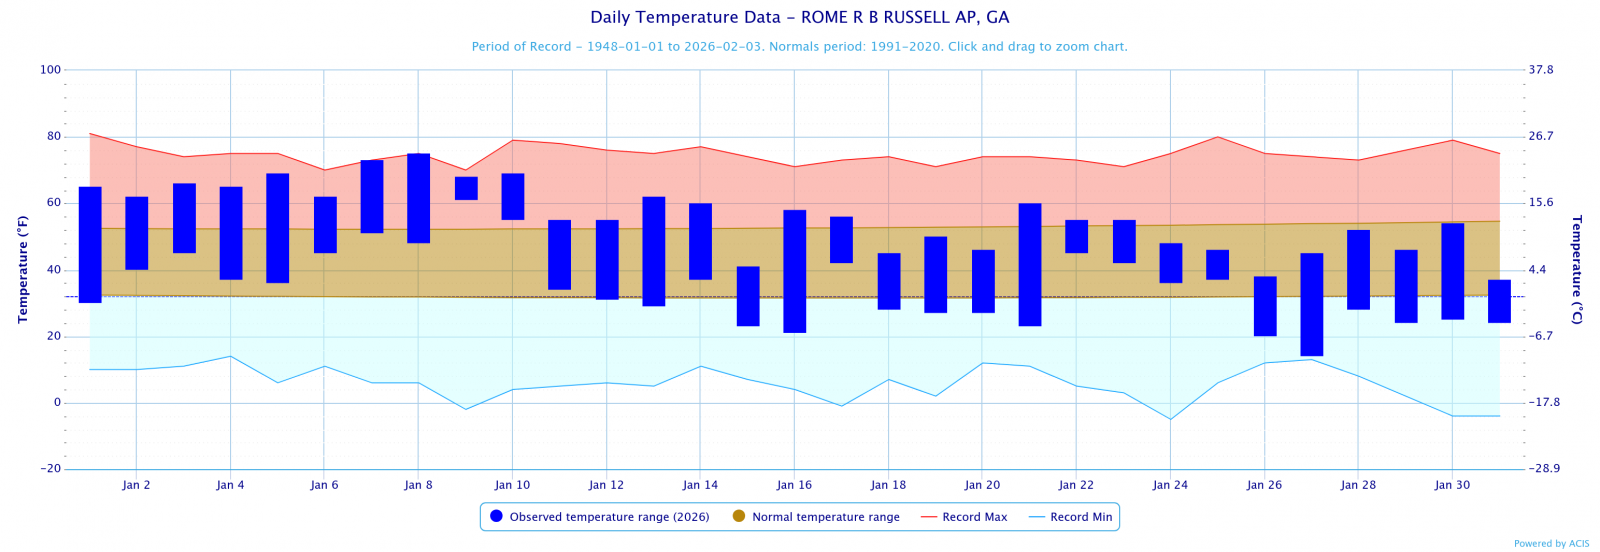
Rome
45.2
42.3
2.9
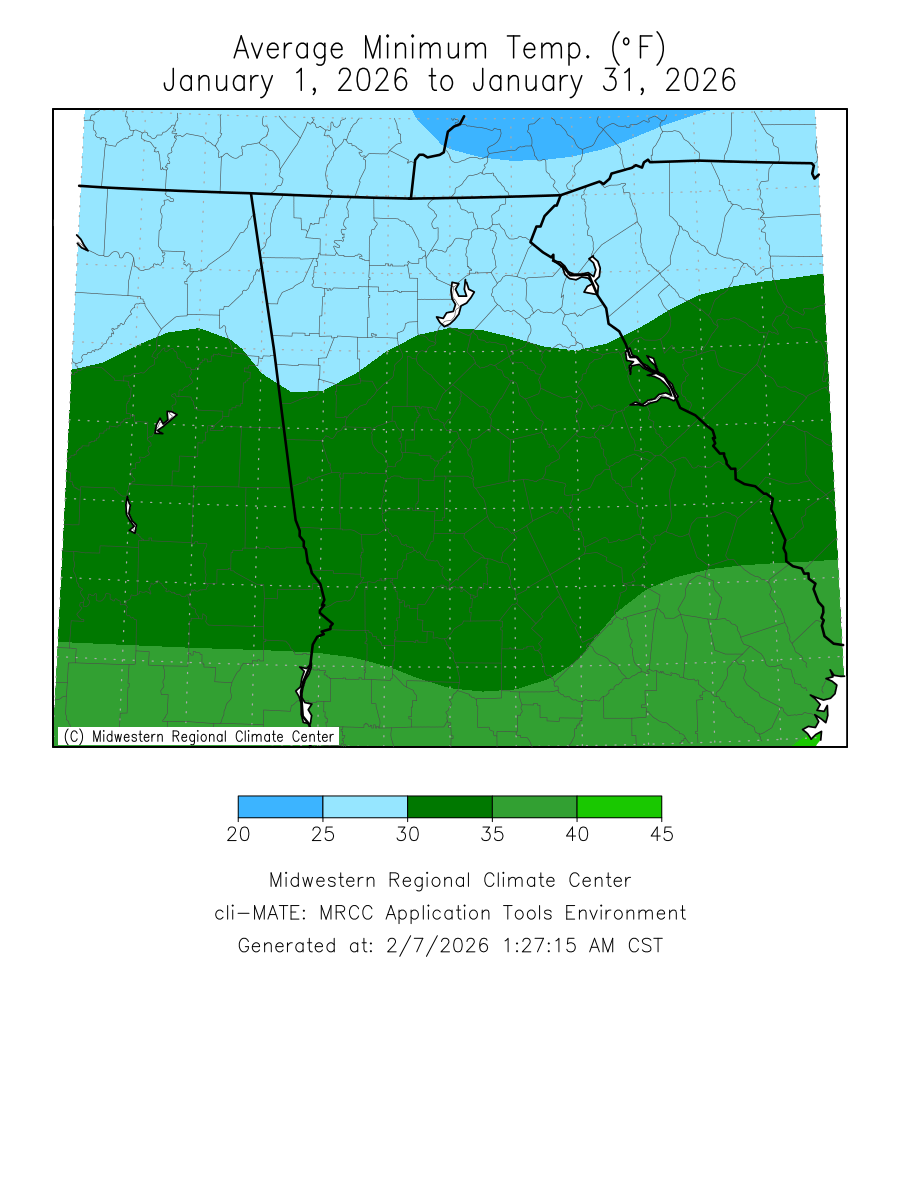
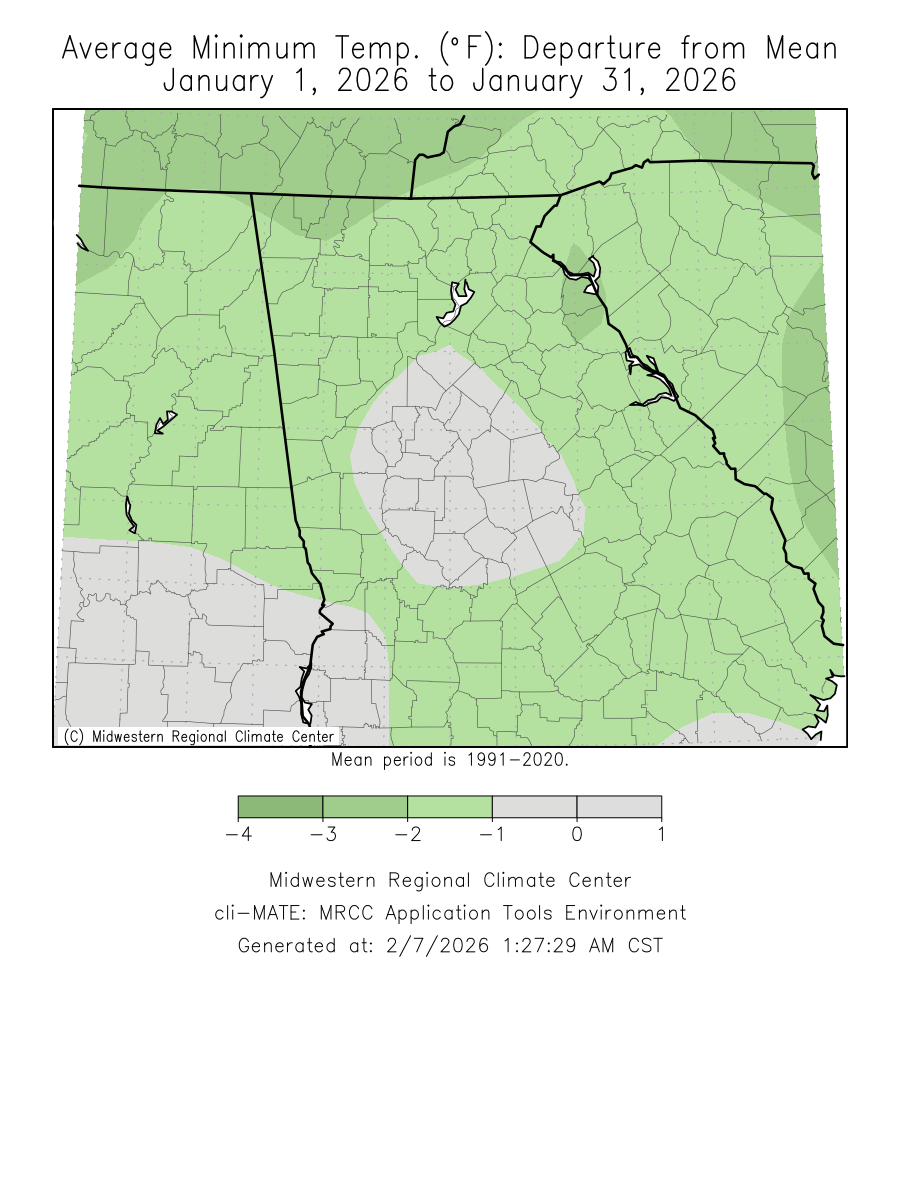
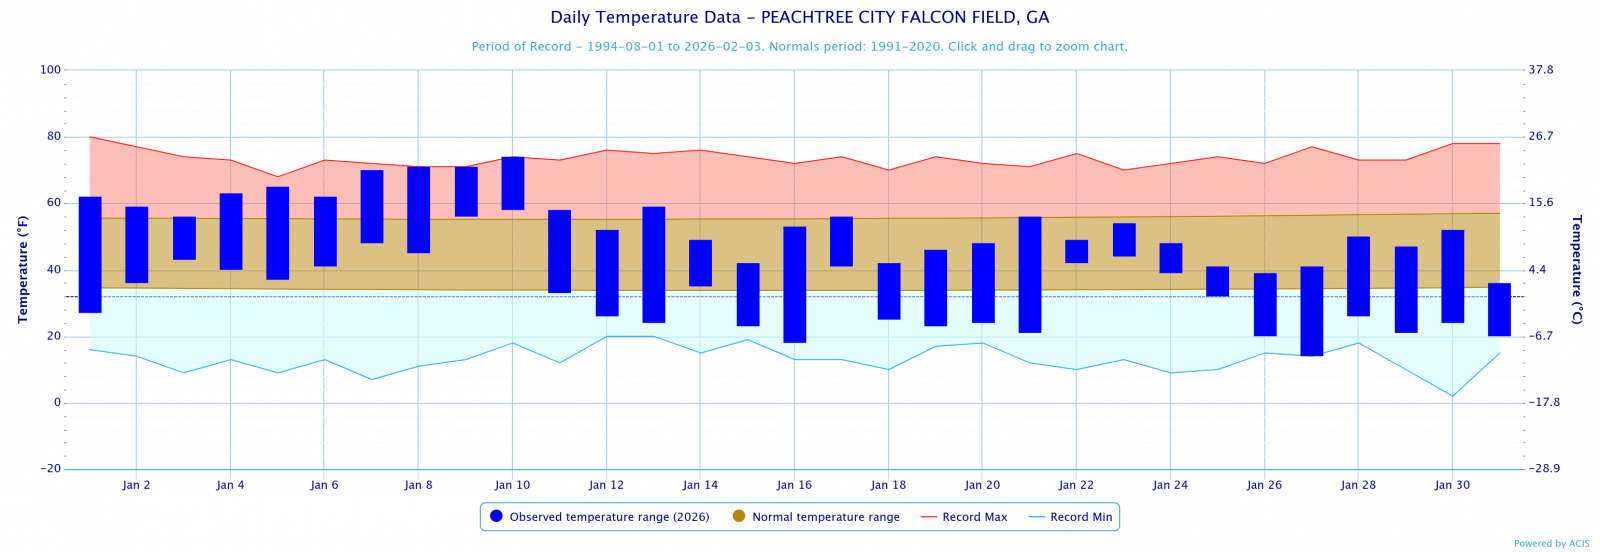
January 2026 Temperature Climate Statistics
Minimum Temperature
Min T Date
Athens
74
1/10
13
1/27
Atlanta
72
1/10
14
1/27
Columbus
76
1/9, 10
18
1/27
Macon
80
1/10
15
1/27
Dekalb Peachtree Arpt
72
1/8
14
1/27
Fulton Co Arpt
71
1/10
13
1/27
Gainesville
69
1/7
12
1/27
Peachtree City
74
1/10
14
1/27
Rome
75
1/8
14
1/27
January 2026 Precipitation Climate Statistics
Average Precipitation
From Normal)
Athens
1.90
4.36
-2.46
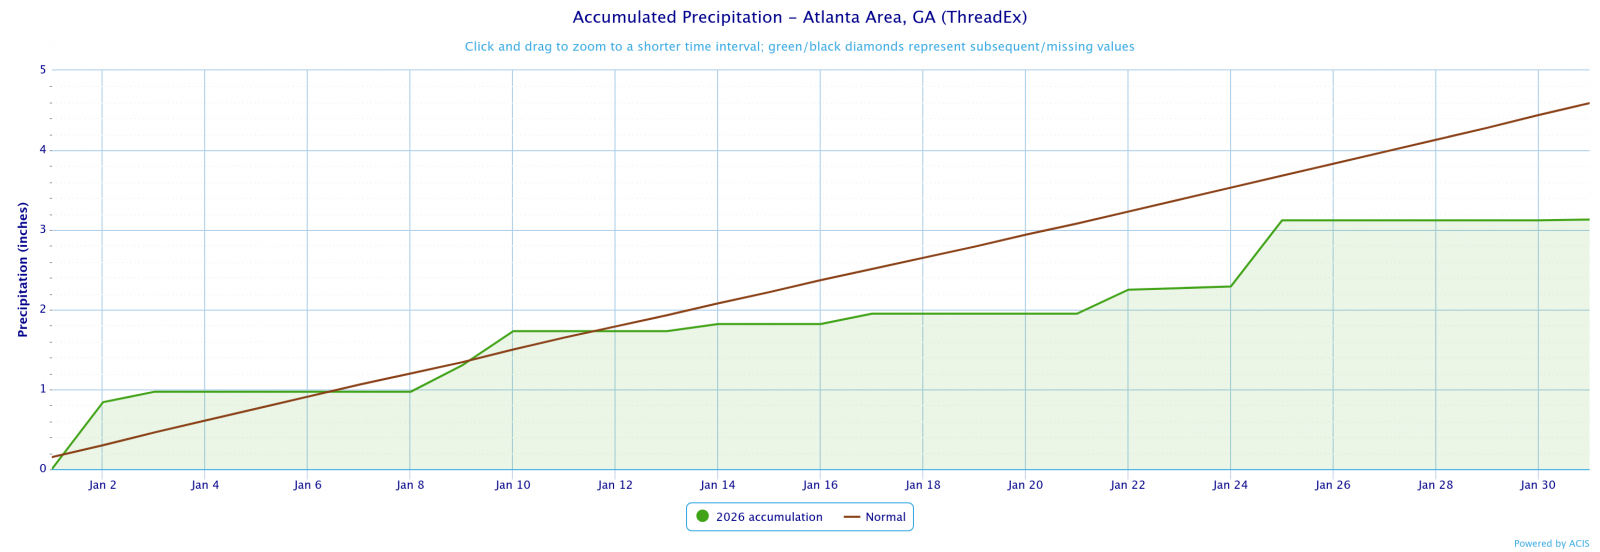
Atlanta
3.13
4.56
-1.46
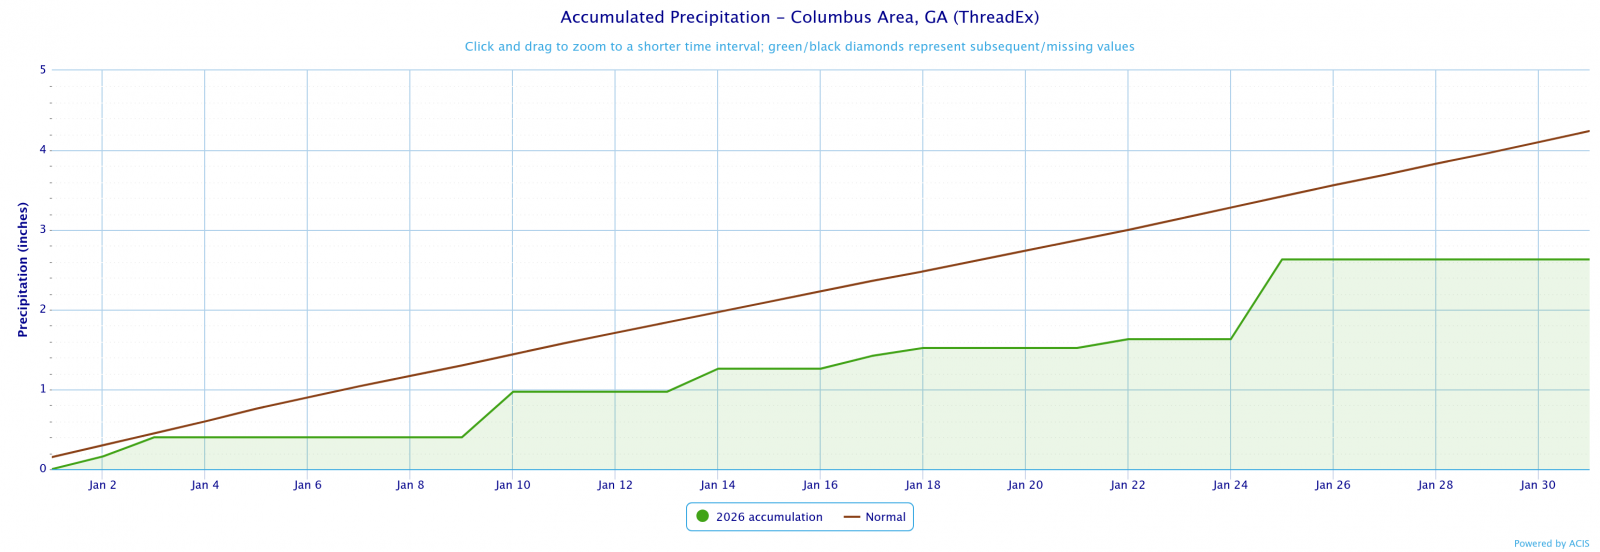
Columbus
2.63
4.24
-1.61
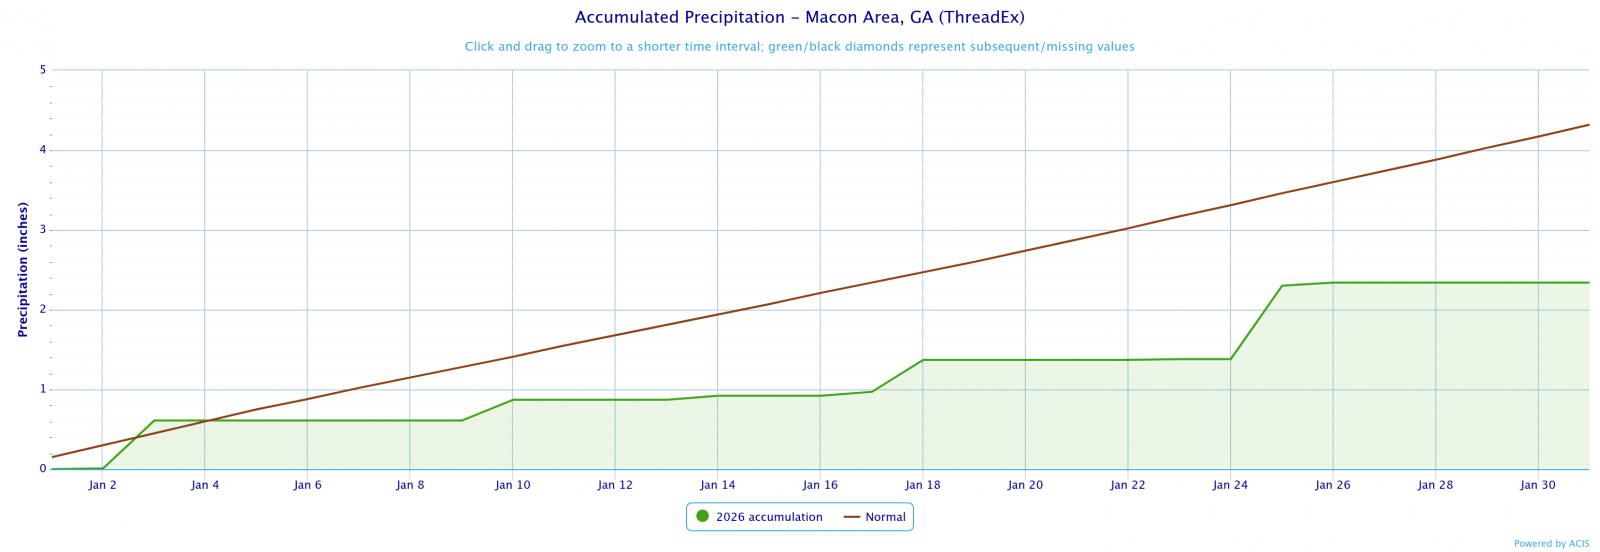
Macon
2.34
4.32
-1.98
Dekalb Peachtree Arpt
2.93
4.57
-1.64
Fulton County Arpt
2.46
4.25
-1.79
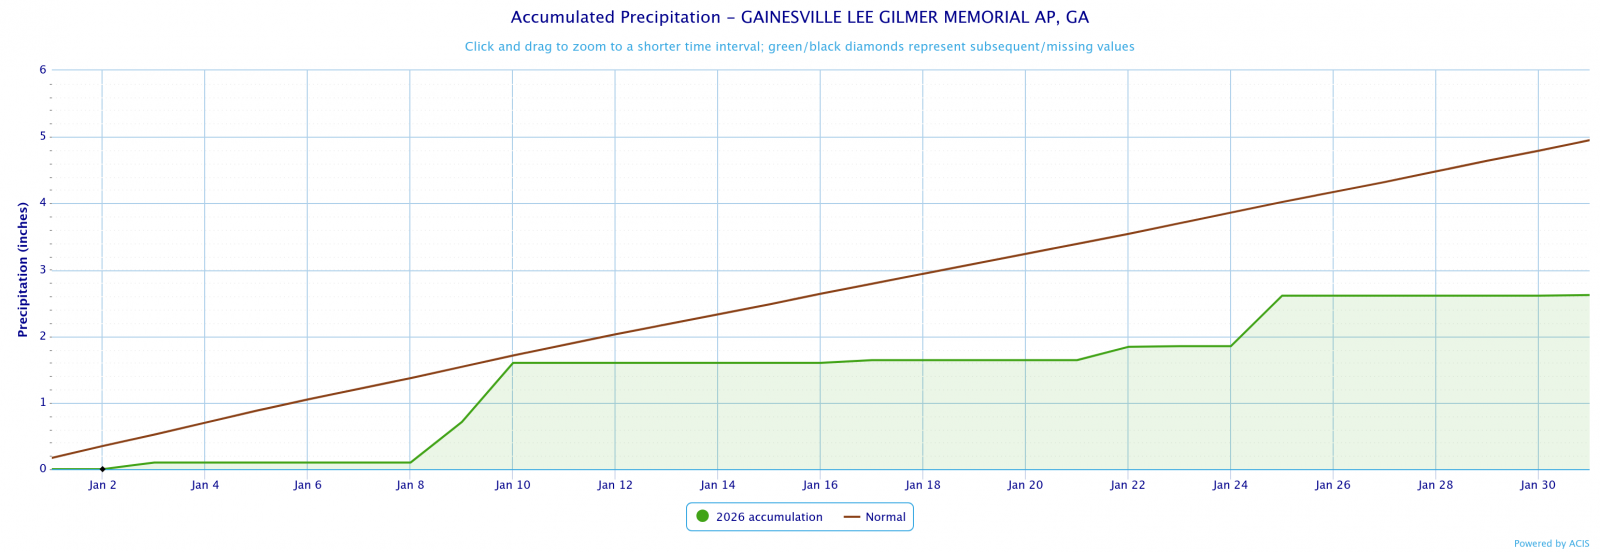
Gainesville
2.62
4.95
-2.33
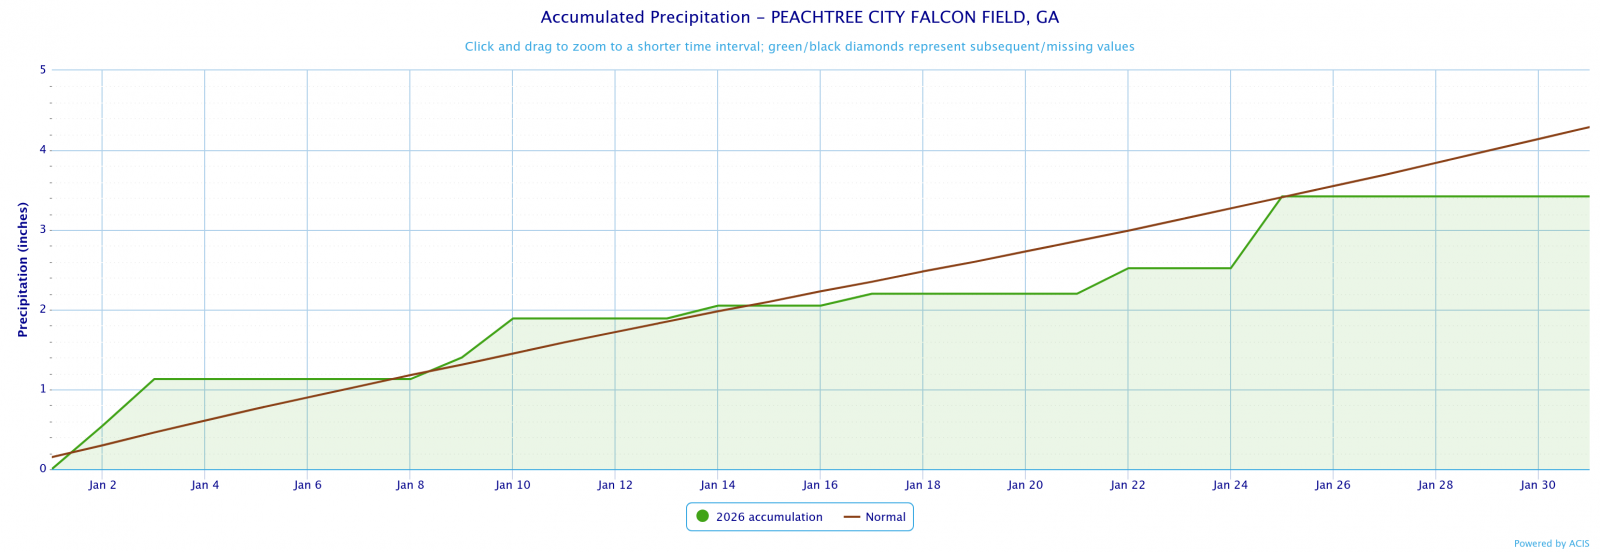
Peachtree City
3.42
4.29
-0.87
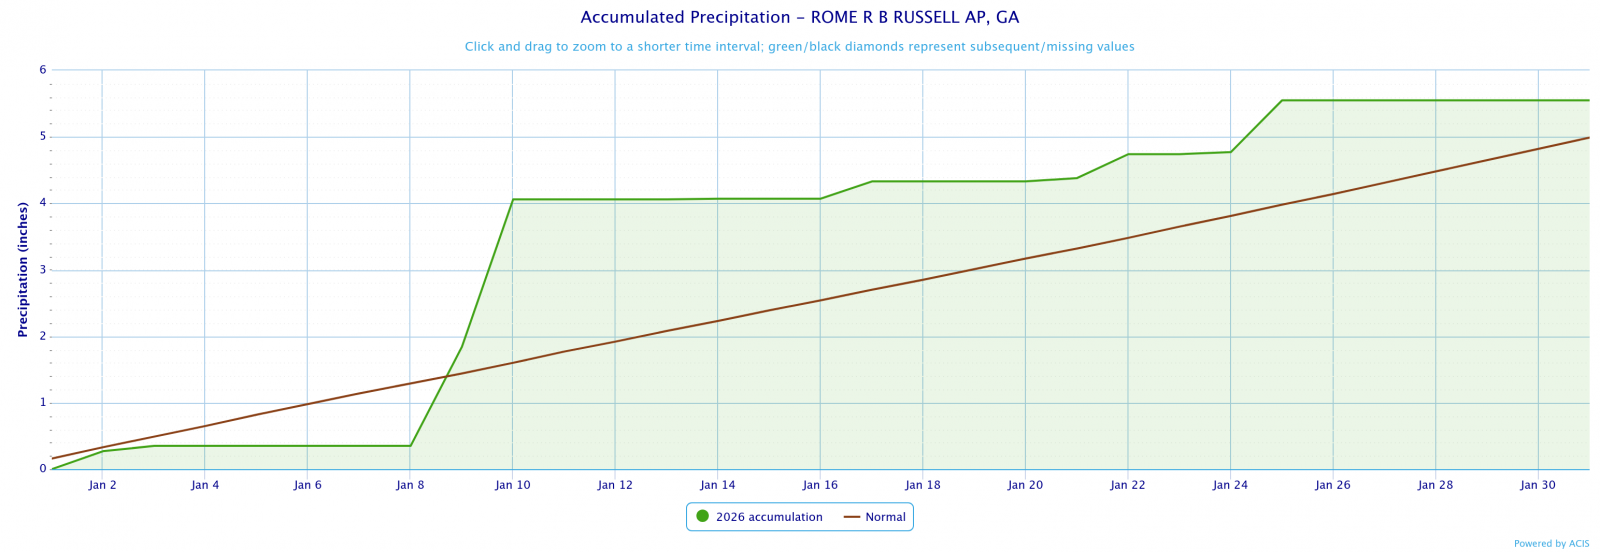
Rome
5.55
4.99
0.56
January 2026 Precipitation Climate Statistics
Athens
1.85
1/9
Atlanta
0.84
1/2
Columbus
1.08
1/2
Macon
1.00
1/25
Dekalb Peachtree Arpt
1.00
1/25
Fulton Co Arpt
1.33
1/9
Gainesville
1.07
1/9
Peachtree City
1.70
1/9
Rome
2.22
1/10
Click the links below to explore the temperature and precipitation data across north and central Georgia for the month of January 2024.
Temperature Maps
Precipitation Maps
Temperature Graphs
Precipitation Graphs


Temperature and precipitation records at our 4 main climate sites are located below.
January 2026 Climate Records
Date
Type
Location
Records set over a 24 hour period
1/18
Snow
Columbus
A record 24 hour snowfall total was set at 1.50".
1/18
Snow
Macon
A record 24 hour snowfall total was set at 1.60".
1/22
Min T
Macon
Macon fell to 12°F which breaks the record of 13°F in 1985
Larger events that occurred across north and central Georgia this past January can be found here.
The February climate outlook is below.
February Outlook