| Previous Month | Next Month |
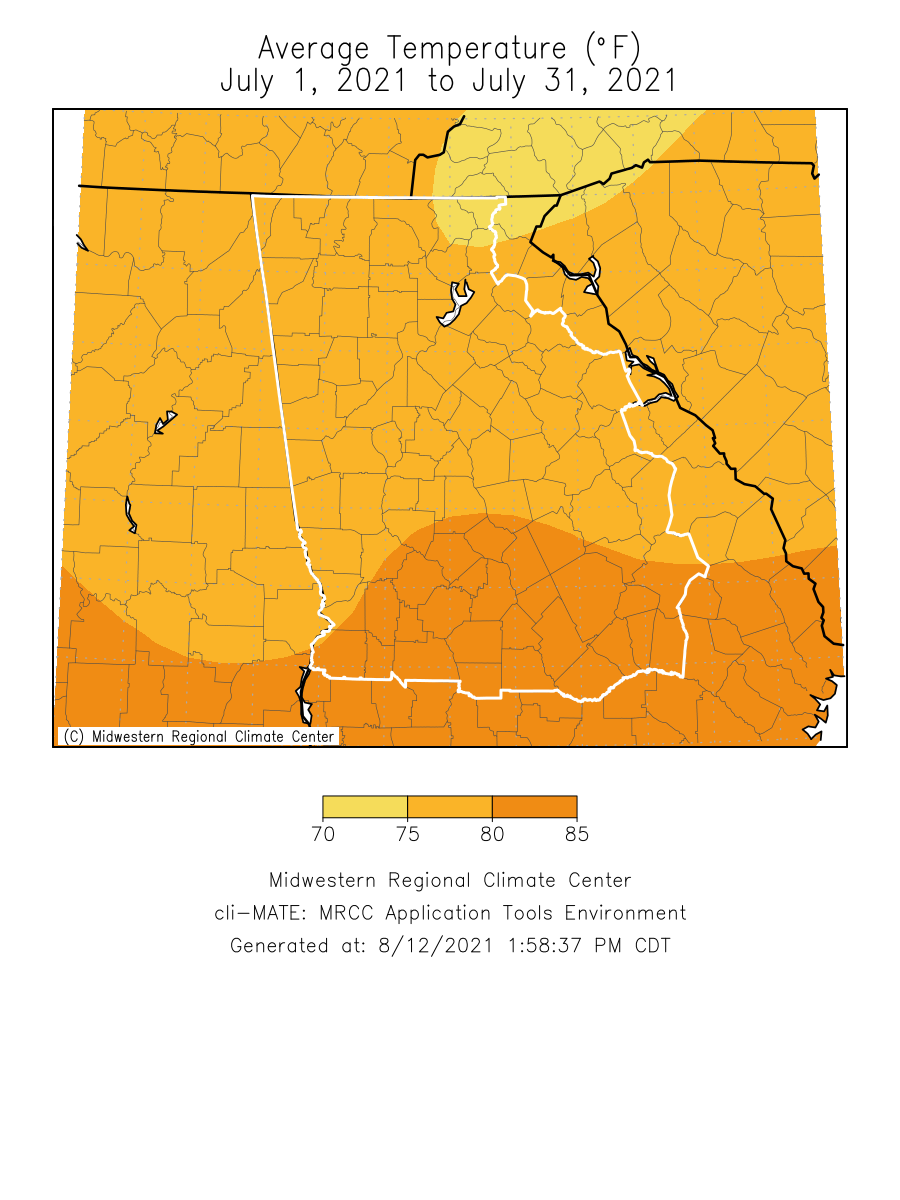
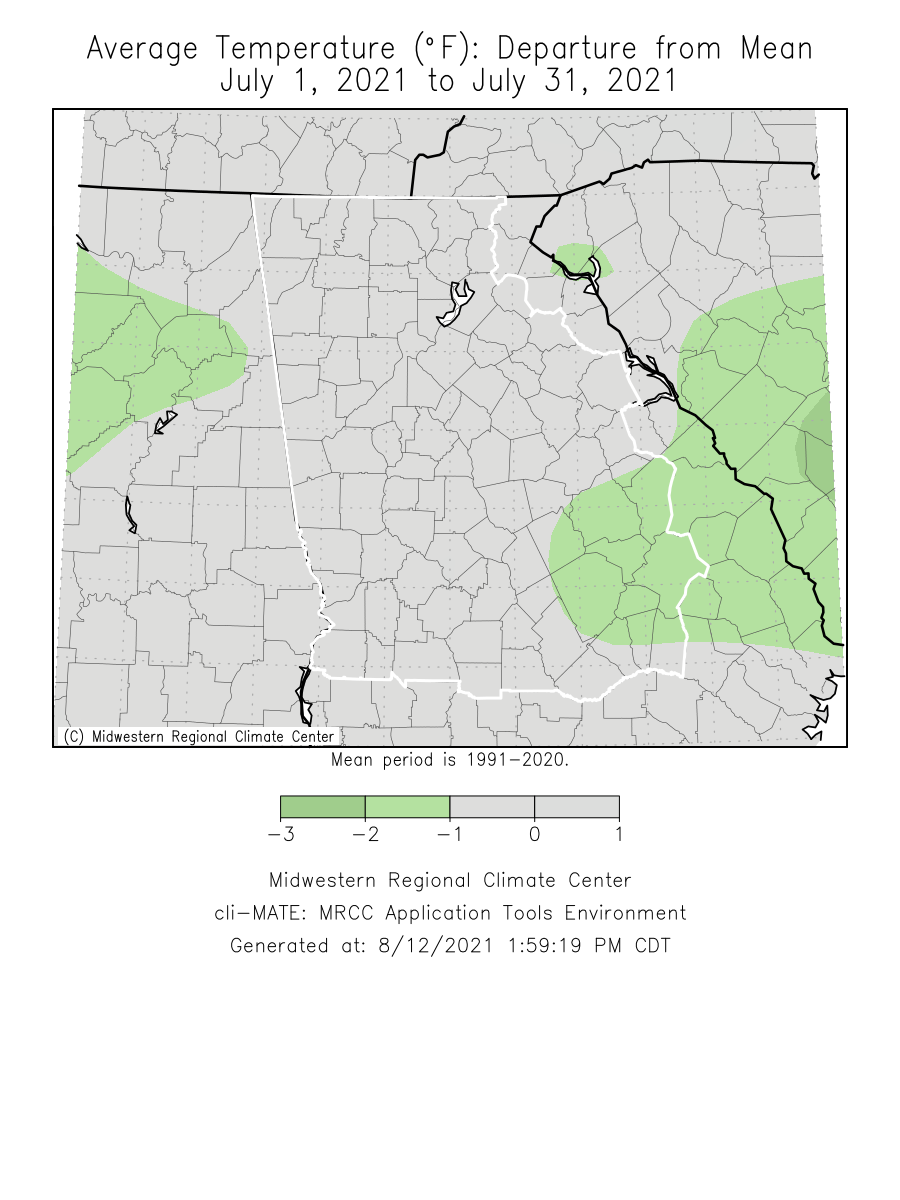
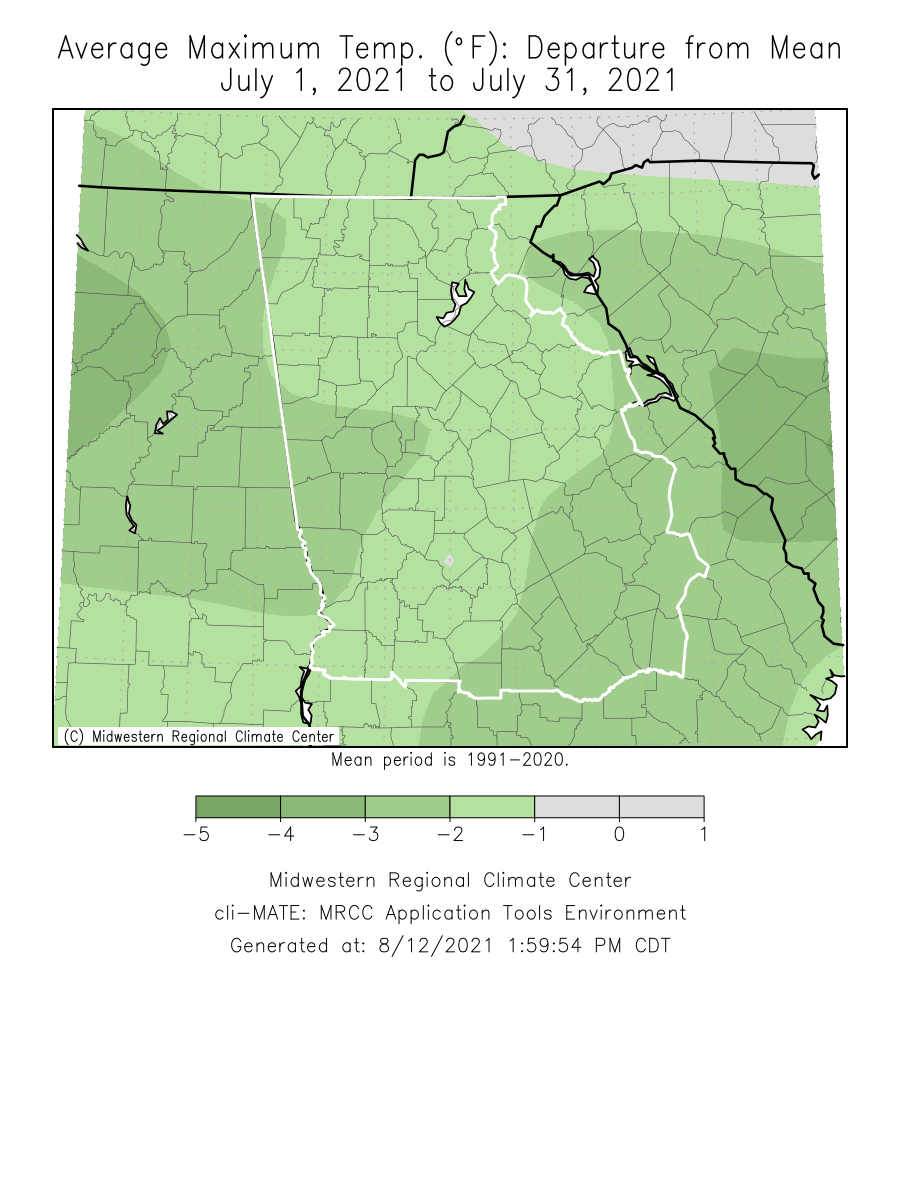
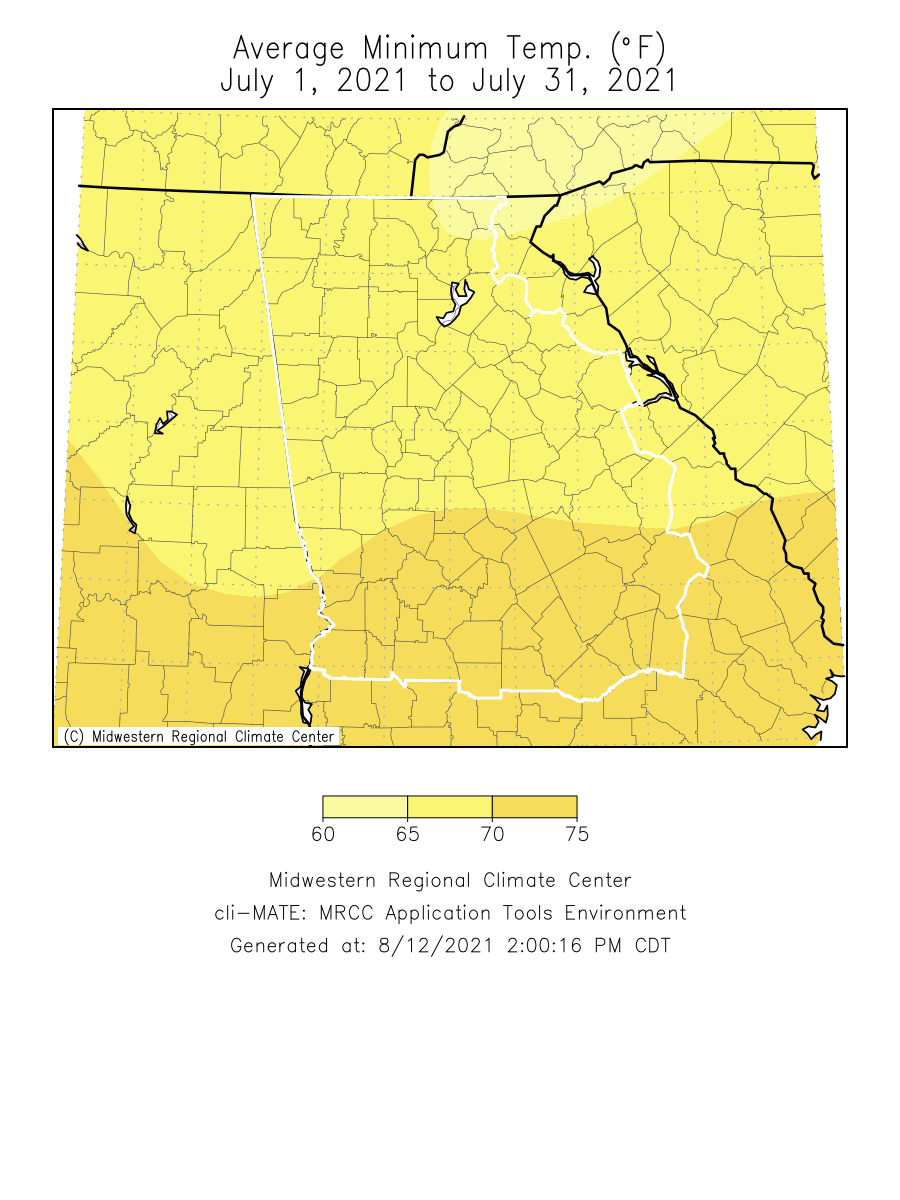
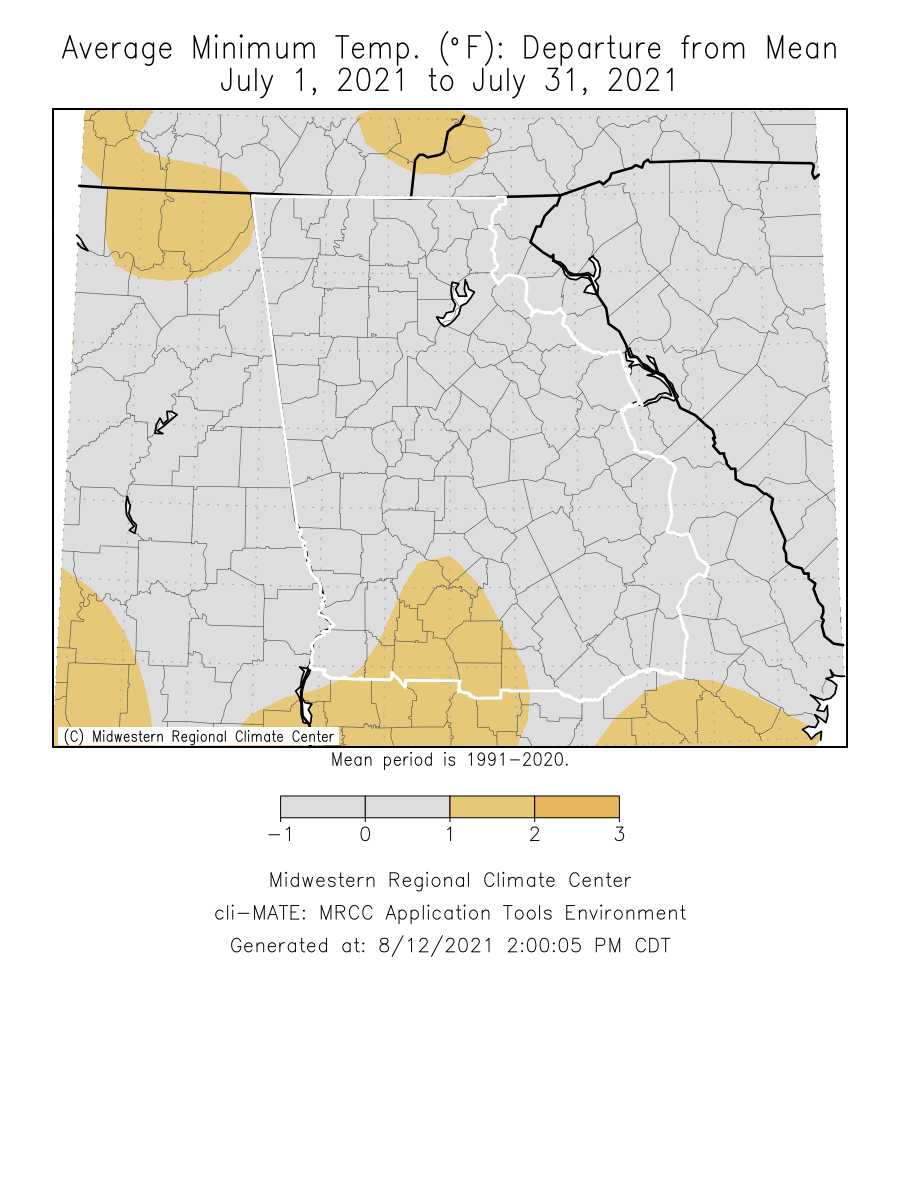
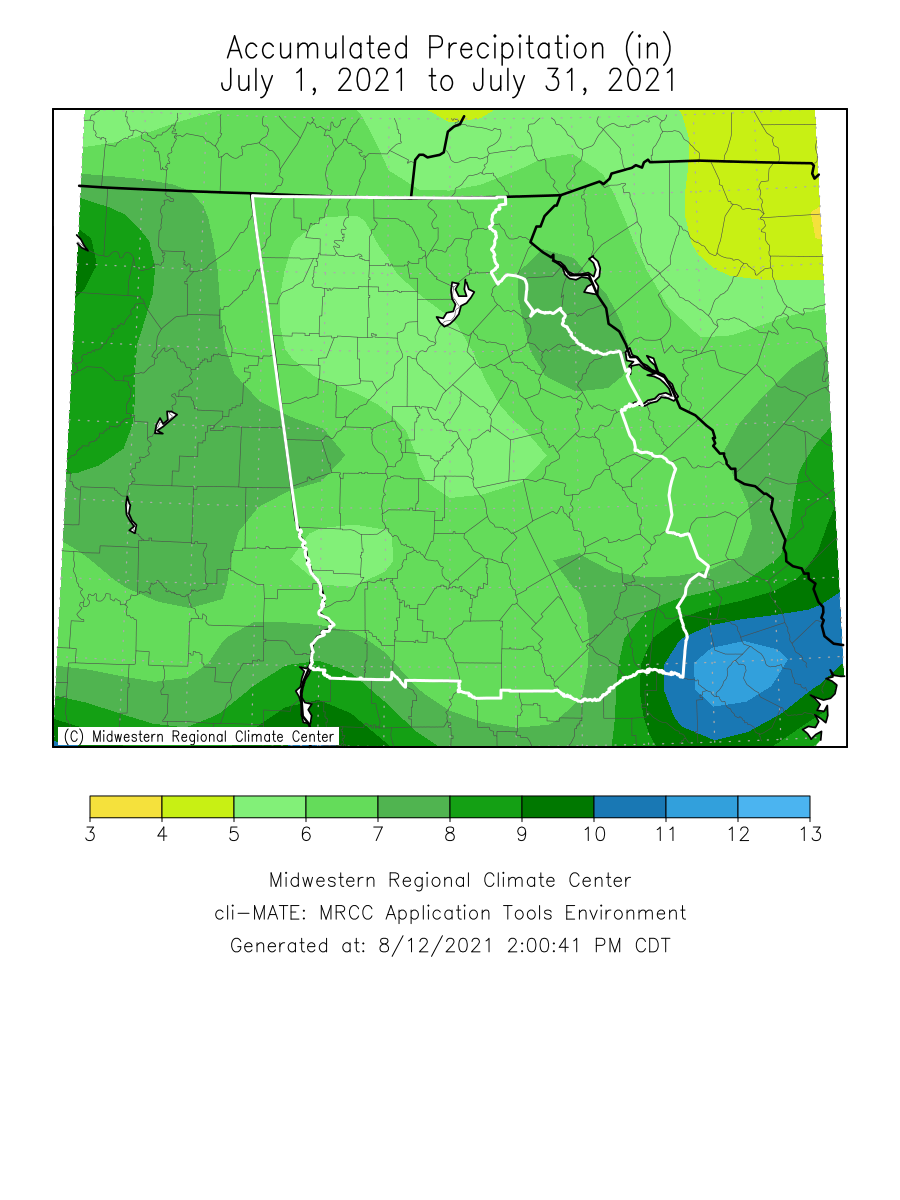
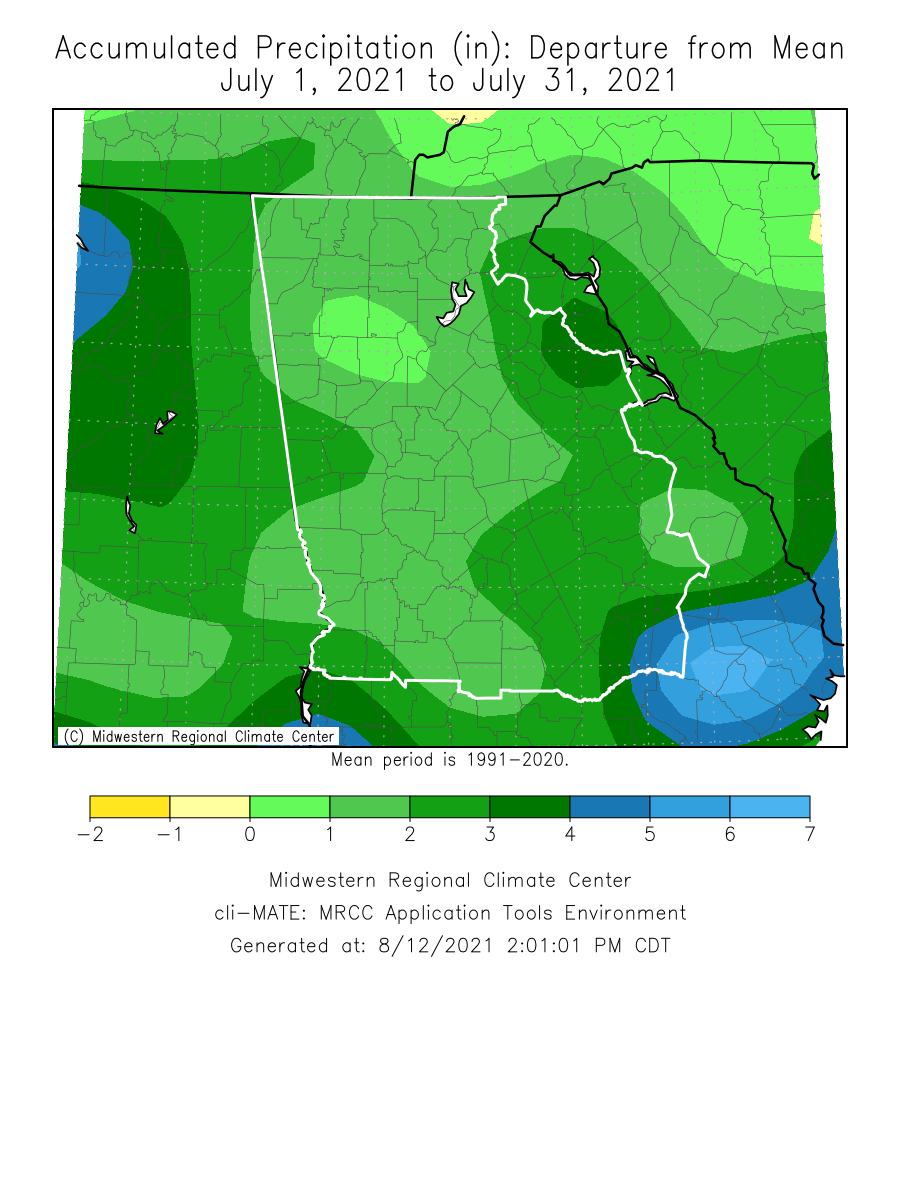
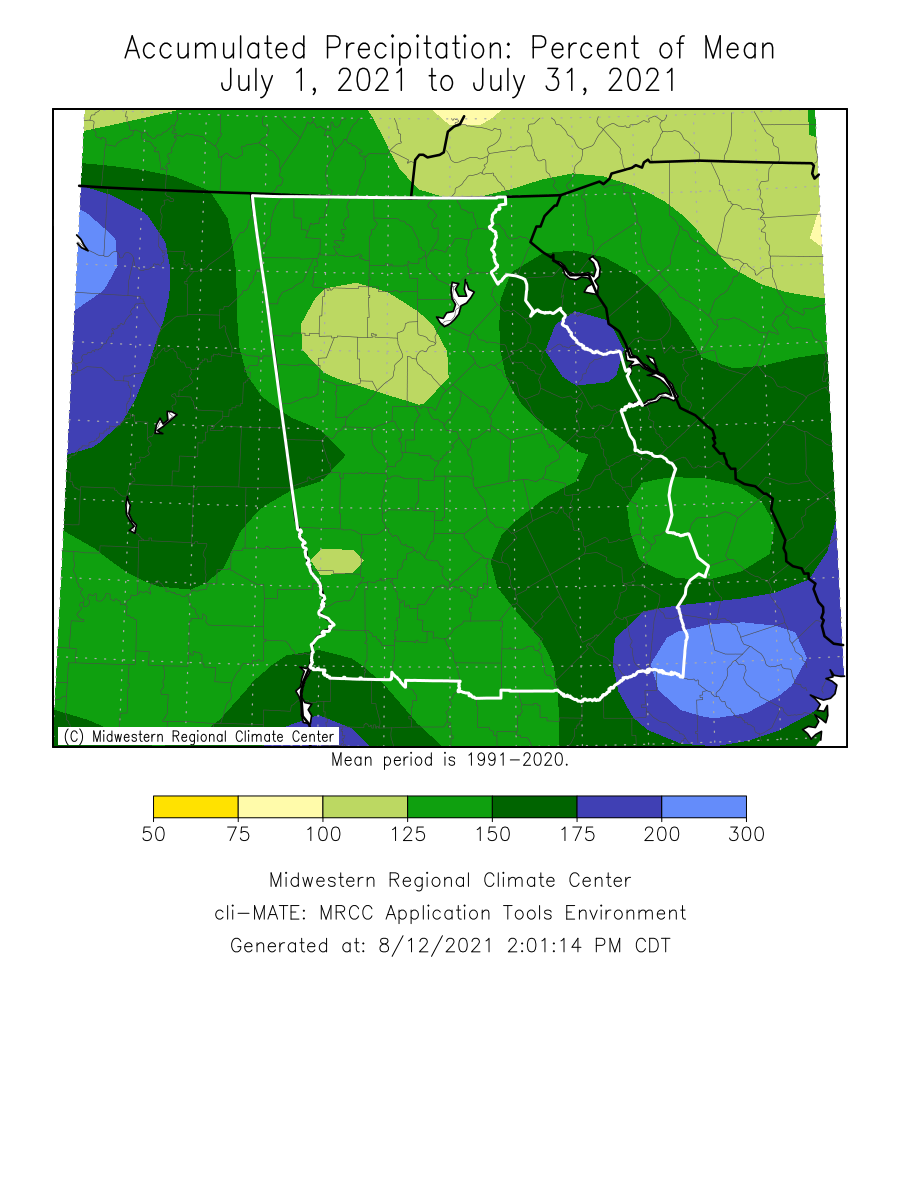
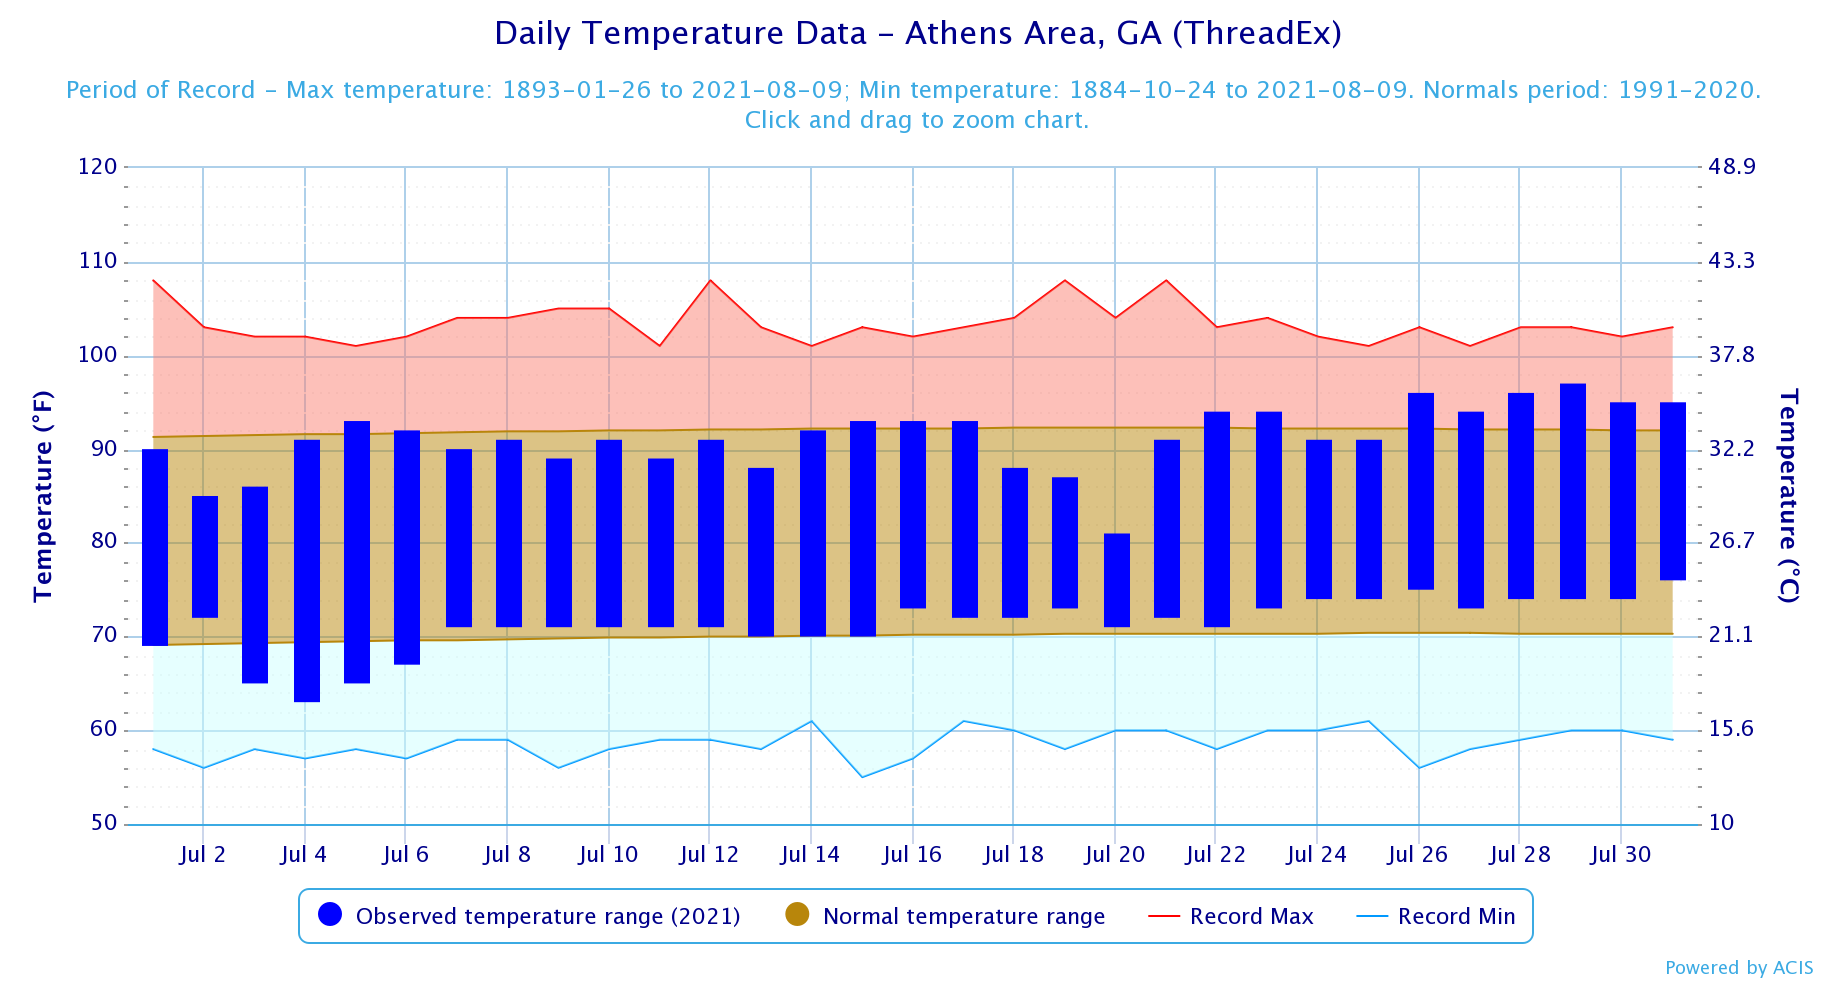
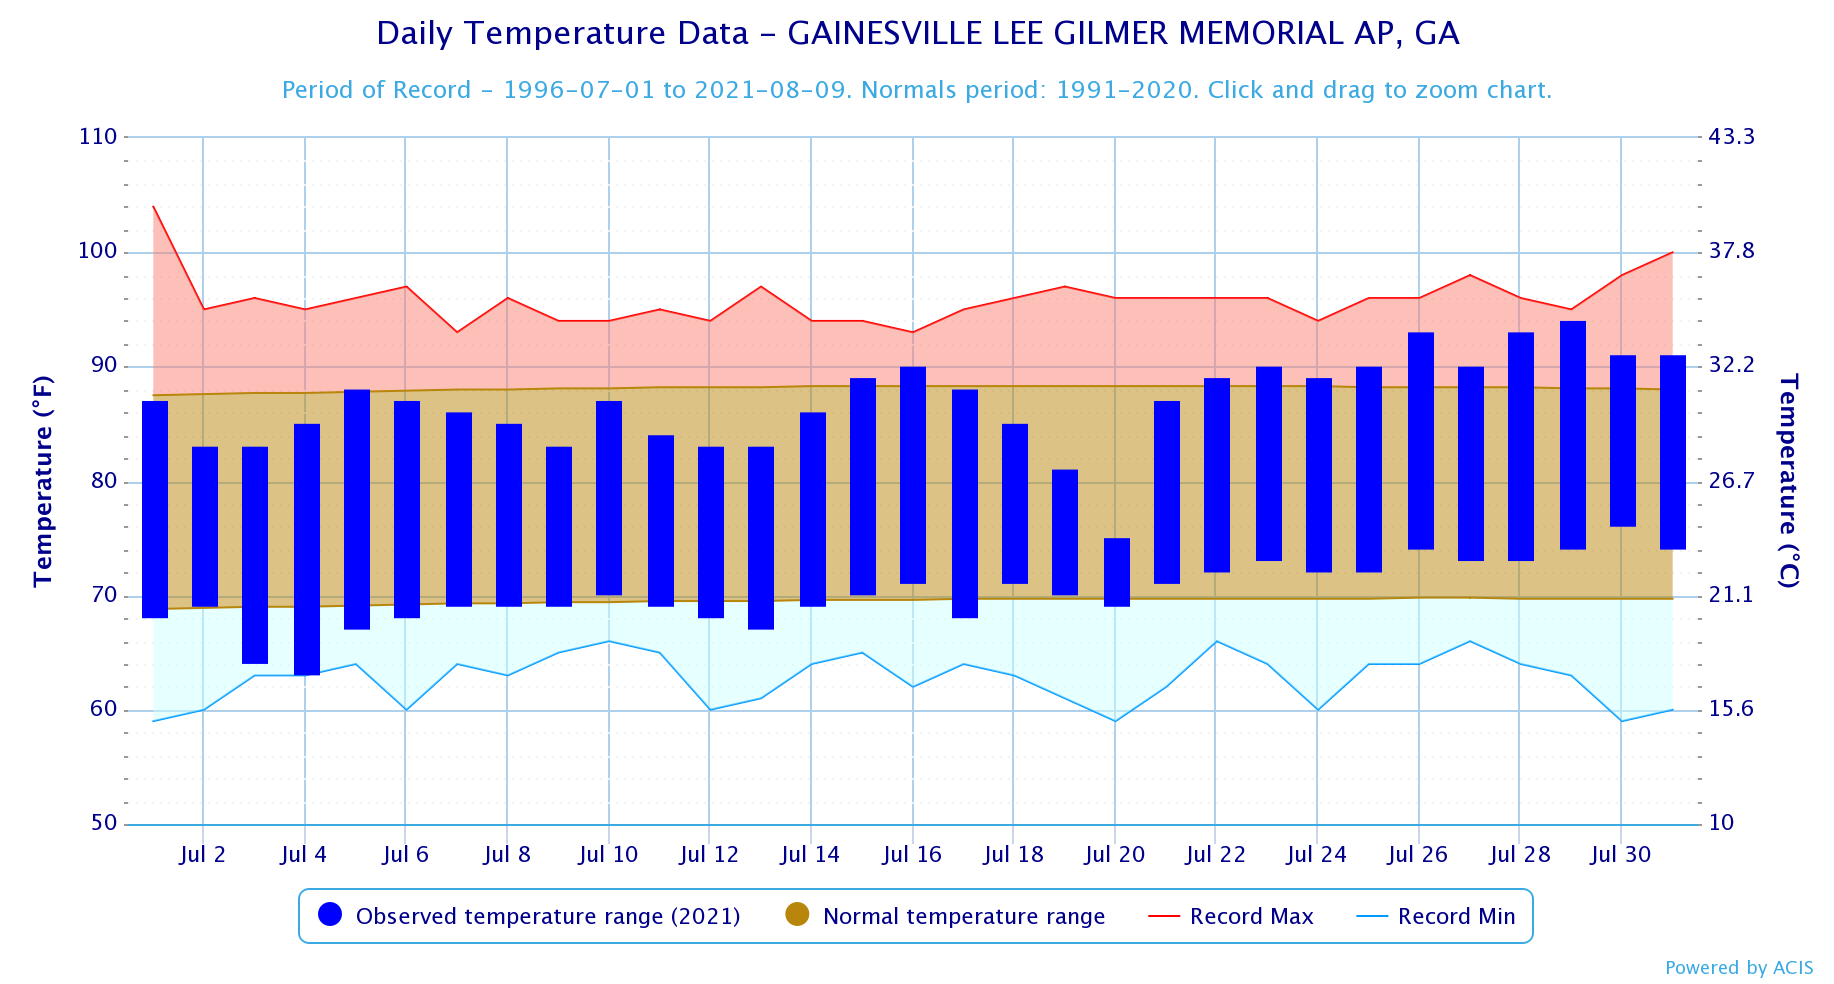
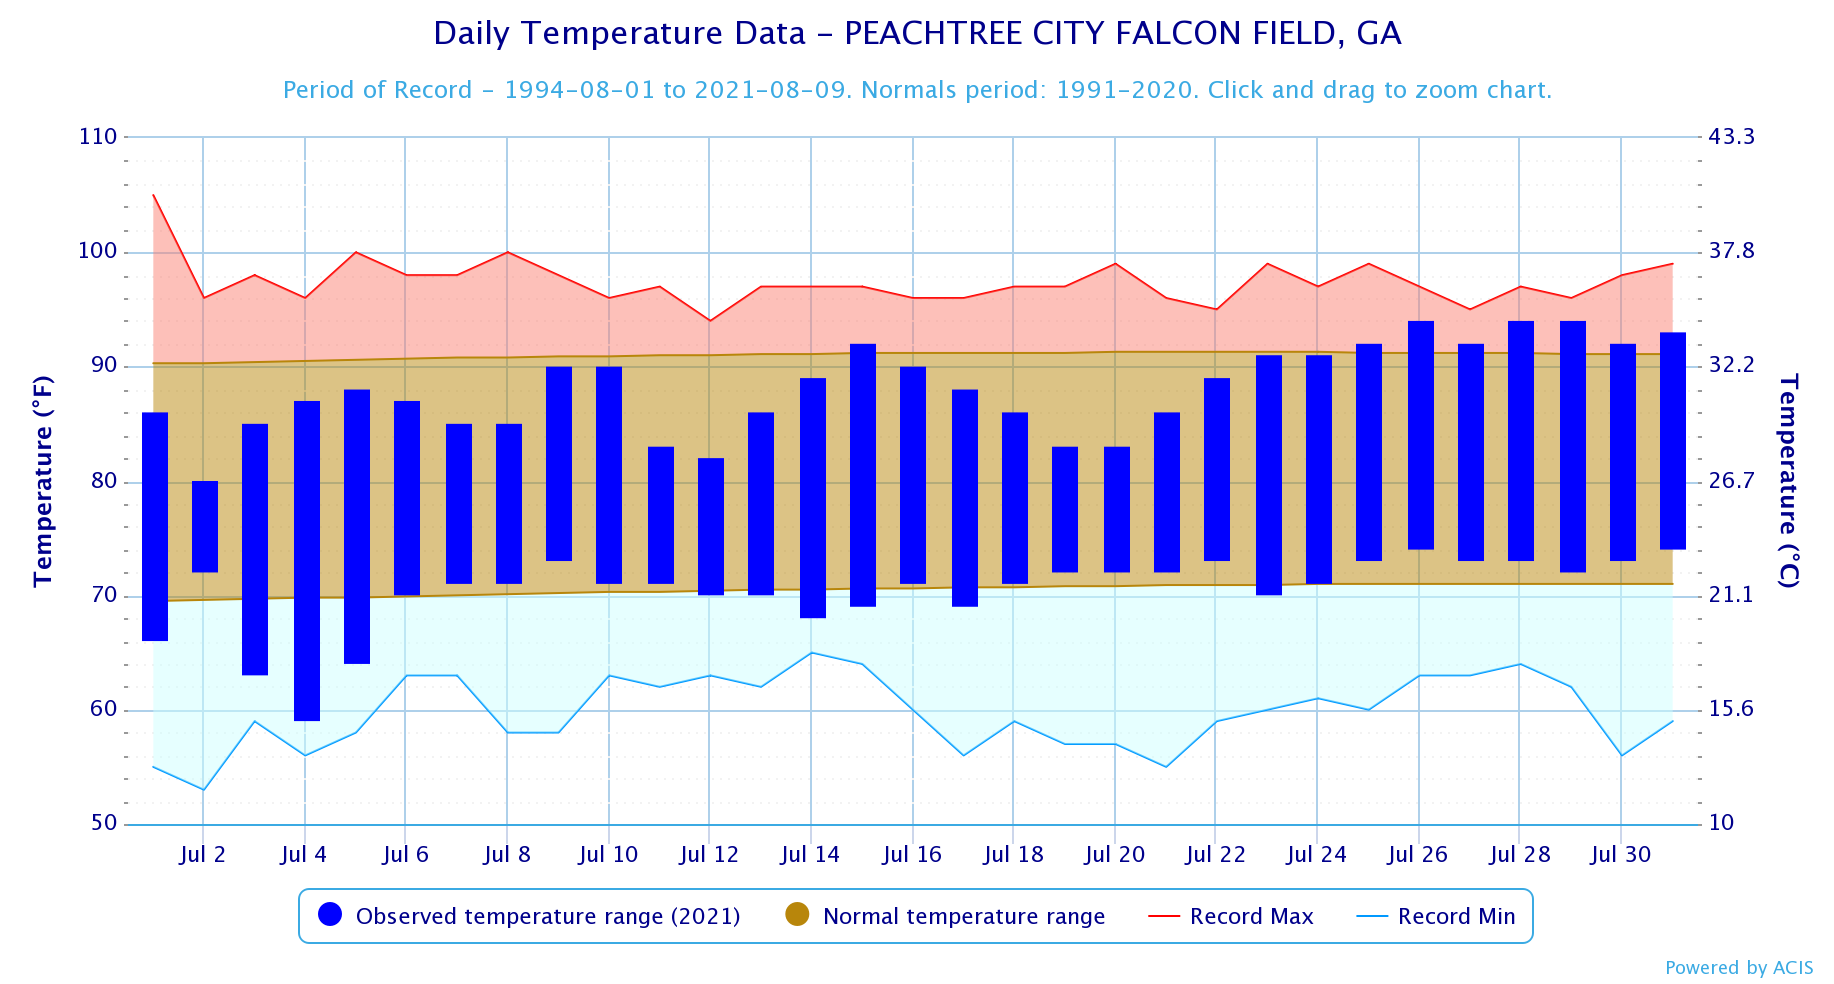
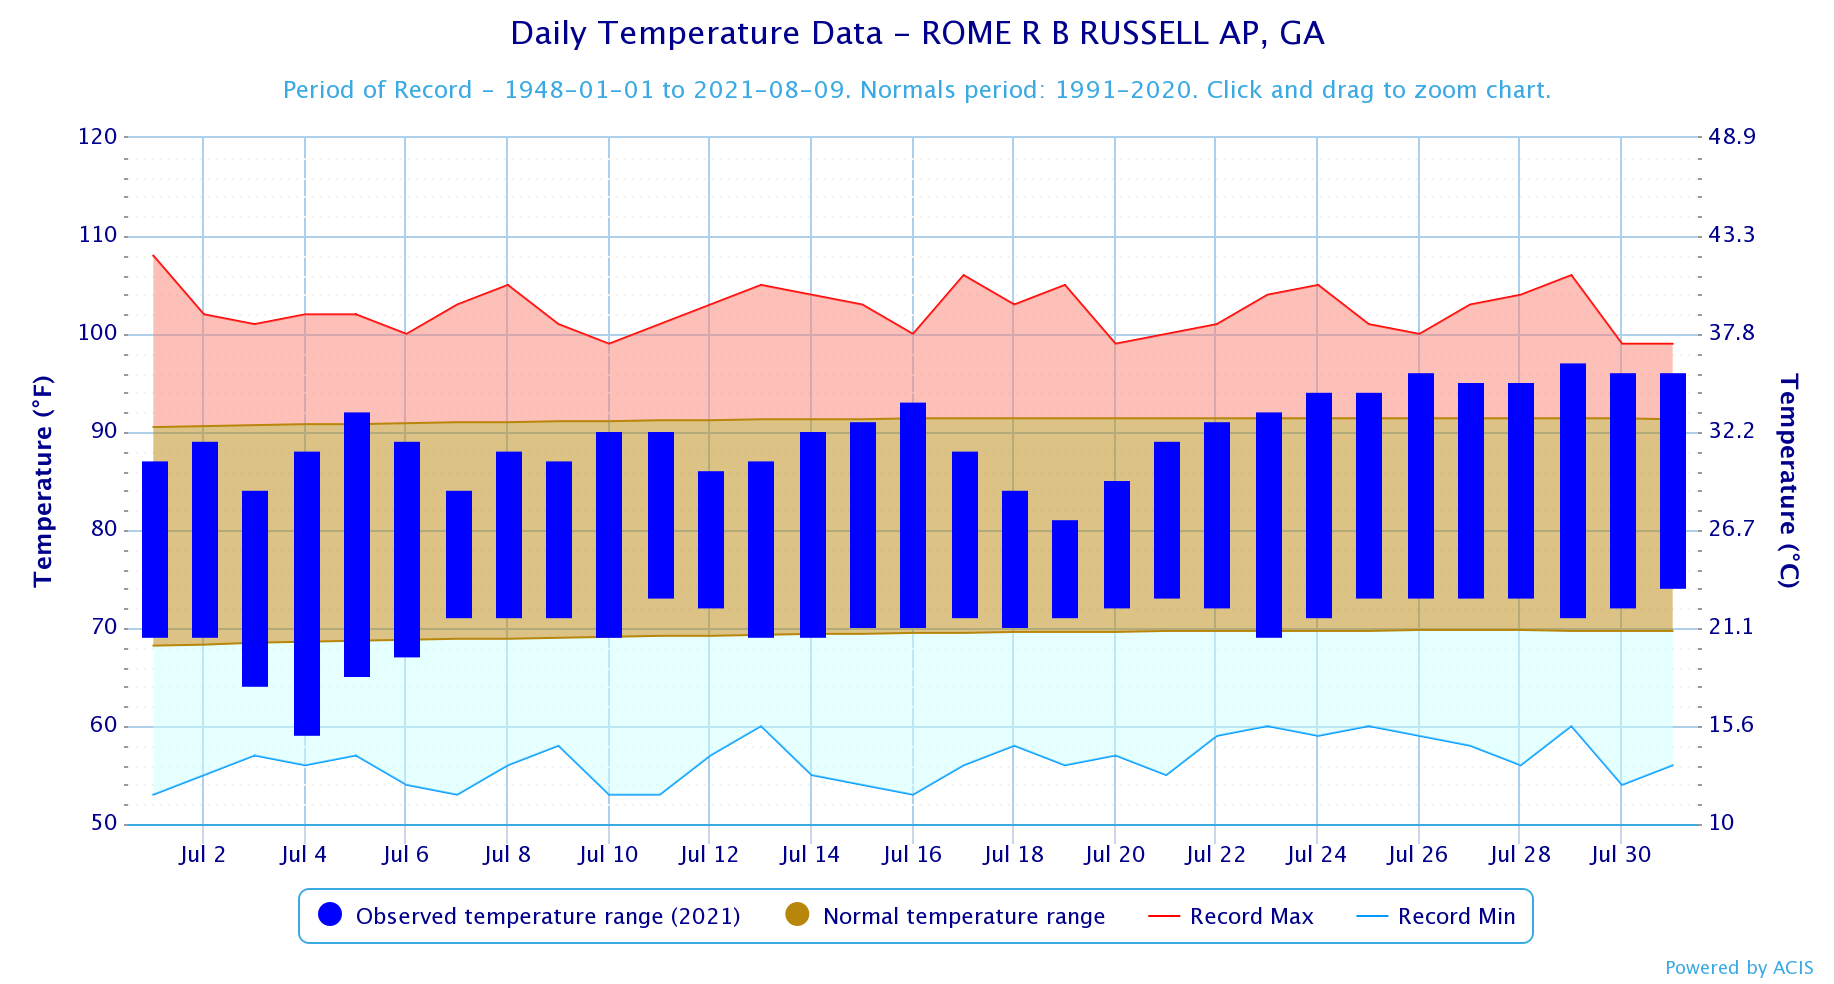
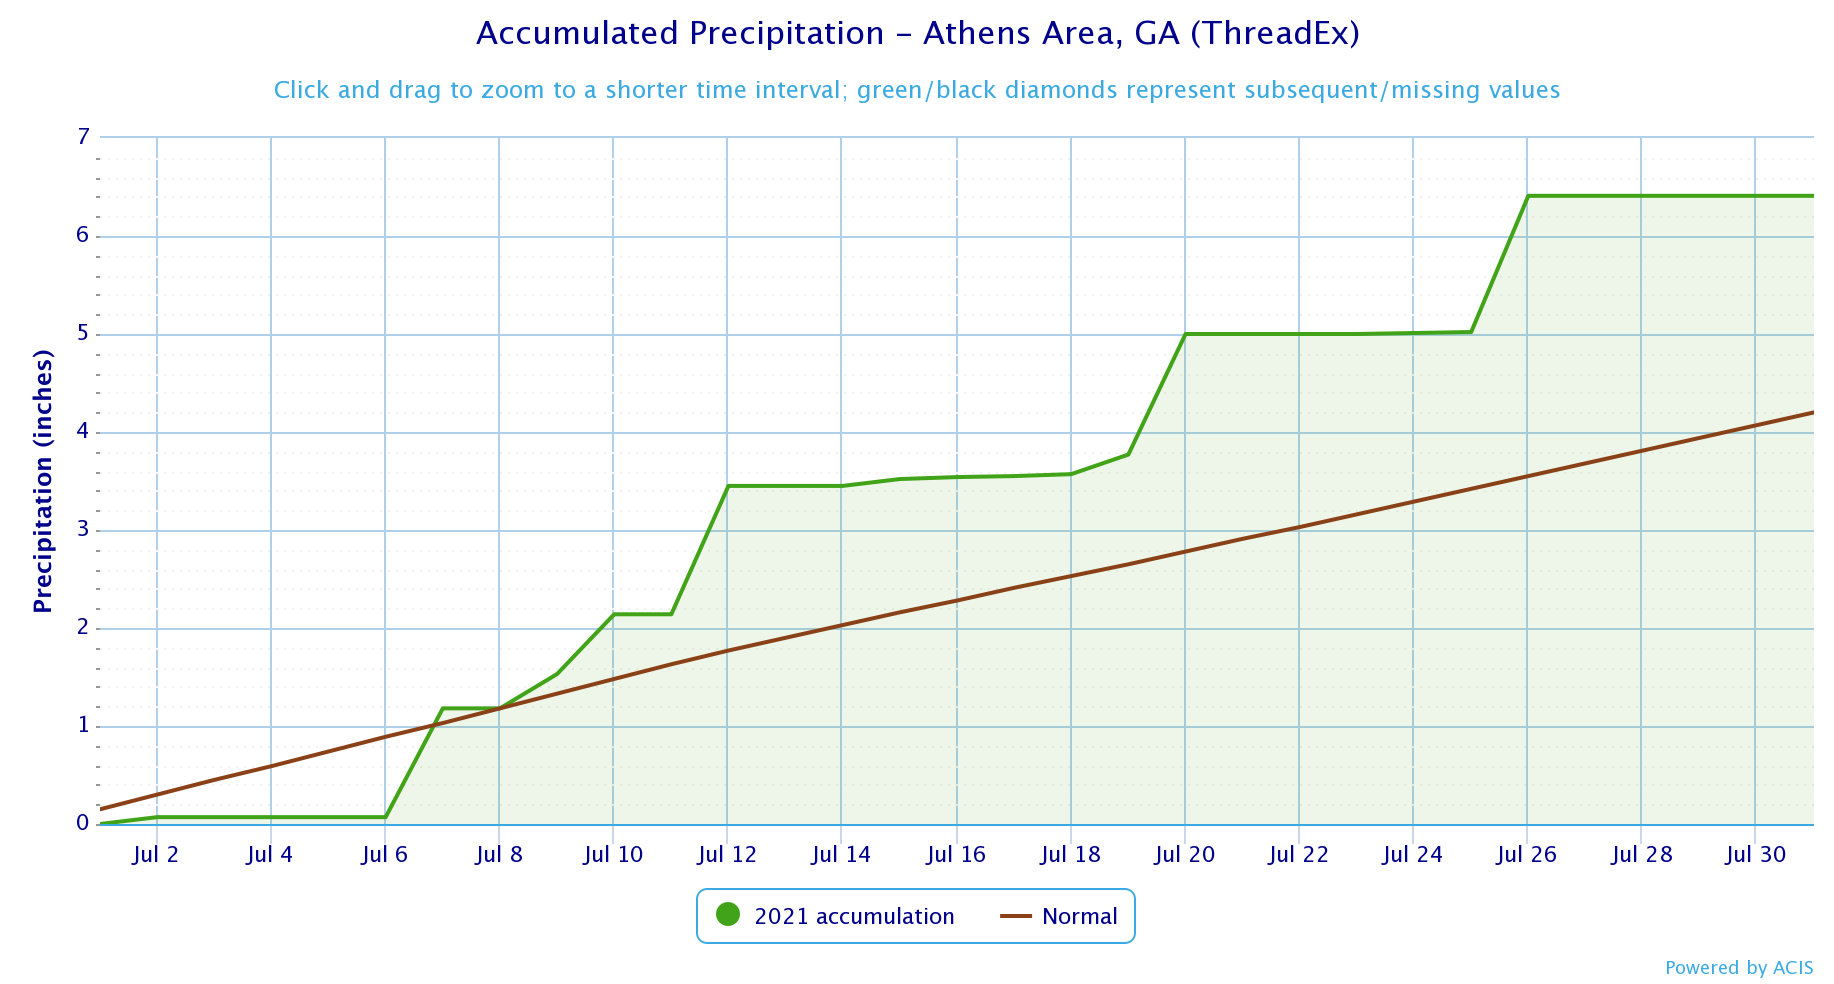
Temperatures through the month of July were around a degree below normal. Precipitation through the month of July was around 0 to 3 inches above normal.
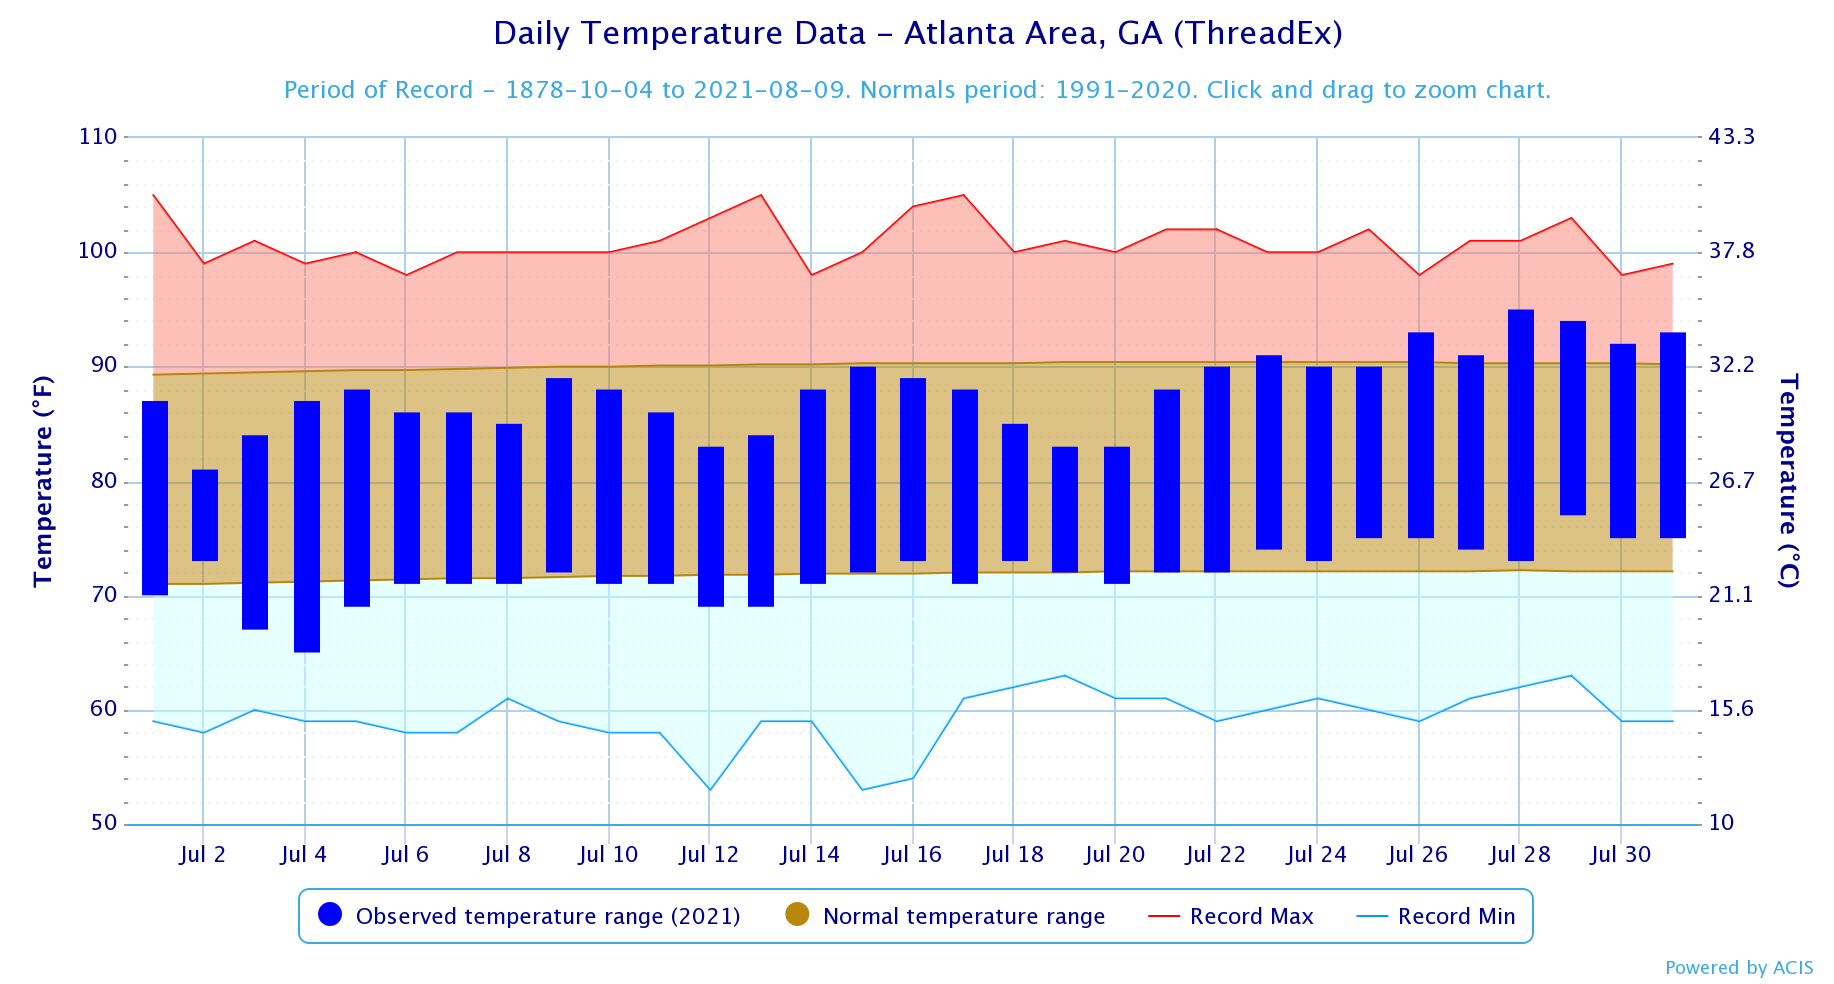
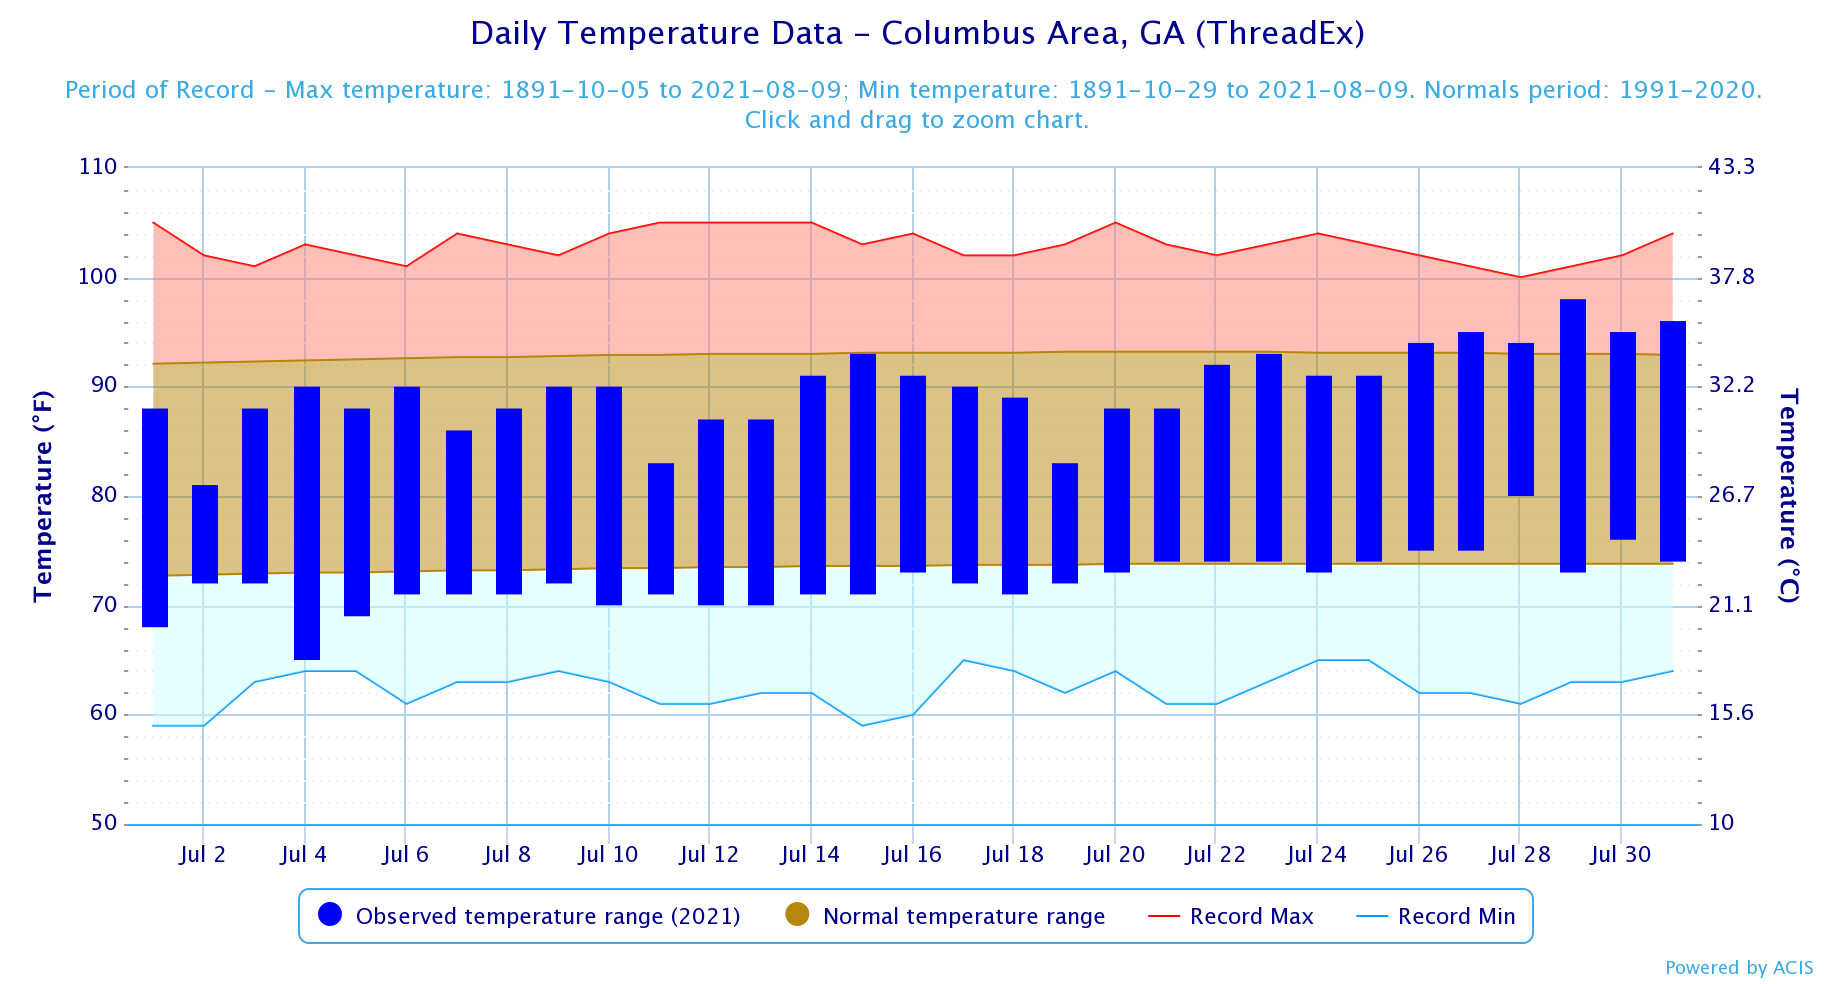
No monthly records were set during the month of July at Atlanta, Athens, Columbus, or Macon.
|
July 2021 Climate Averages
|
|||
|
Climate Site
|
July Temp (°F)
|
Average Temp
|
Departure from normal
|
|
81.2
|
81.0
|
+0.2
|
|
|
79.9
|
80.9
|
-1.0
|
|
|
81.0
|
83.2
|
-2.2
|
|
|
81.3
|
82.5
|
-1.2
|
|
|
78.4
|
78.8
|
-0.4
|
|
|
78.8
|
79.6
|
-0.8
|
|
|
79.0
|
80.1
|
-1.1
|
|
|
78.5
|
78.8
|
-0.3
|
|
|
79.3
|
80.8
|
-1.5
|
|
|
80.1
|
80.2
|
-0.1
|
|
|
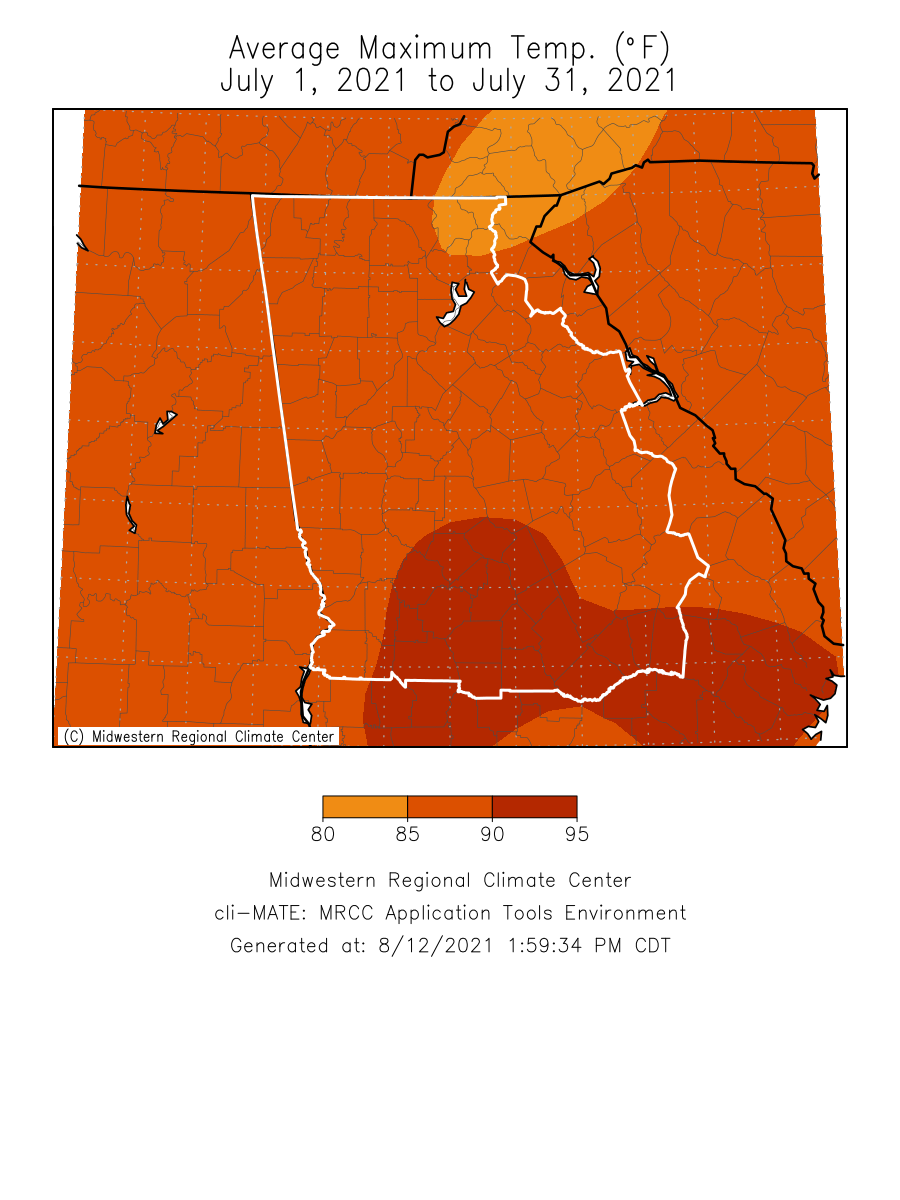
July 2021 Temperature Climate Statistics
|
||||
|
Climate Site |
Maximum Temperature |
Max T Date |
Minimum Temperature
|
Min T Date
|
|
Athens
|
97
|
7/29
|
63
|
7/4
|
|
Atlanta
|
95
|
7/28
|
65
|
7/4
|
|
Columbus
|
98
|
7/29
|
65
|
7/4
|
|
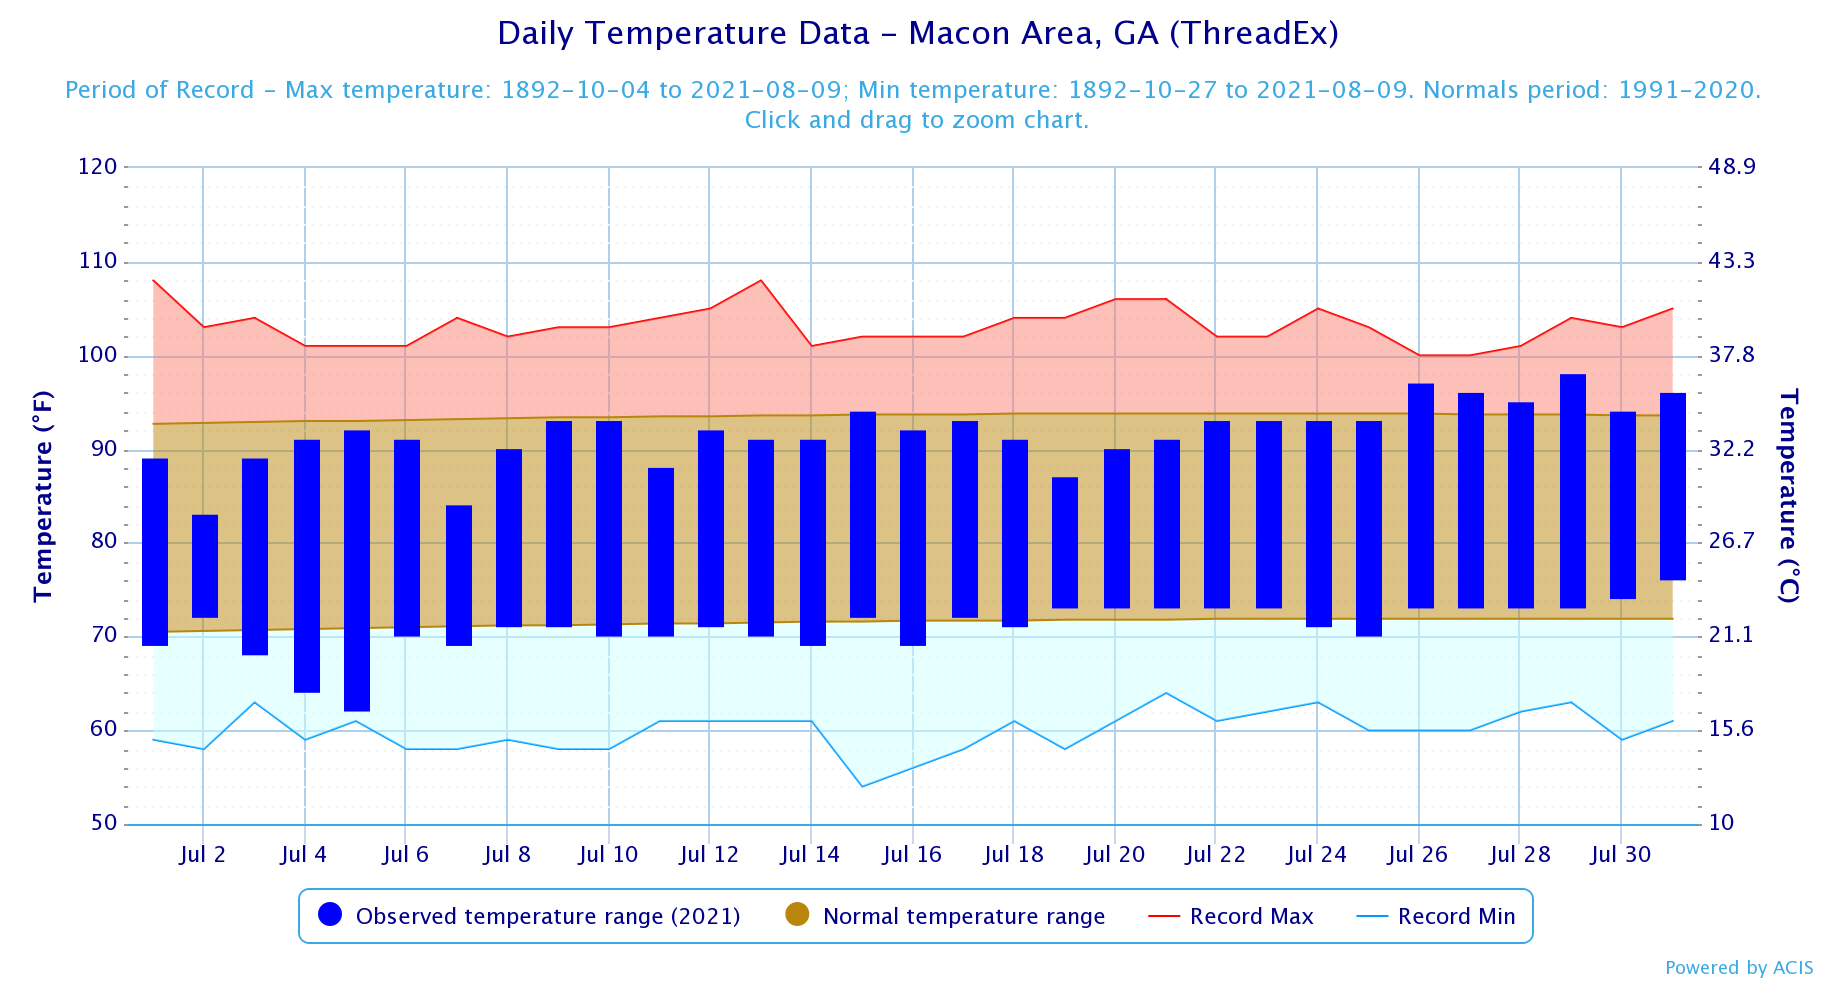
Macon
|
98
|
7/29
|
62
|
7/5
|
|
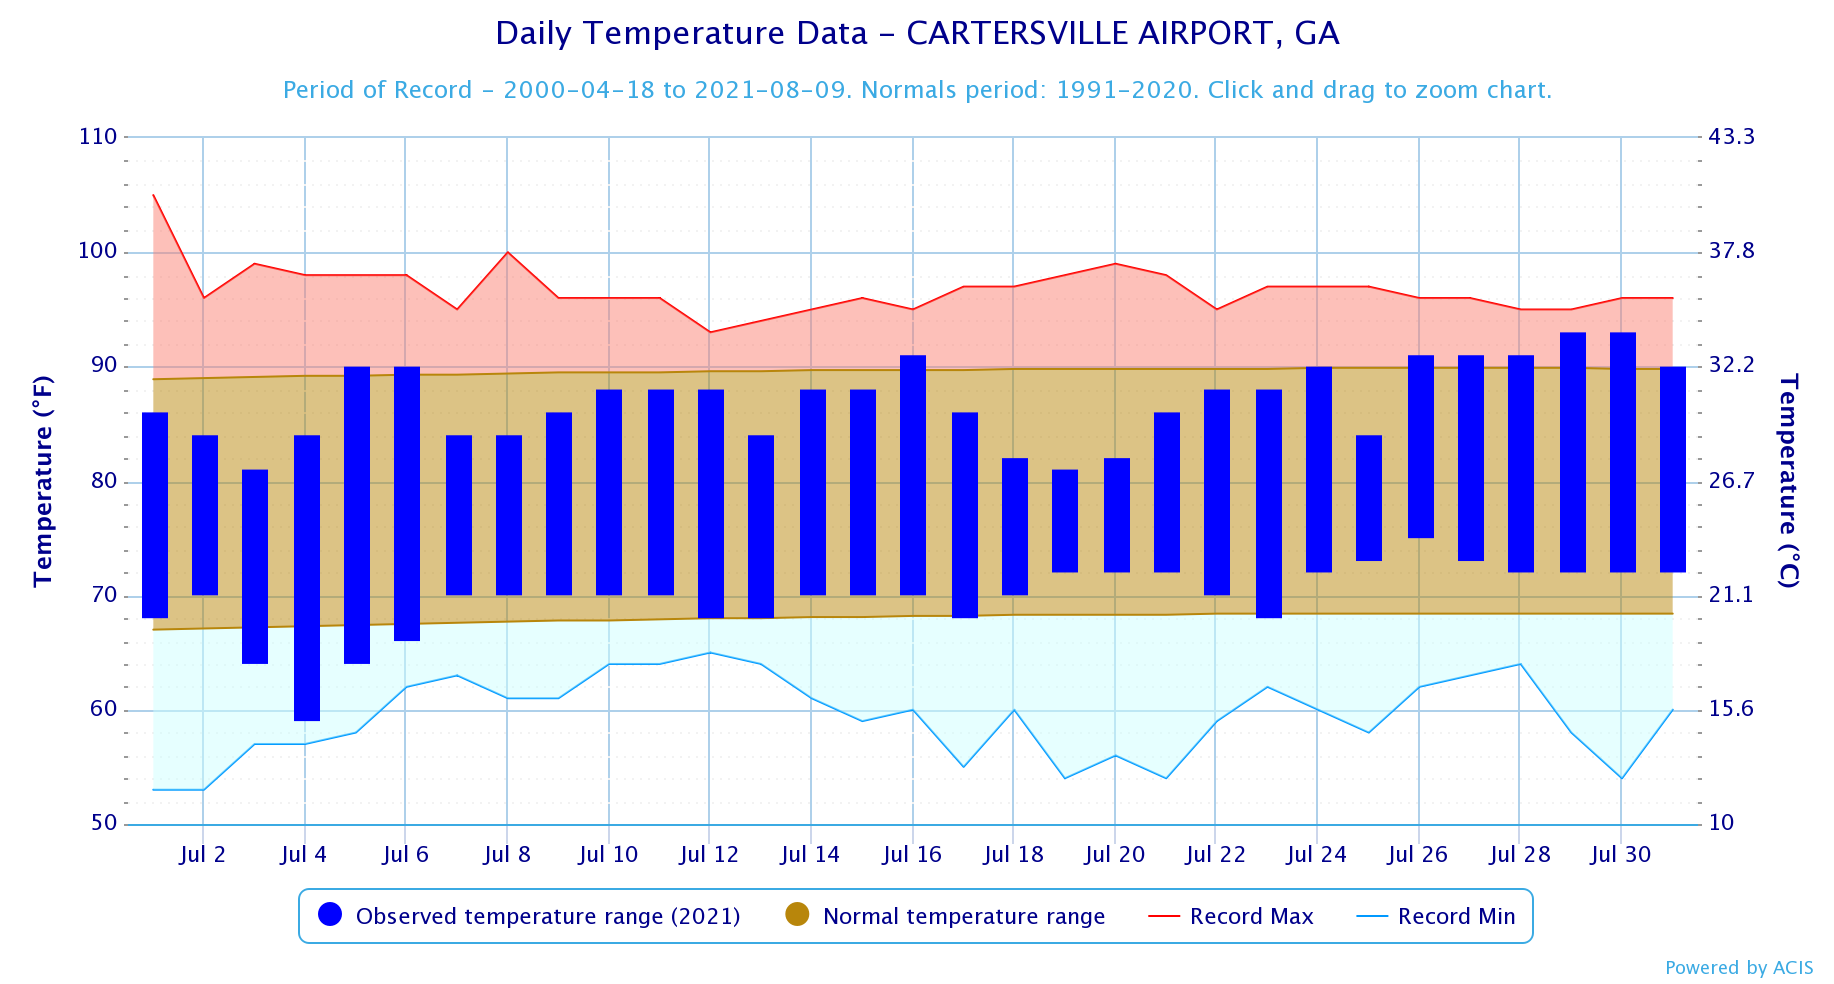
Cartersville
|
93
|
7/29, 7/30
|
59
|
7/4
|
|
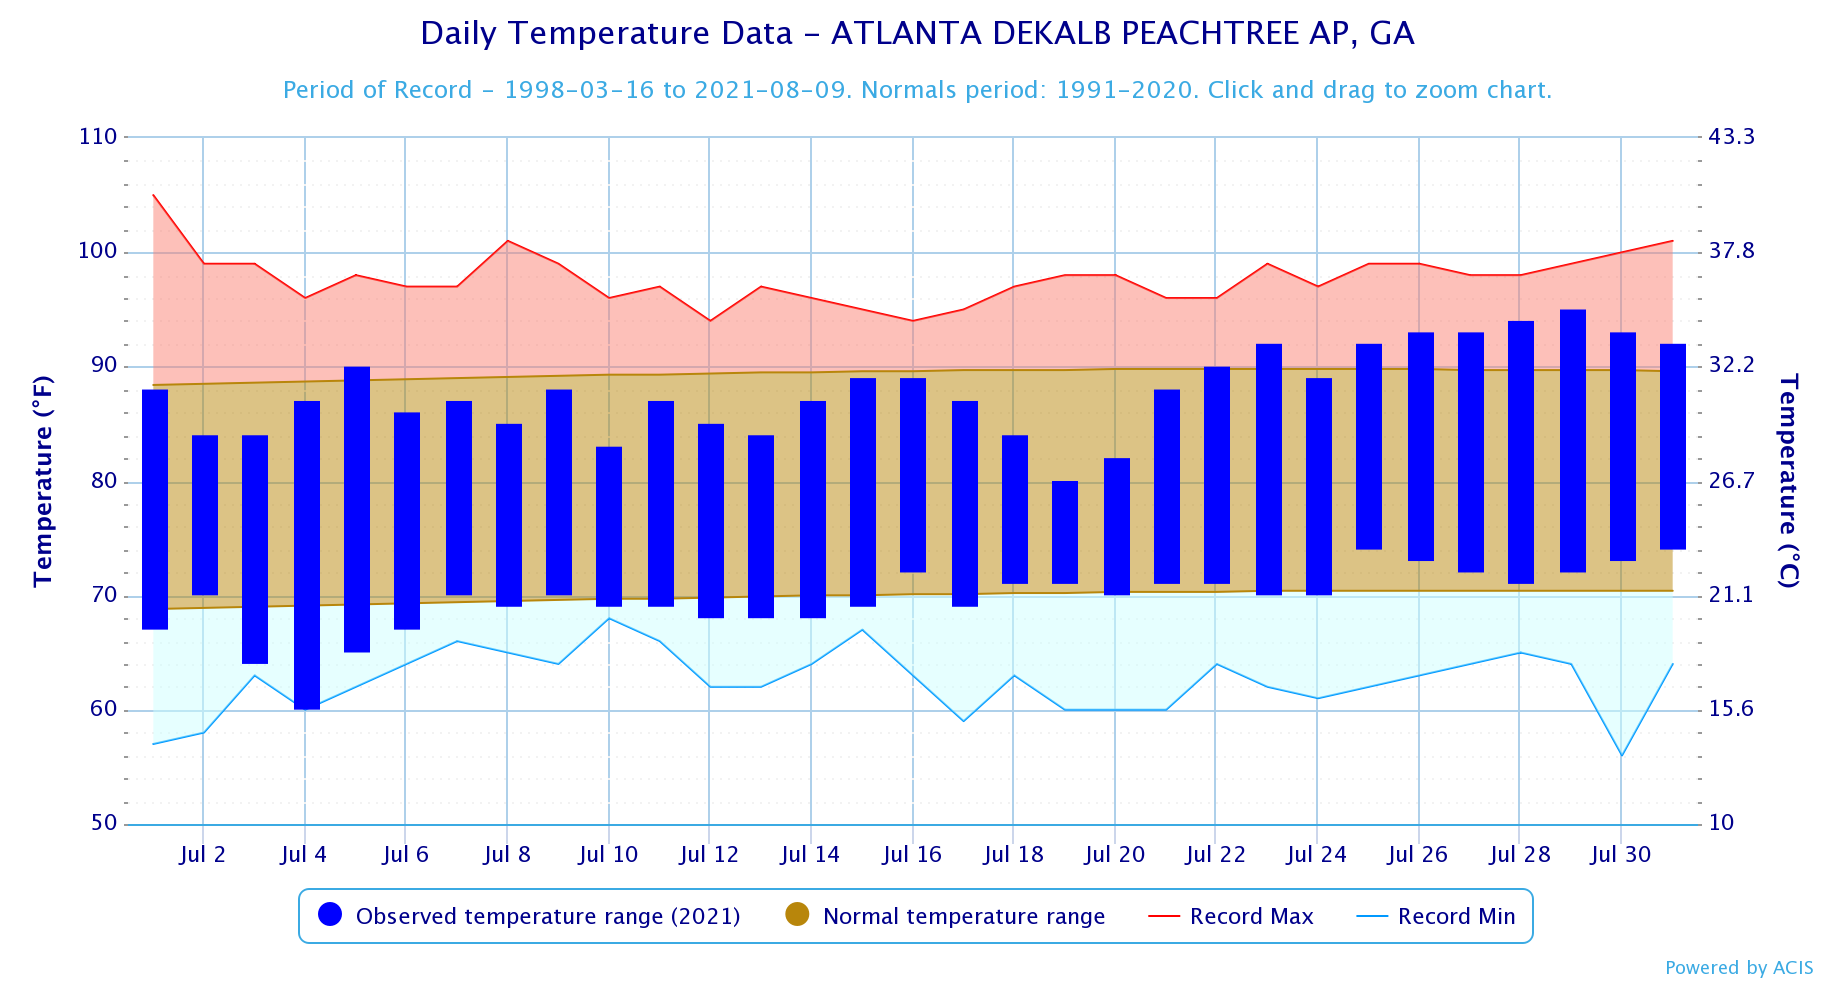
Dekalb Peachtree Arpt
|
95
|
7/29
|
60
|
7/4*
|
|
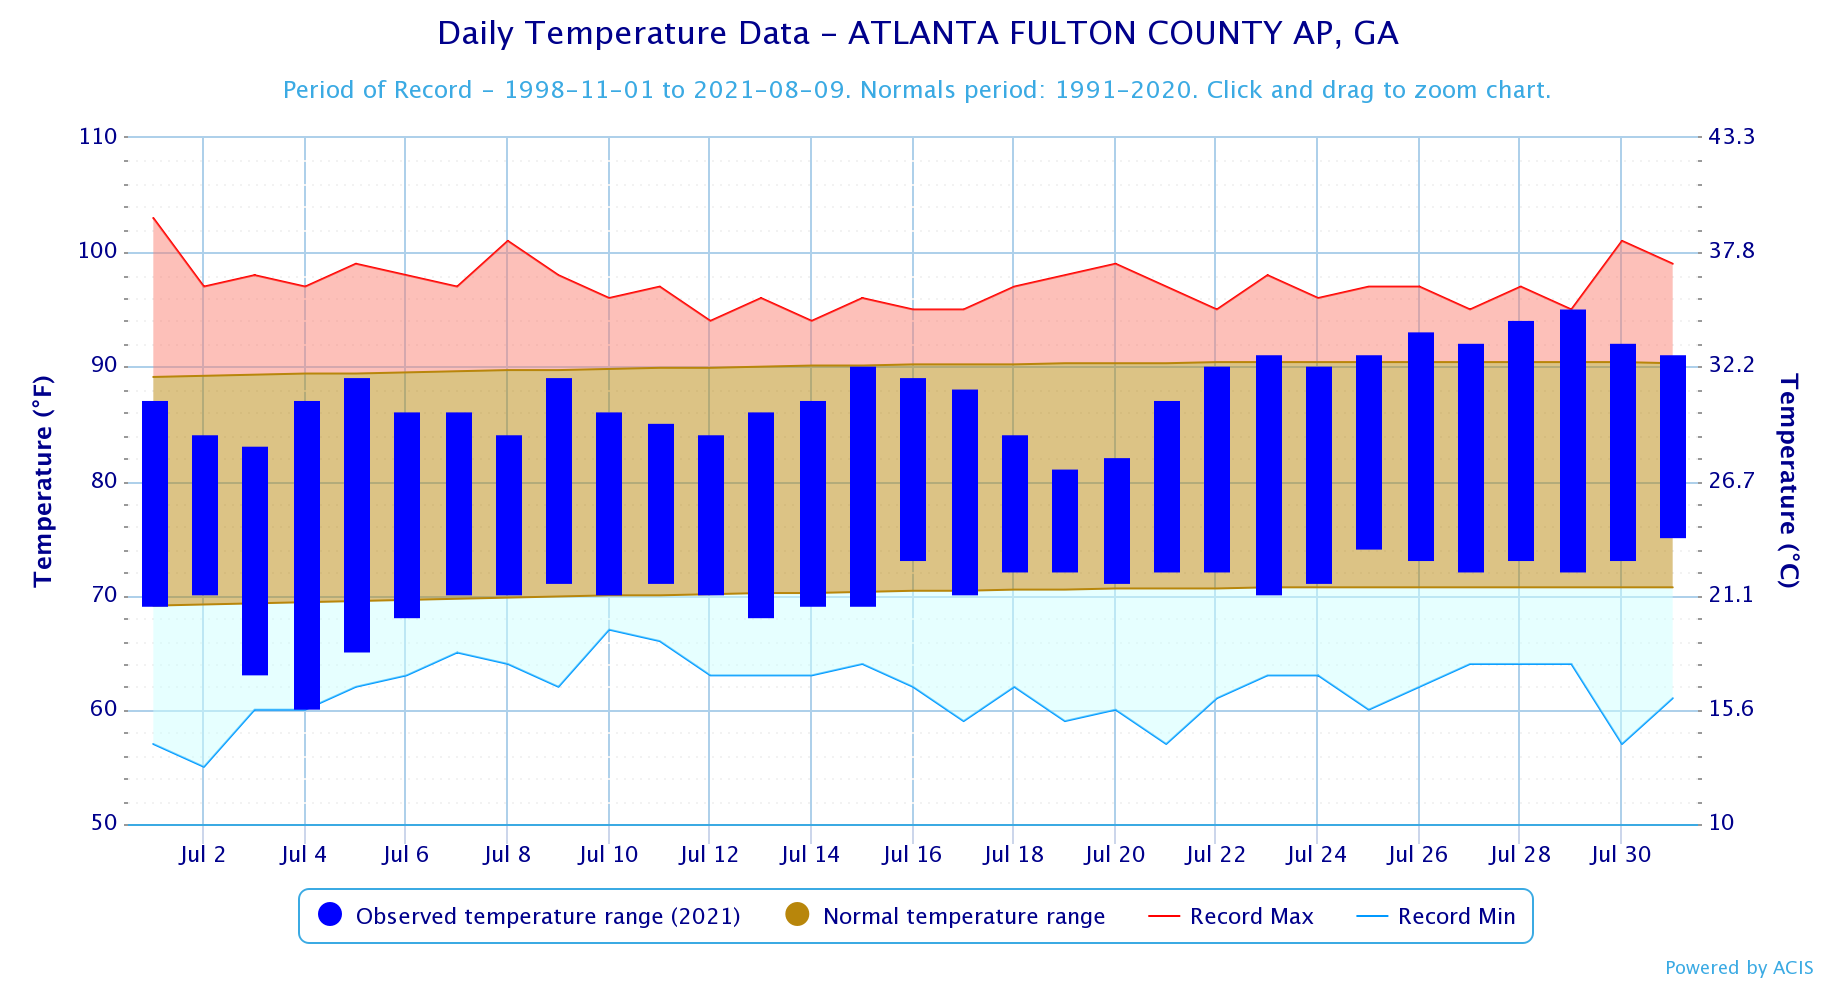
Fulton Co Arpt
|
95
|
7/29*
|
60
|
7/4*
|
|
Gainesville
|
94
|
7/29
|
63
|
7/4*
|
|
Peachtree City
|
94
|
7/26, 7/28, 7/29
|
59
|
7/4
|
|
Rome
|
97
|
7/29
|
59
|
7/4
|
*Indicates a daily record was set
|
July 2021 Precipitation Climate Statistics
|
|||
|
Climate Site |
Total Precipitation |
Normal Precipitation
|
DFN (Departure From Normal)
|
|
6.41
|
4.20
|
+2.21
|
|
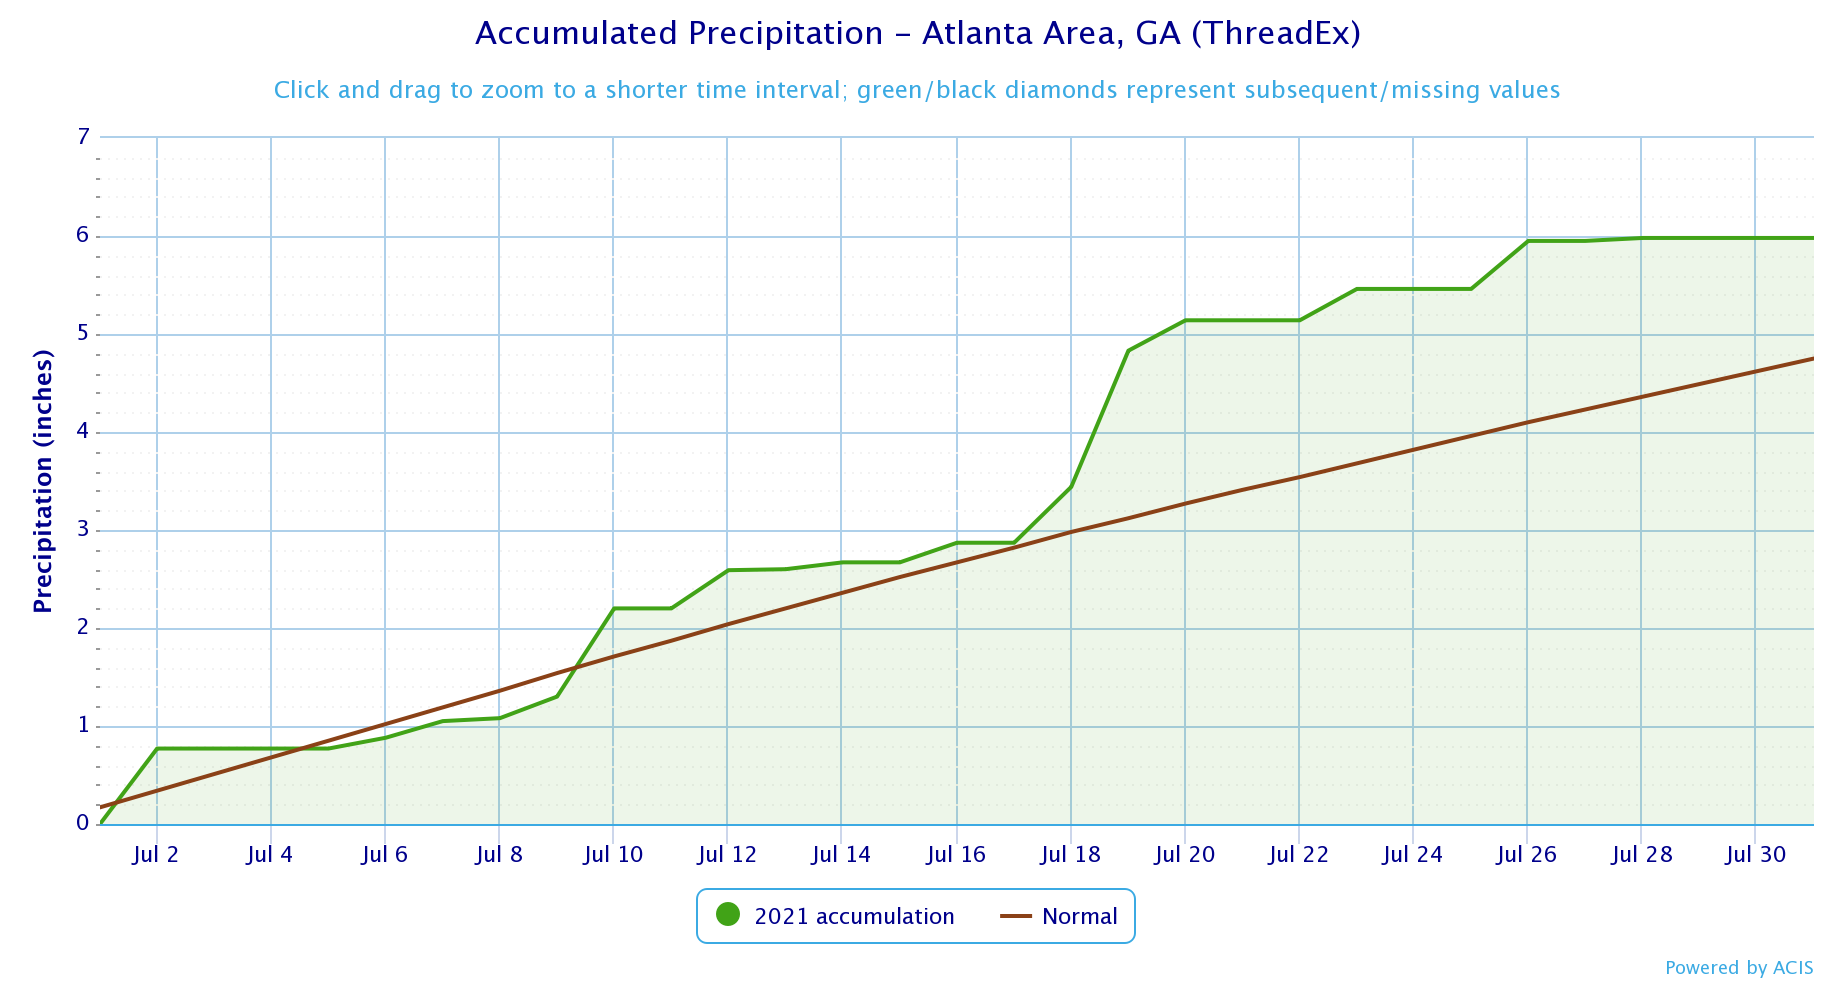
|
5.98
|
4.75
|
+1.23
|
|
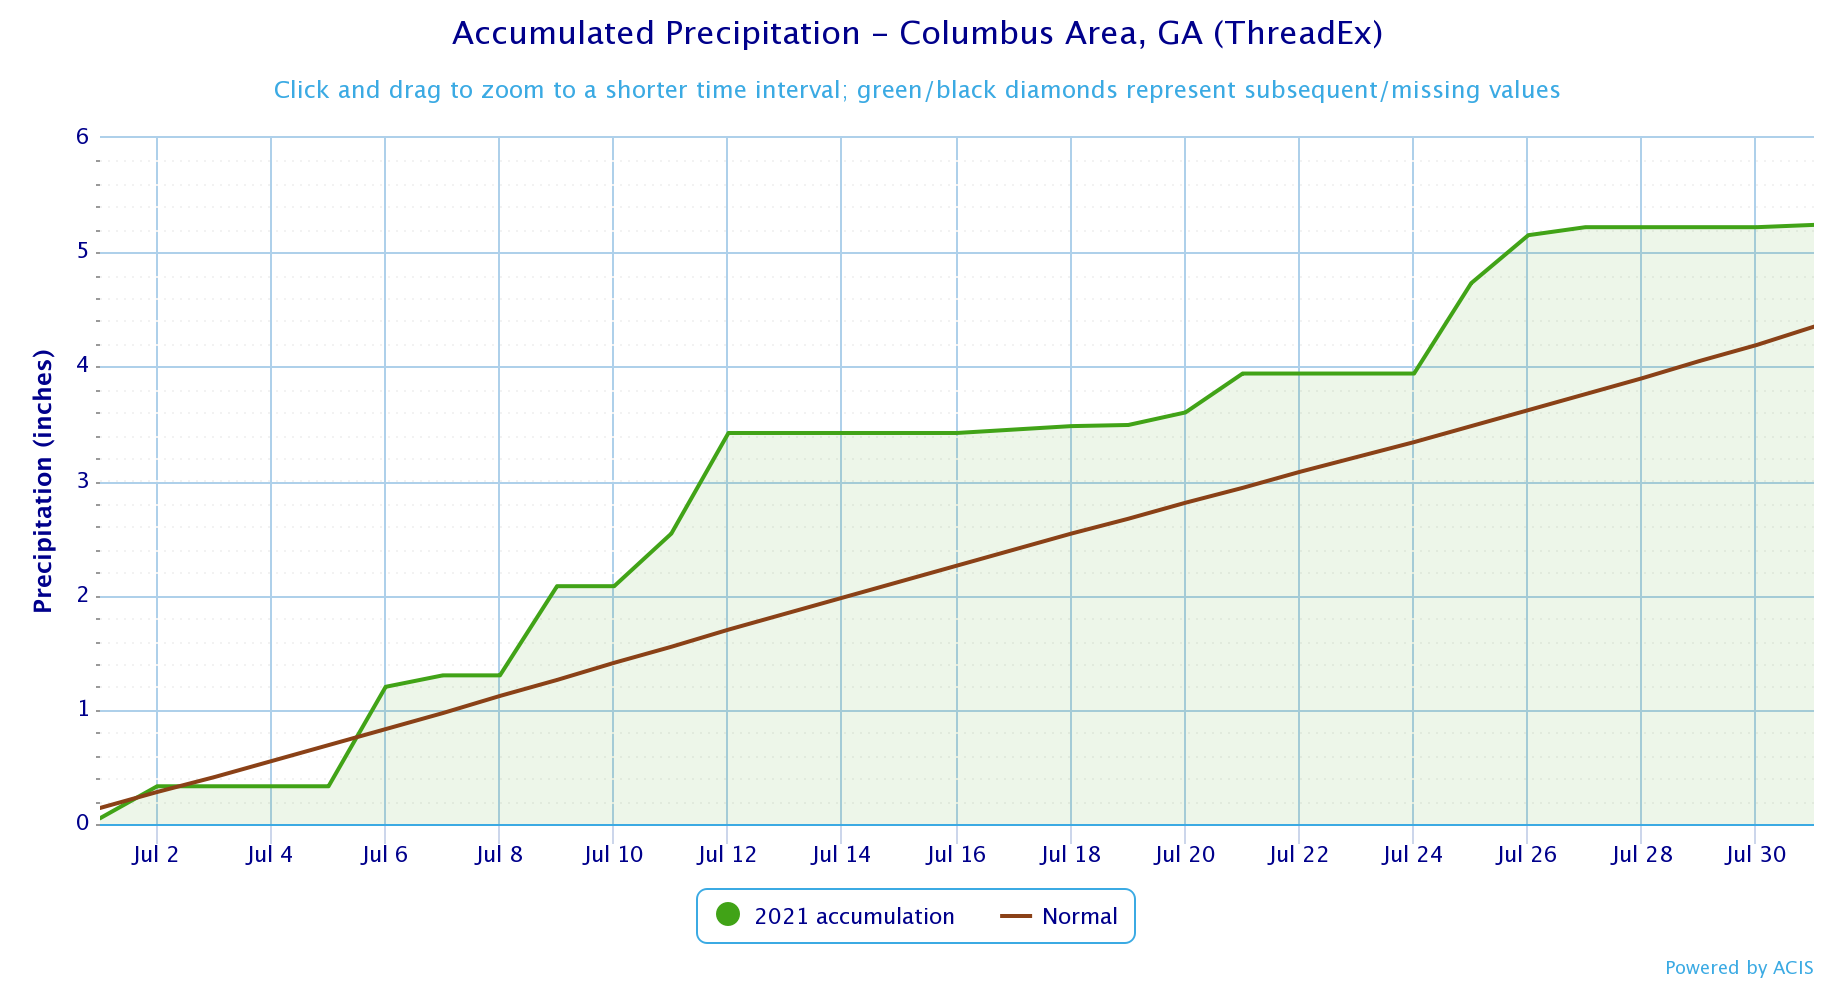
|
5.24
|
4.32
|
+0.89
|
|
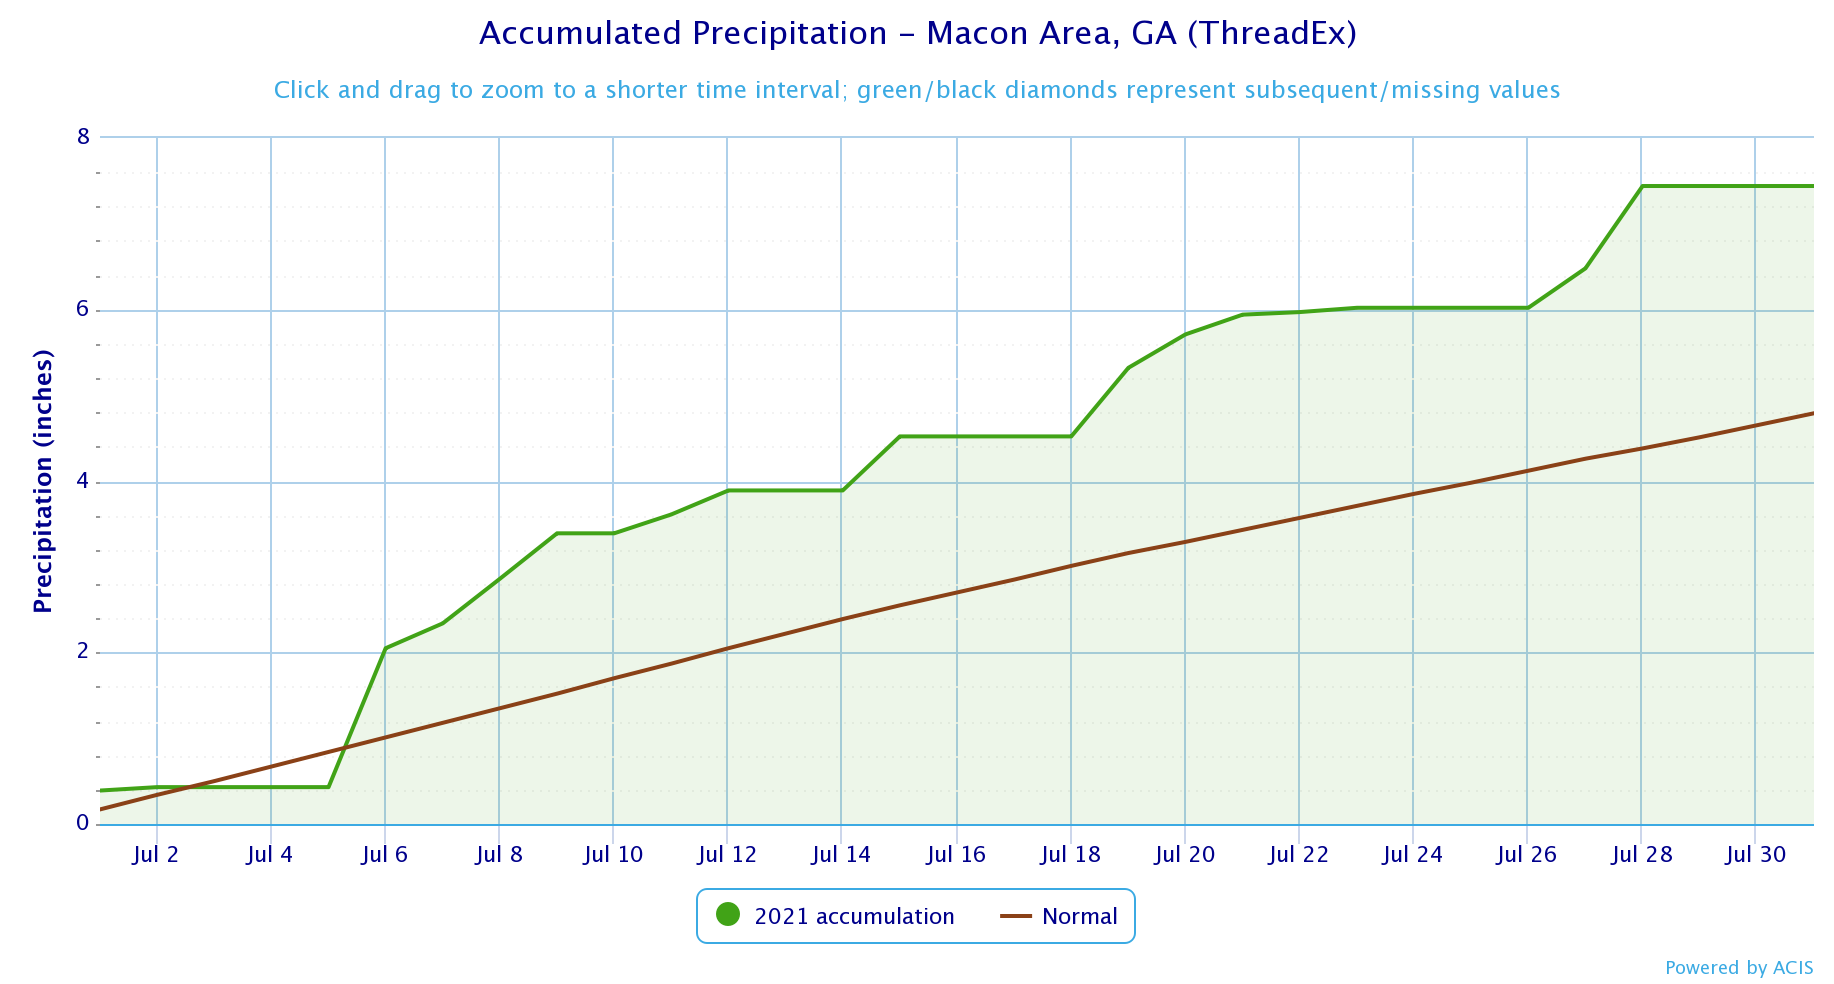
|
7.44
|
4.79
|
+2.65
|
|
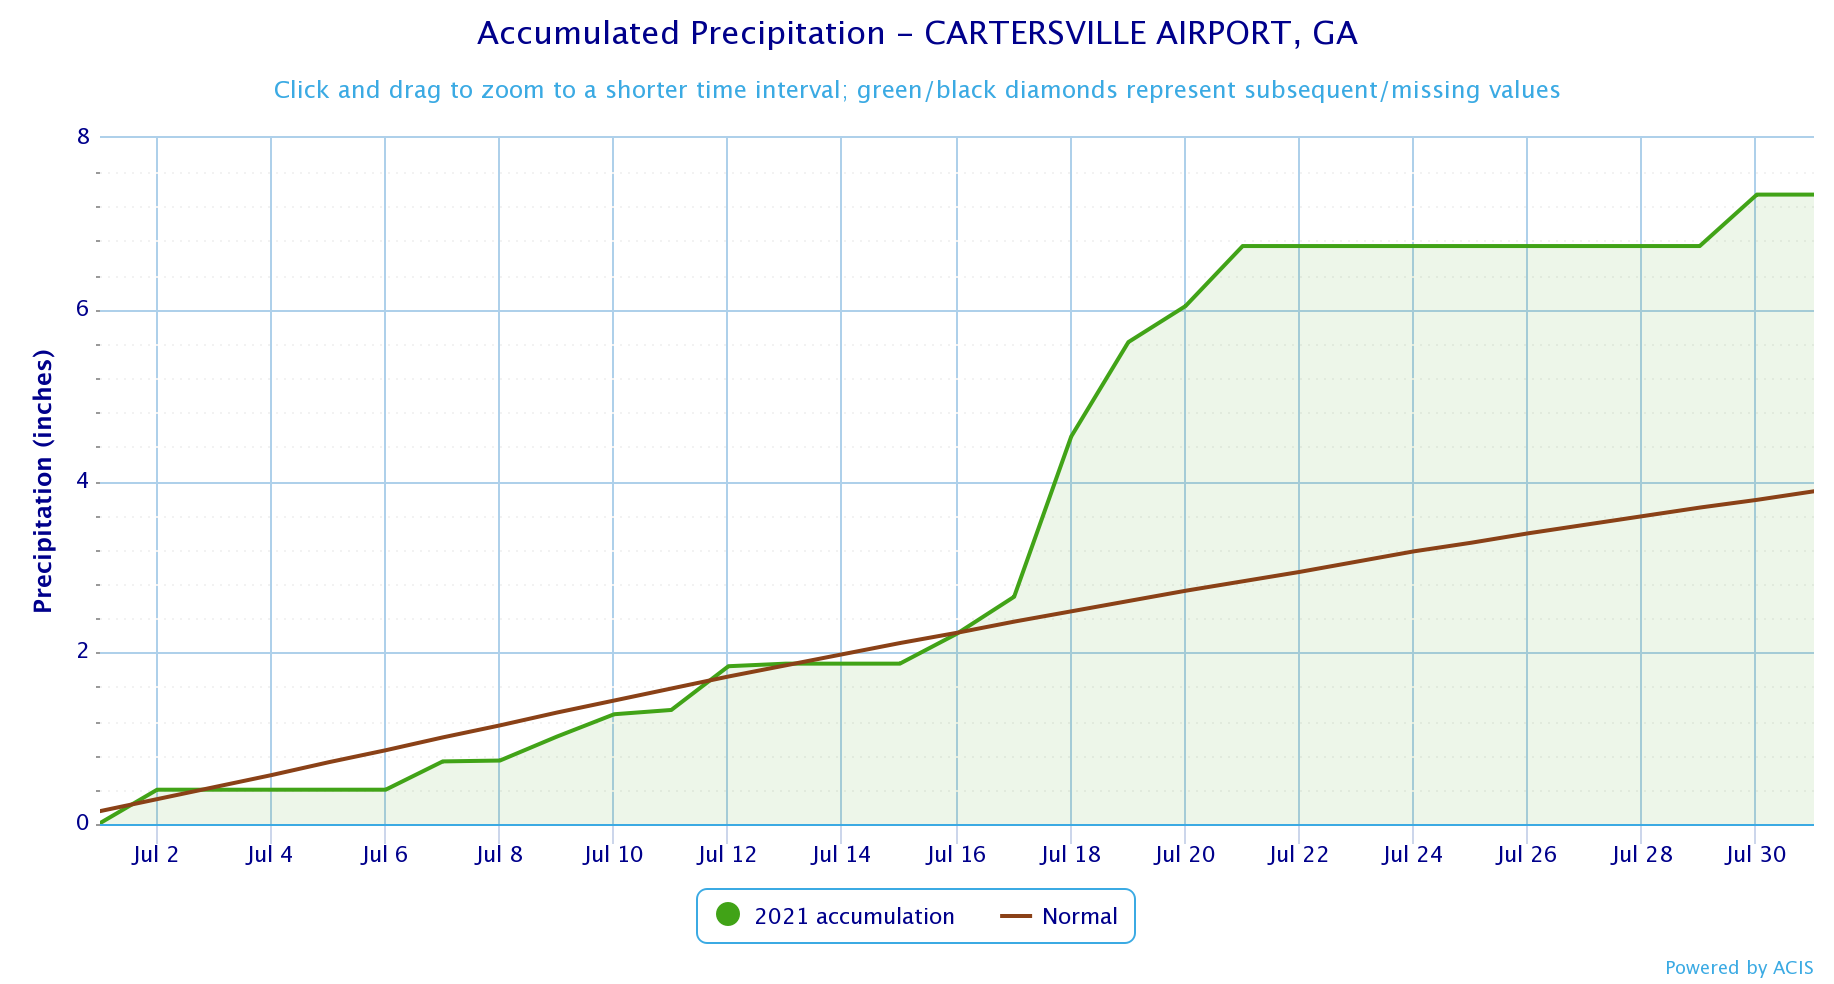
|
7.34
|
3.88
|
+3.46
|
|
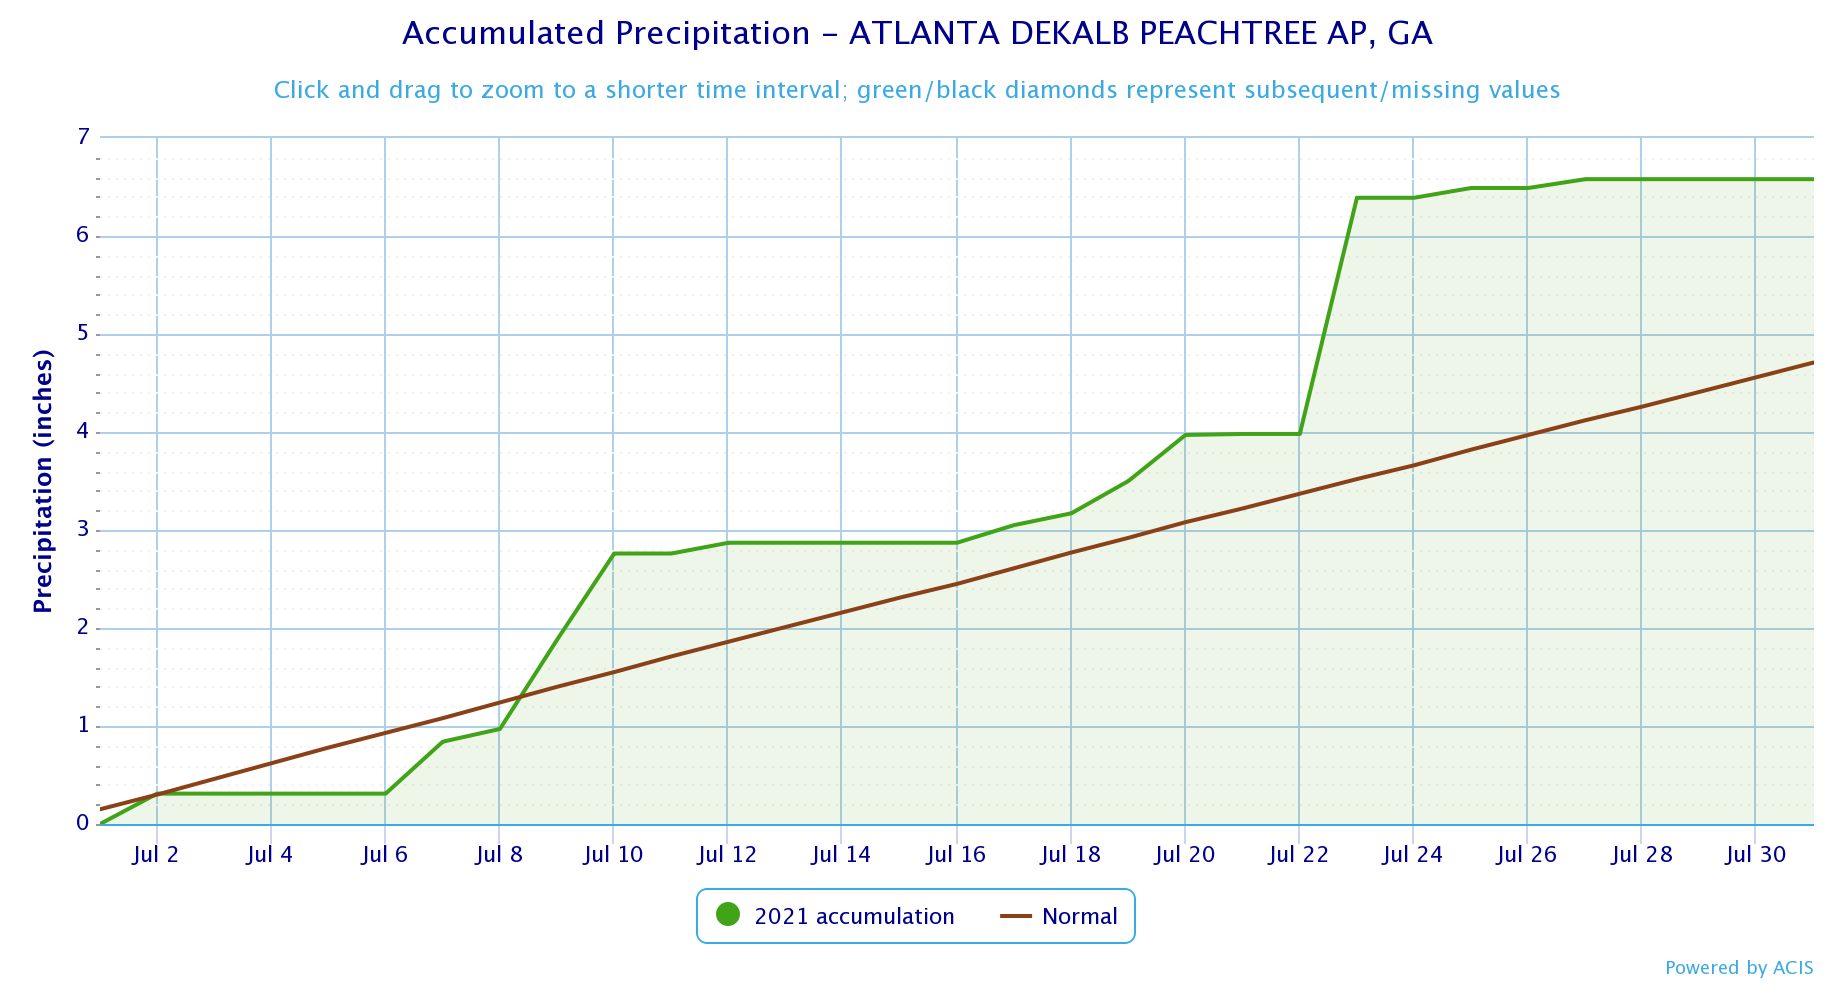
|
6.58
|
4.71
|
+1.87
|
|
|
5.64
|
5.01
|
+0.63
|
|
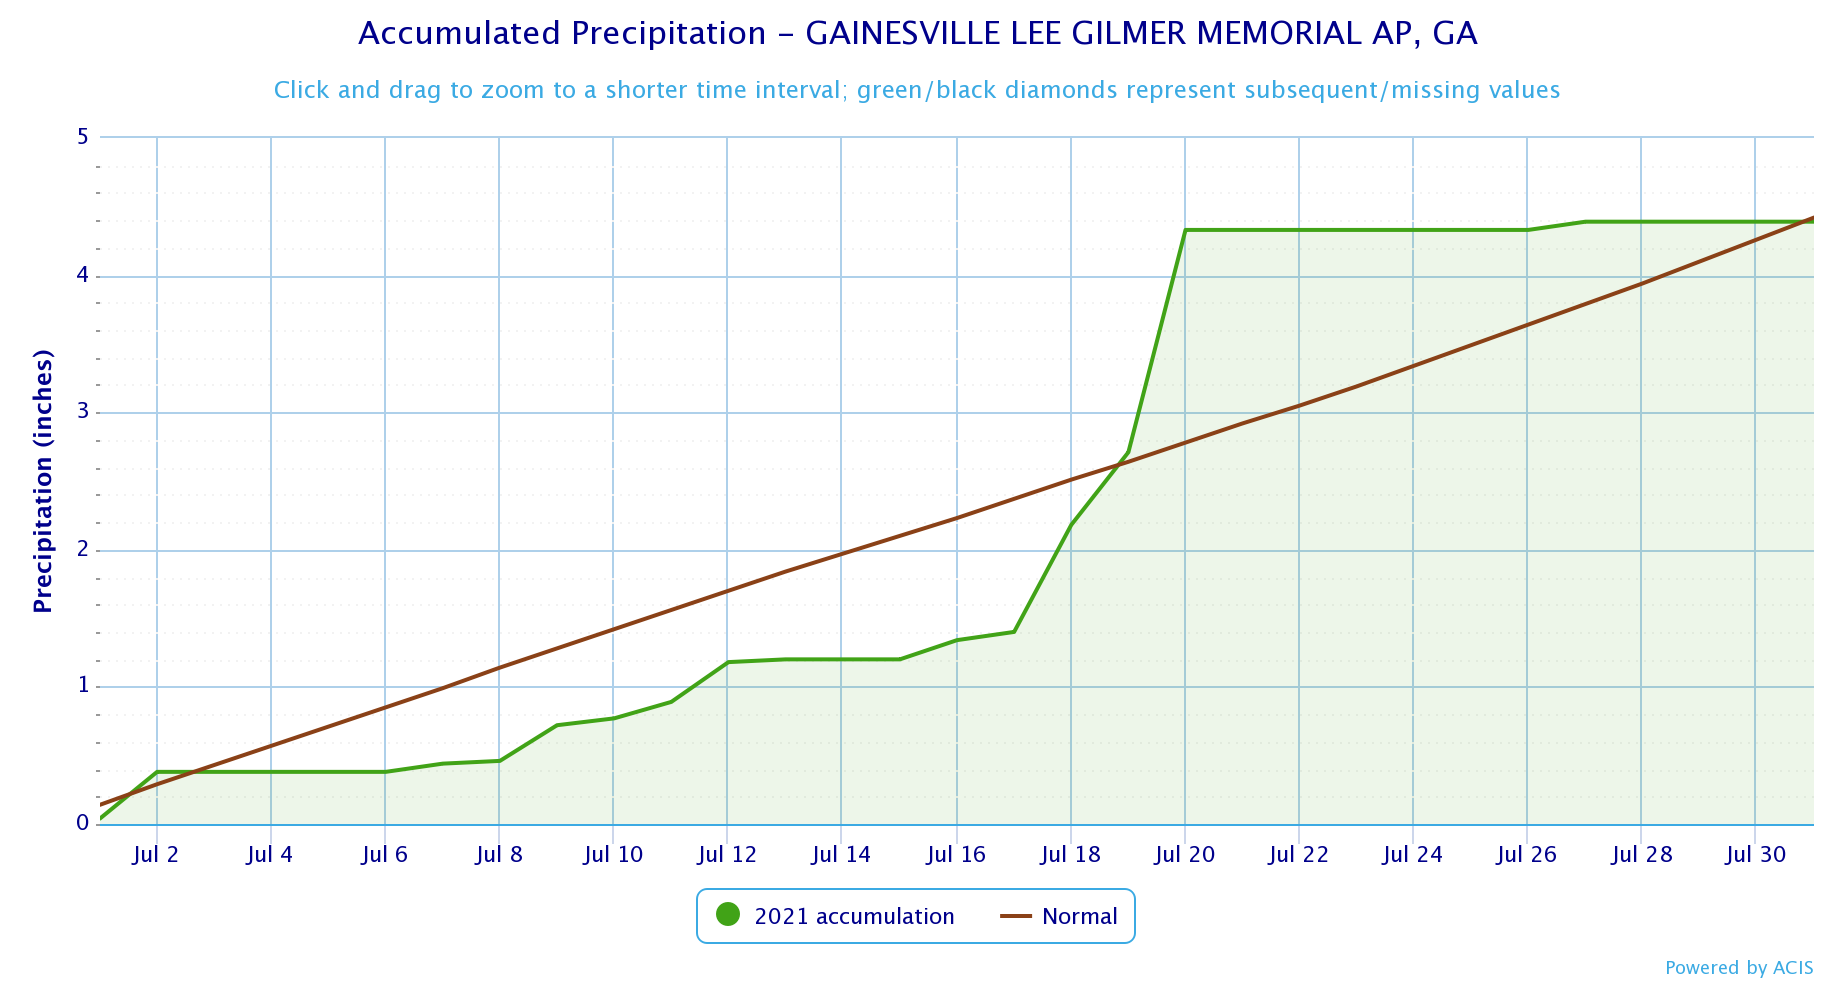
|
4.39
|
4.42
|
-0.03
|
|
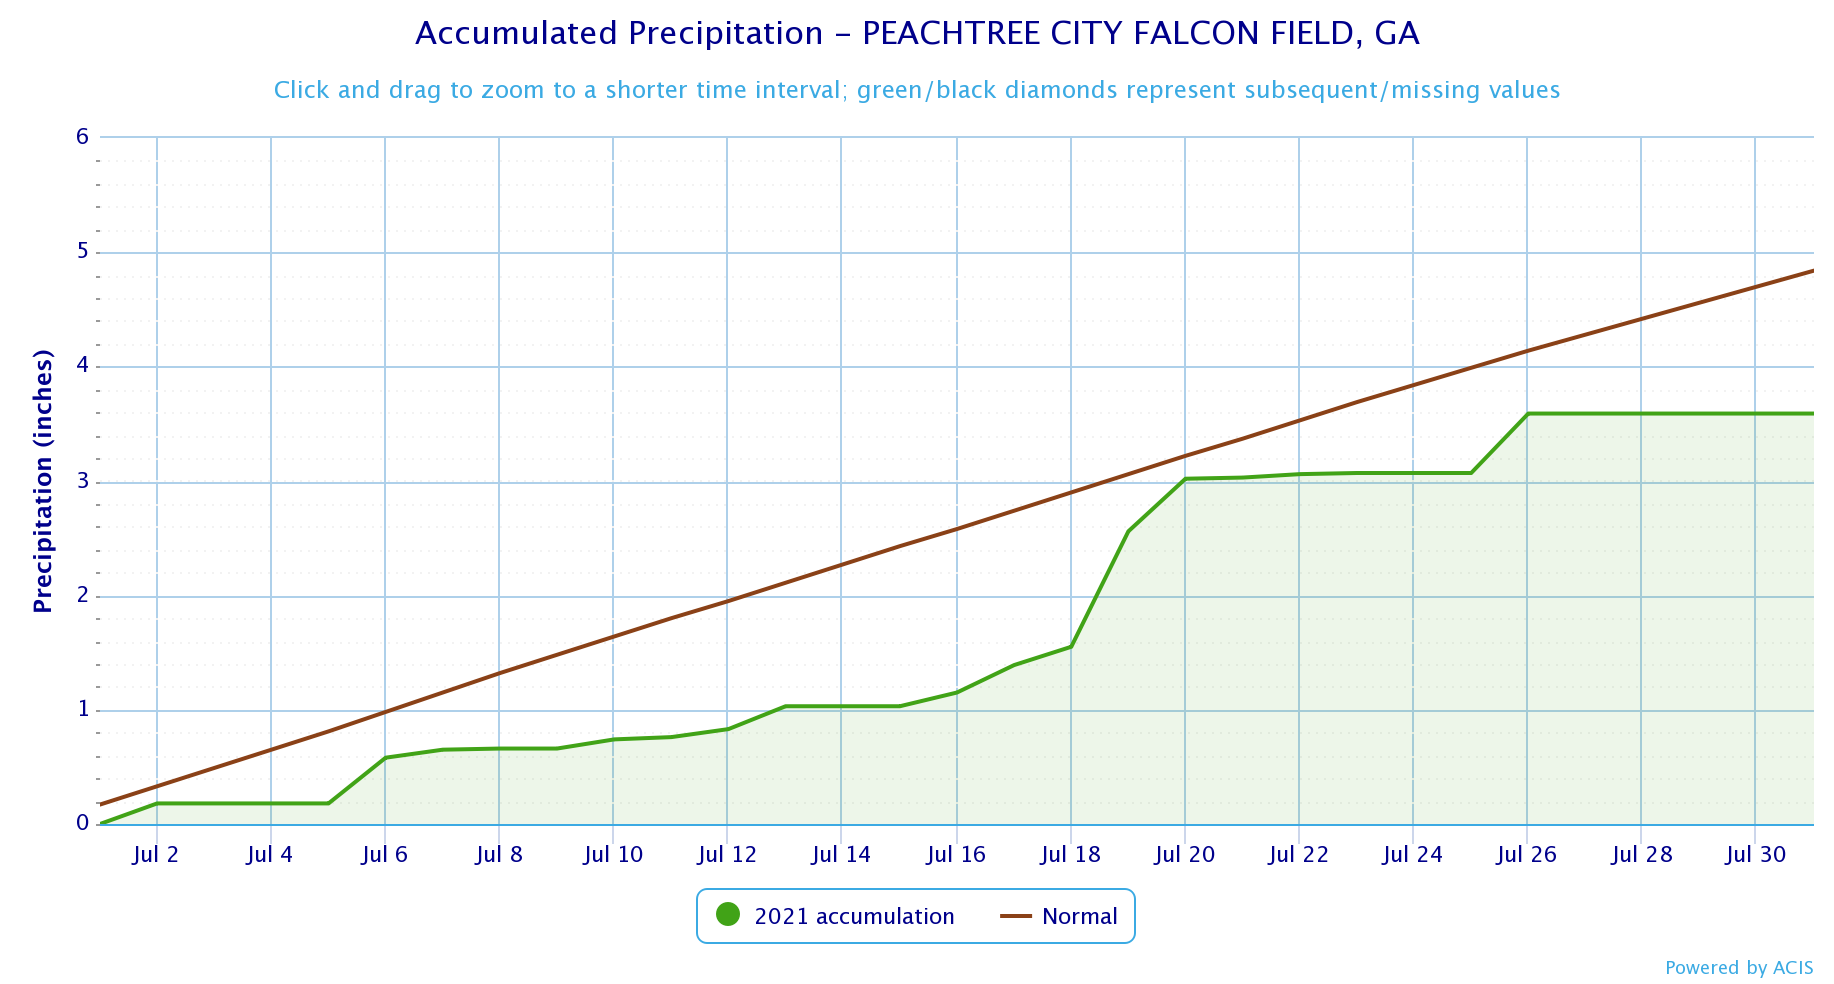
|
3.59
|
4.84
|
-1.25
|
|
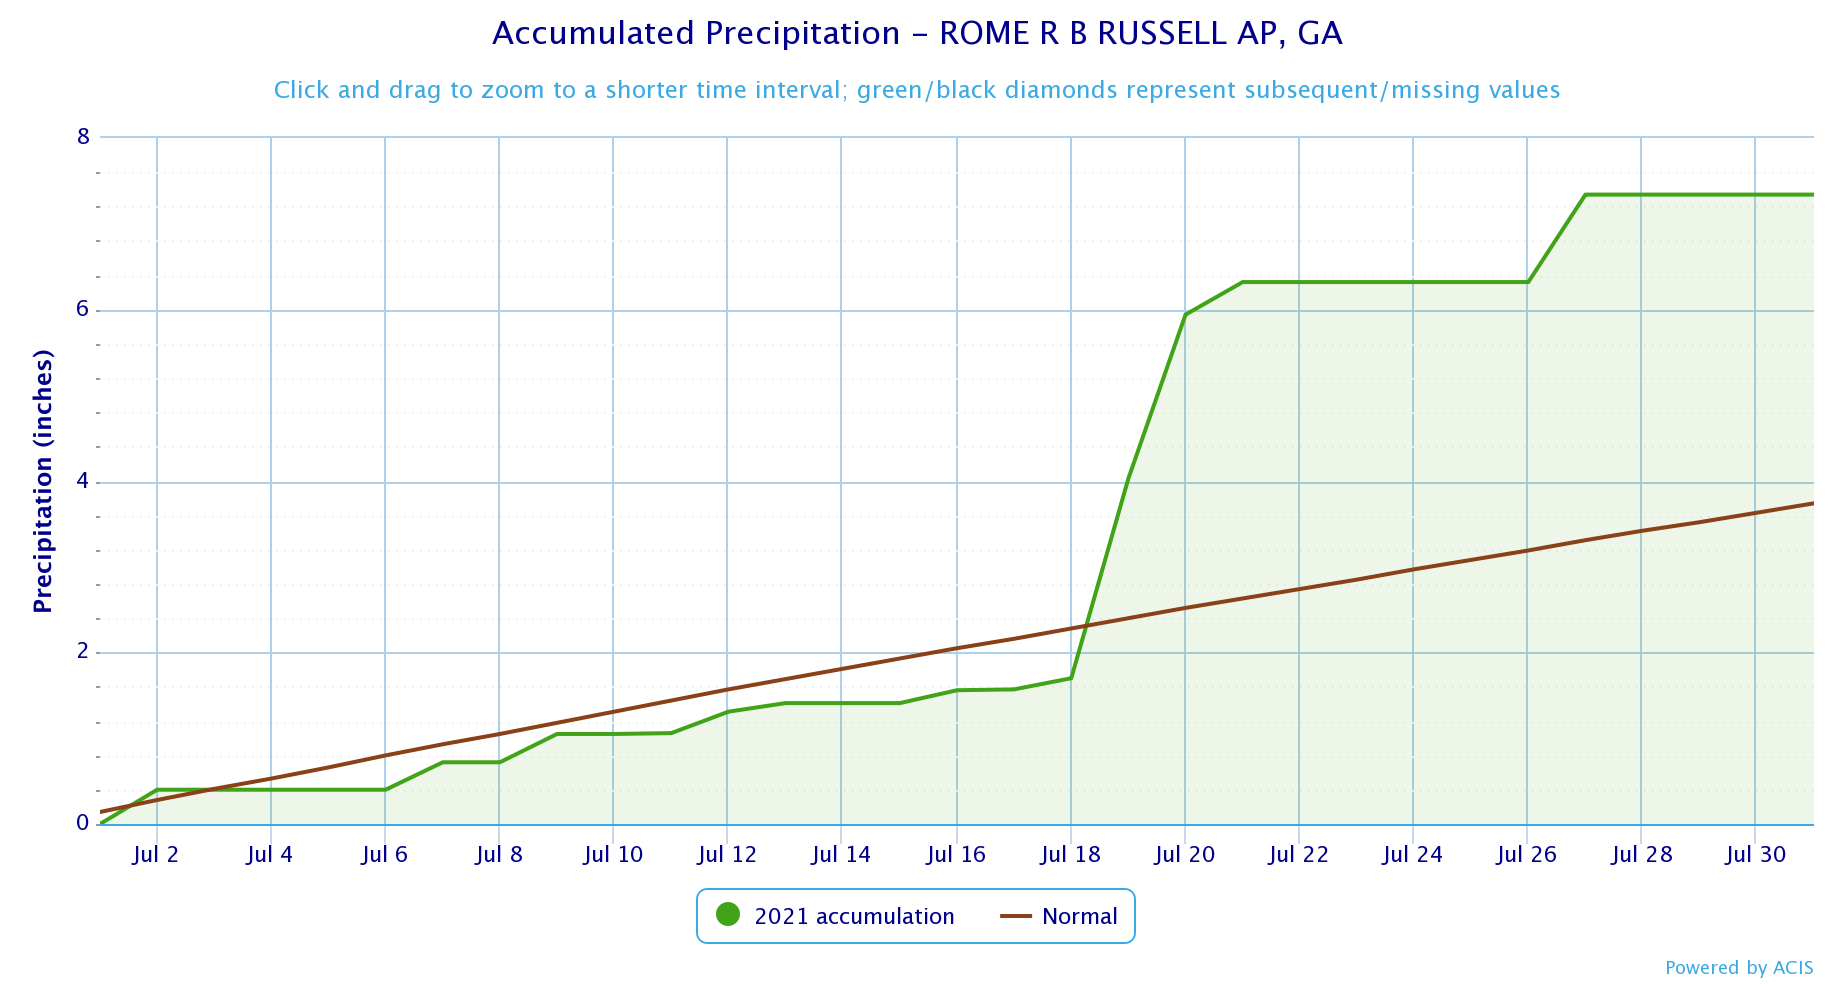
|
7.34
|
3.74
|
+3.60
|
|
|
July 2021 Precipitation Climate Statistics
|
||||
|
Climate Site |
Maximum Daily Precip |
Max P Date |
||
|
Athens
|
1.39
|
7/26
|
||
|
Atlanta
|
1.39
|
7/19
|
||
|
Columbus
|
0.88
|
7/12
|
||
|
Macon
|
1.62
|
7/6
|
||
|
Cartersville
|
1.87
|
7/18*
|
||
|
Dekalb Peachtree Arpt
|
2.41
|
7/23*
|
||
|
Fulton Co Arpt
|
1.65
|
7/10
|
||
|
Gainesville
|
1.62
|
7/20
|
||
|
Peachtree City
|
1.01
|
7/19
|
||
|
Rome
|
2.33
|
7/19
|
||
*Indicates a daily record was set
Data prepared by NWS Peachtree City/Atlanta
Temperature Maps |
Precipitation Maps
|
Temperature Graphs
|
Precipitation Graphs |

|
July 2021 Climate Records
|
|||
|
Date
|
Type
|
Location
|
Record
|
|
7/28
|
Highest Min Temp
|
Columbus
|
A minimum temperature of 80 degrees was reached. This breaks the previous record of 77 degrees, last set in 2014.
|
|
7/29
|
Highest Min Temp
|
Atlanta
|
A minimum temperature of 77 degrees was reached. This ties the previous record of 77 degrees, last set in 1993.
|
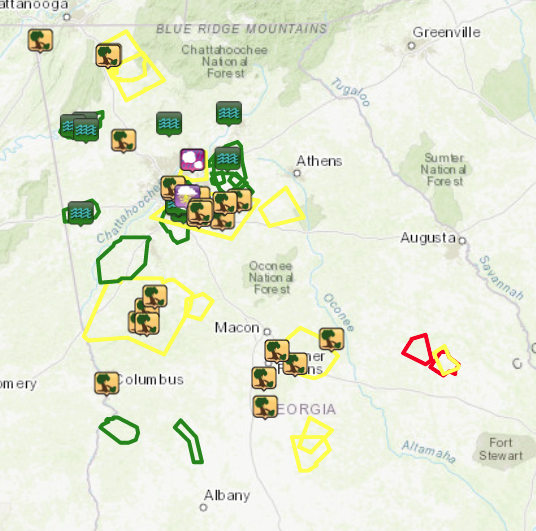
July 2021 Warnings and Local Storm Reports
Based on the Climate Prediction Center's outlook for August, all of north and central Georgia has a equal chances for above, below or near normal temperatures. For precipitation, all of north and central Georgia has a 40% to 50% chance of above normal precipitation.
Data prepared by NWS Peachtree City/Atlanta.

