| Previous Month | Next Month |
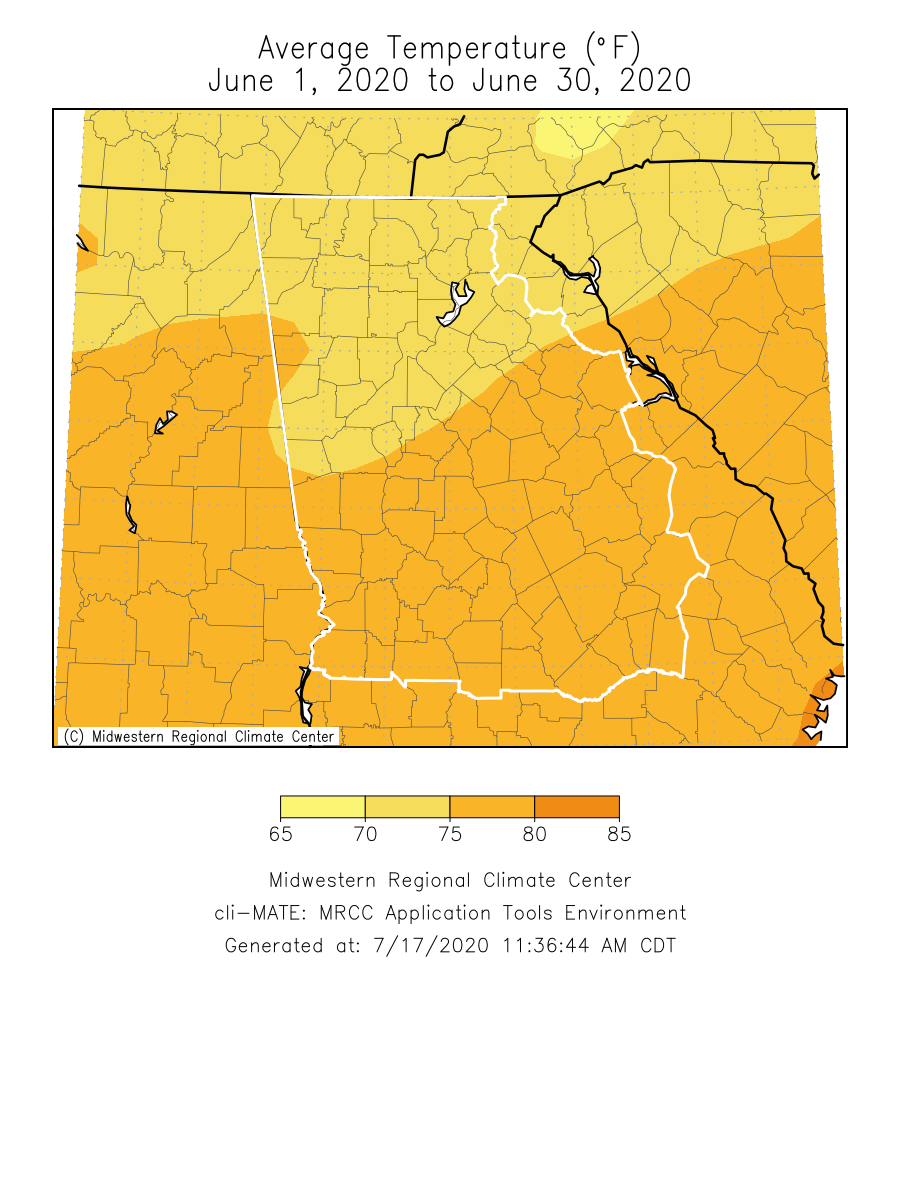
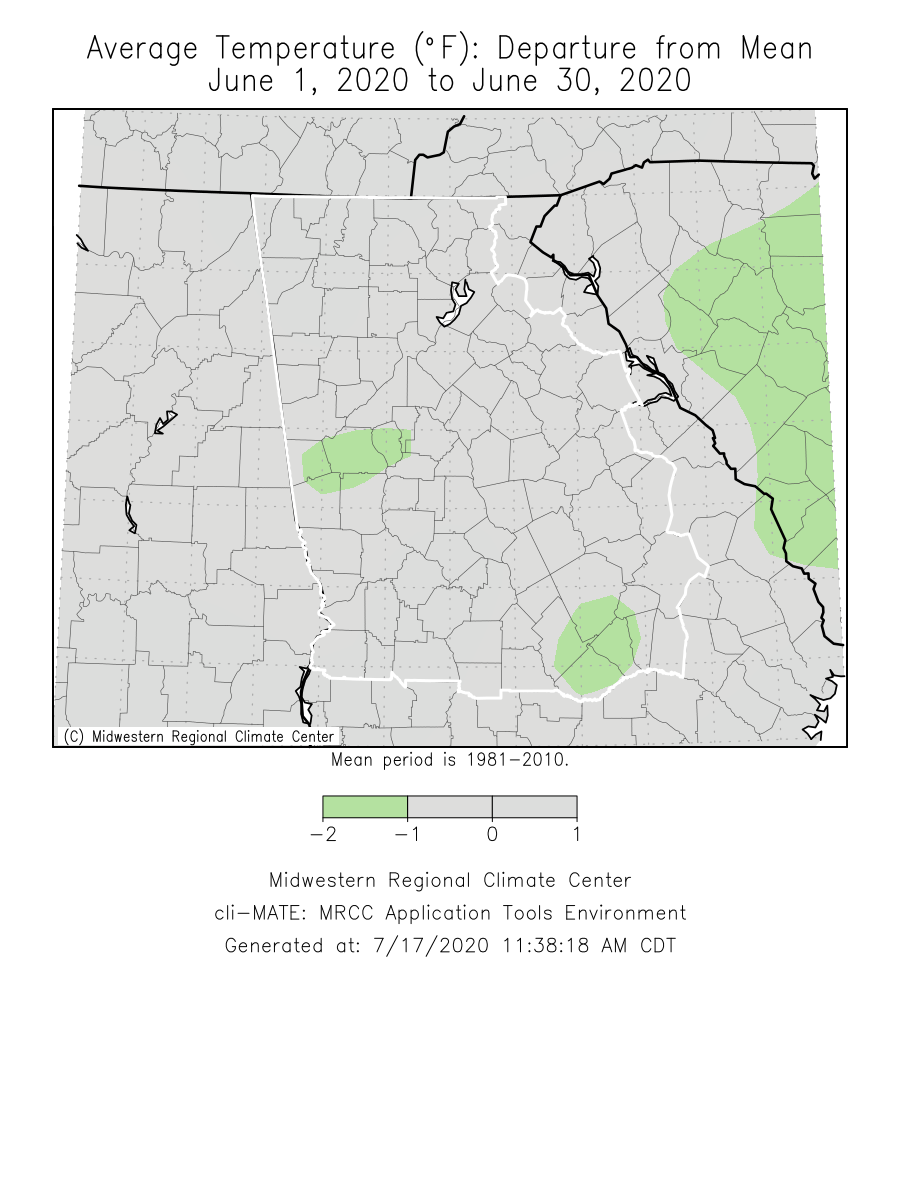
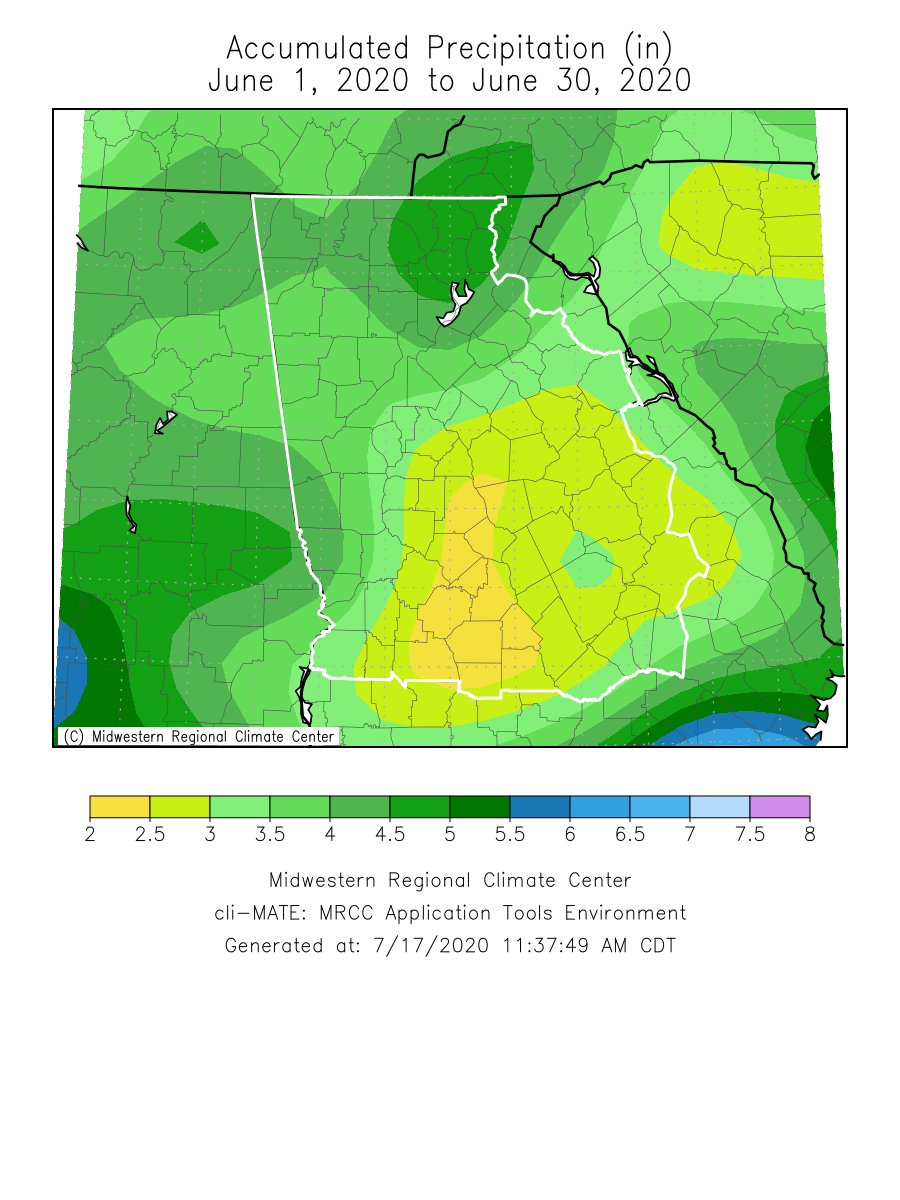
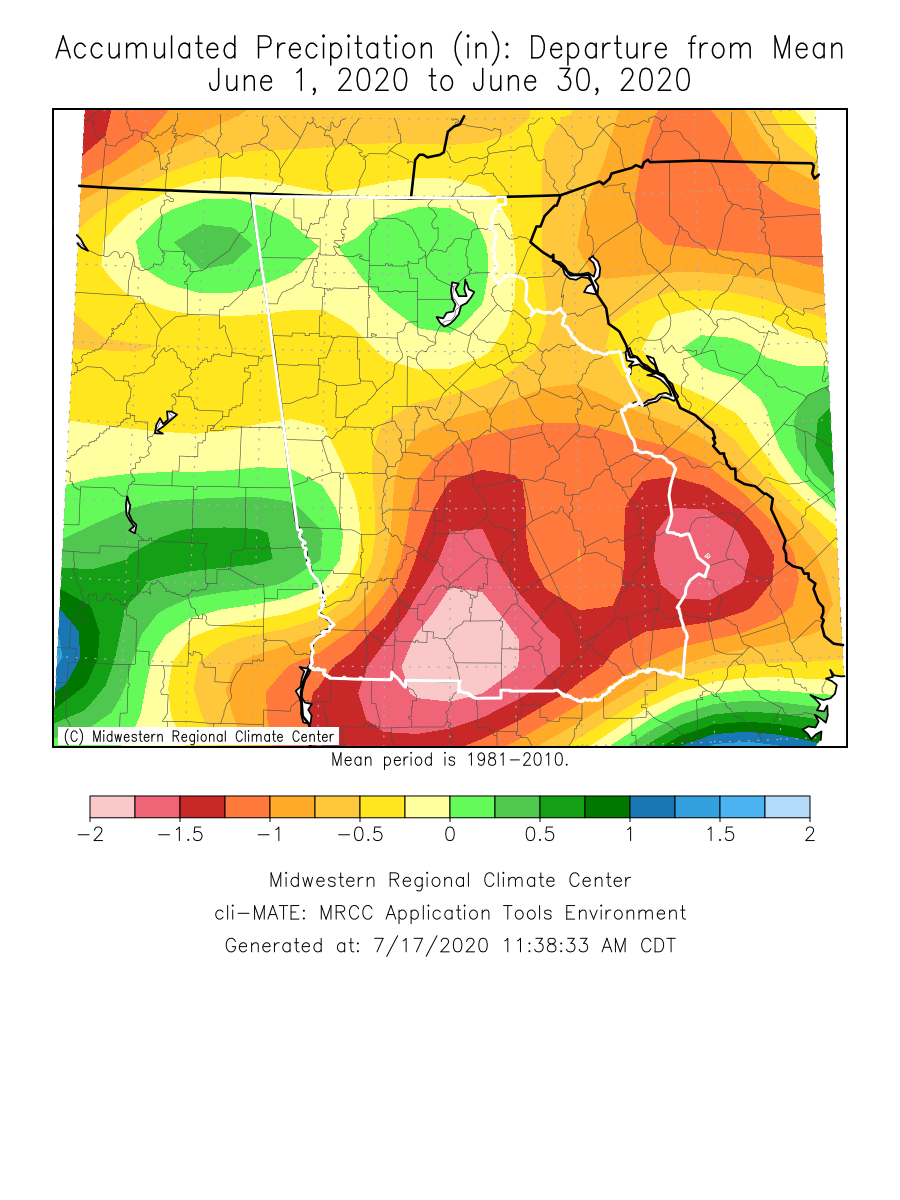
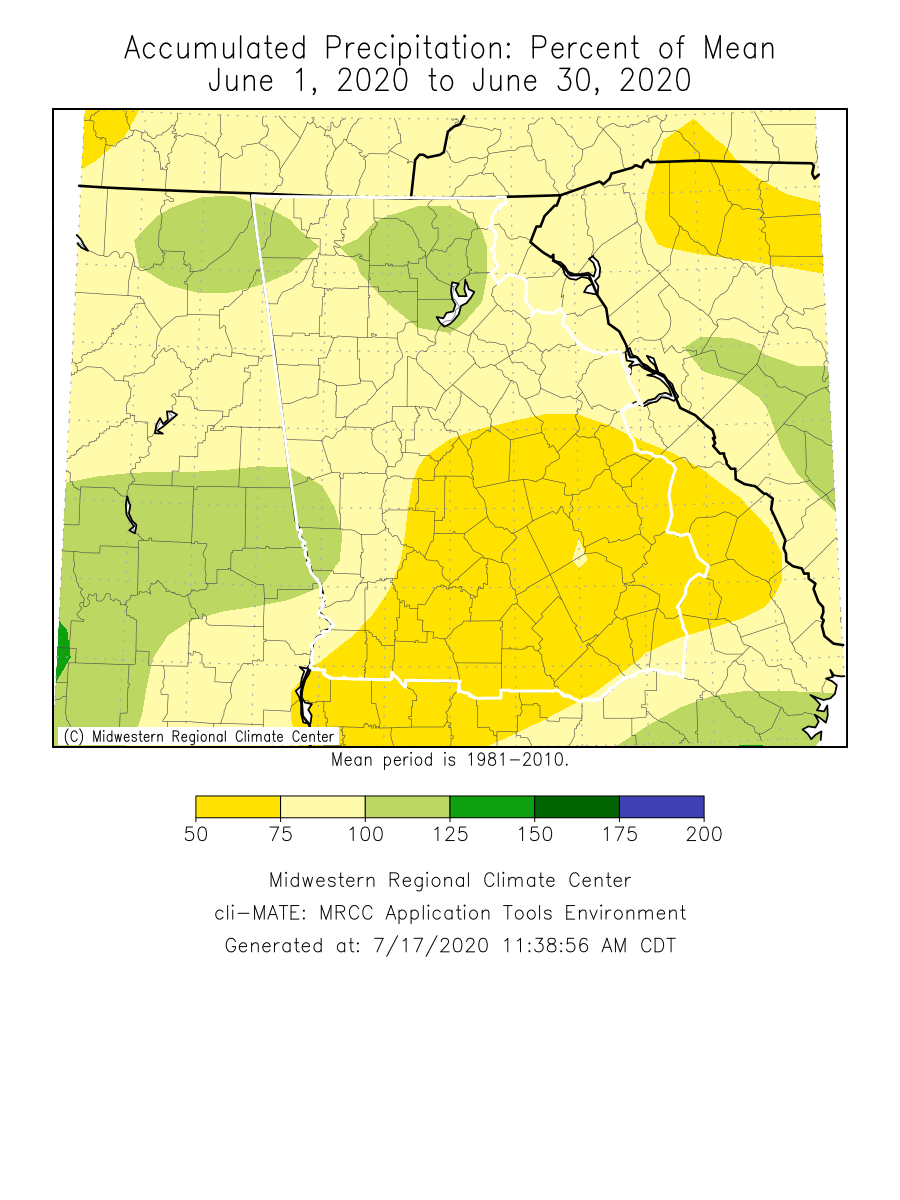
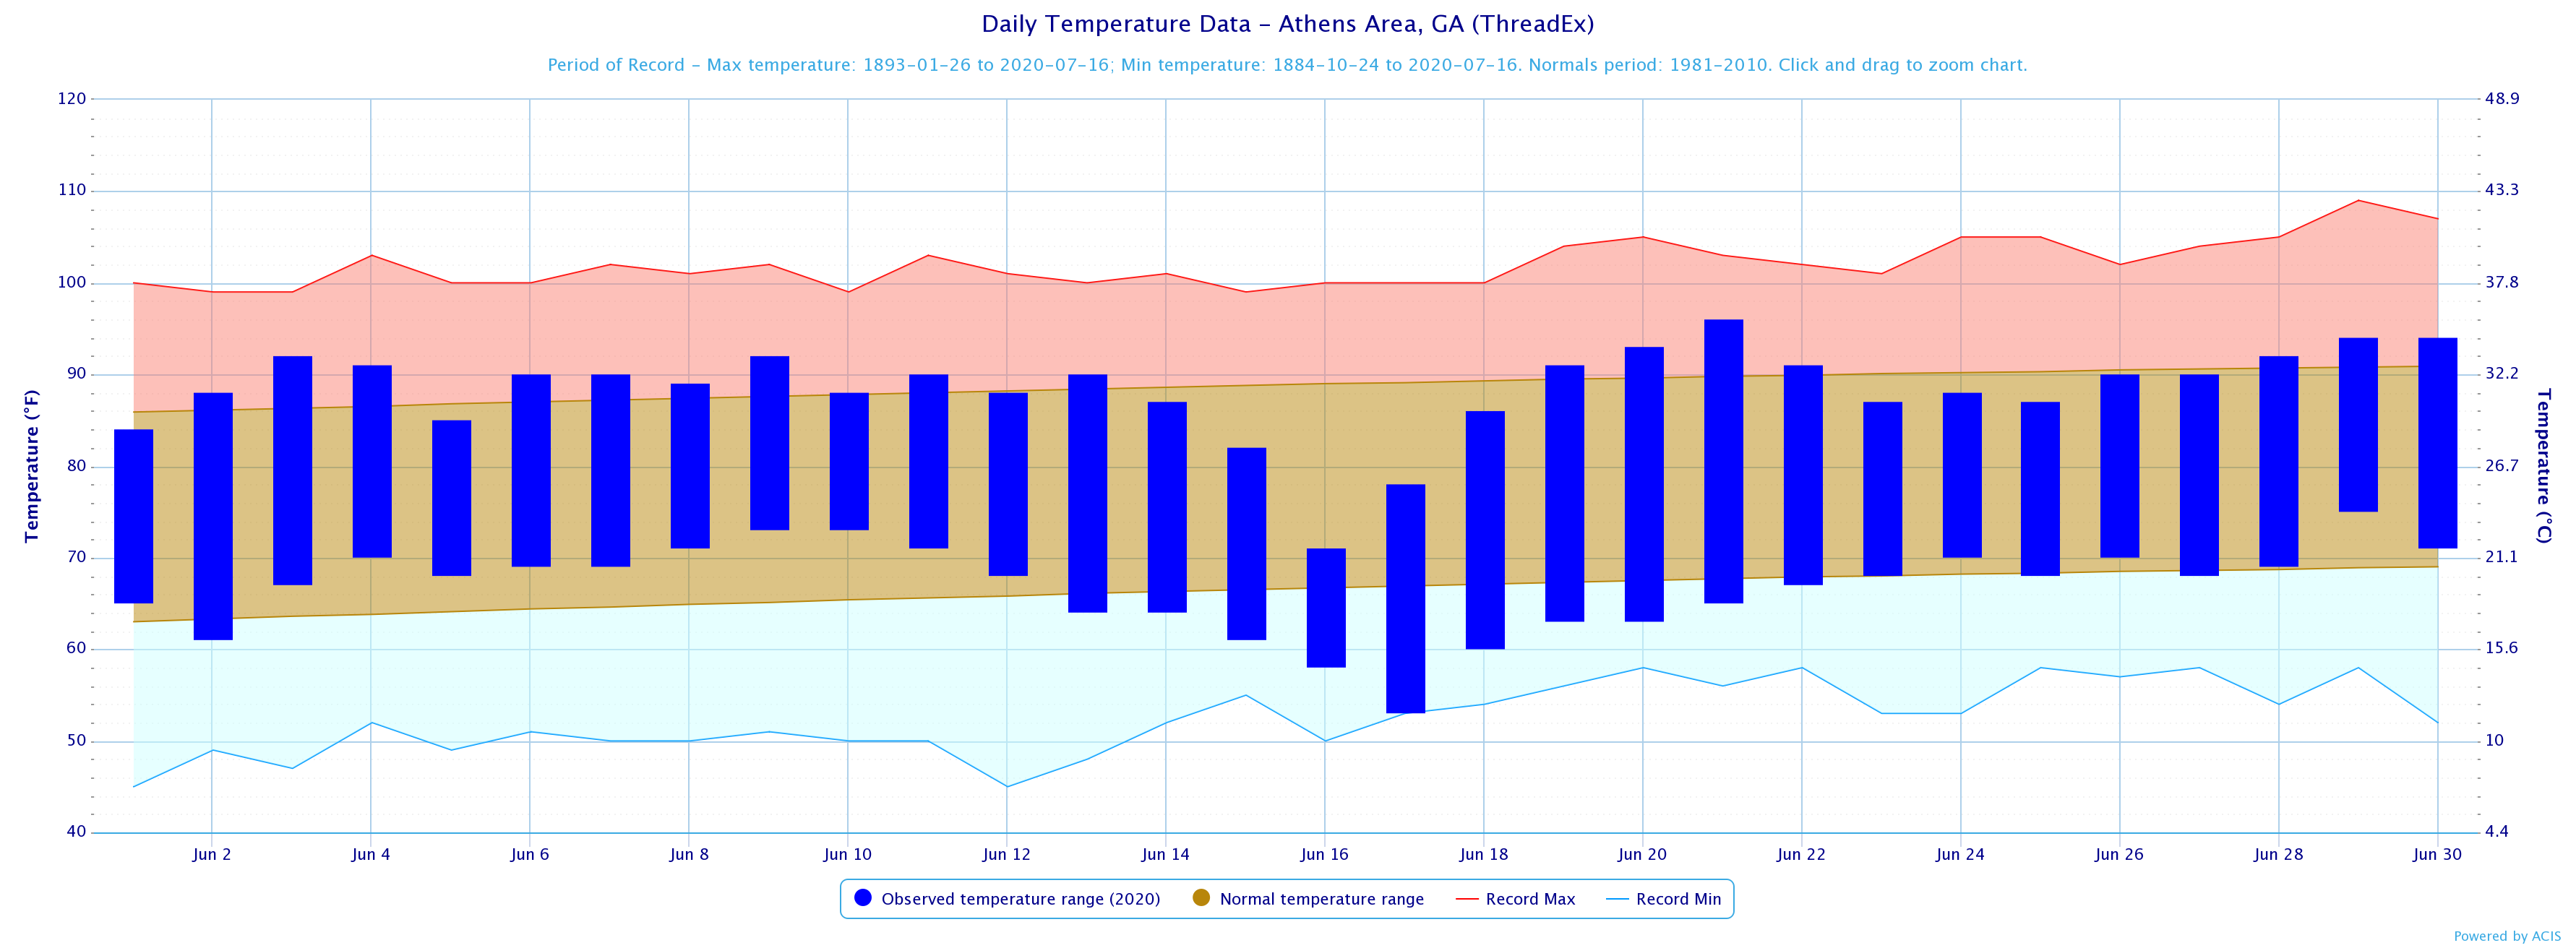
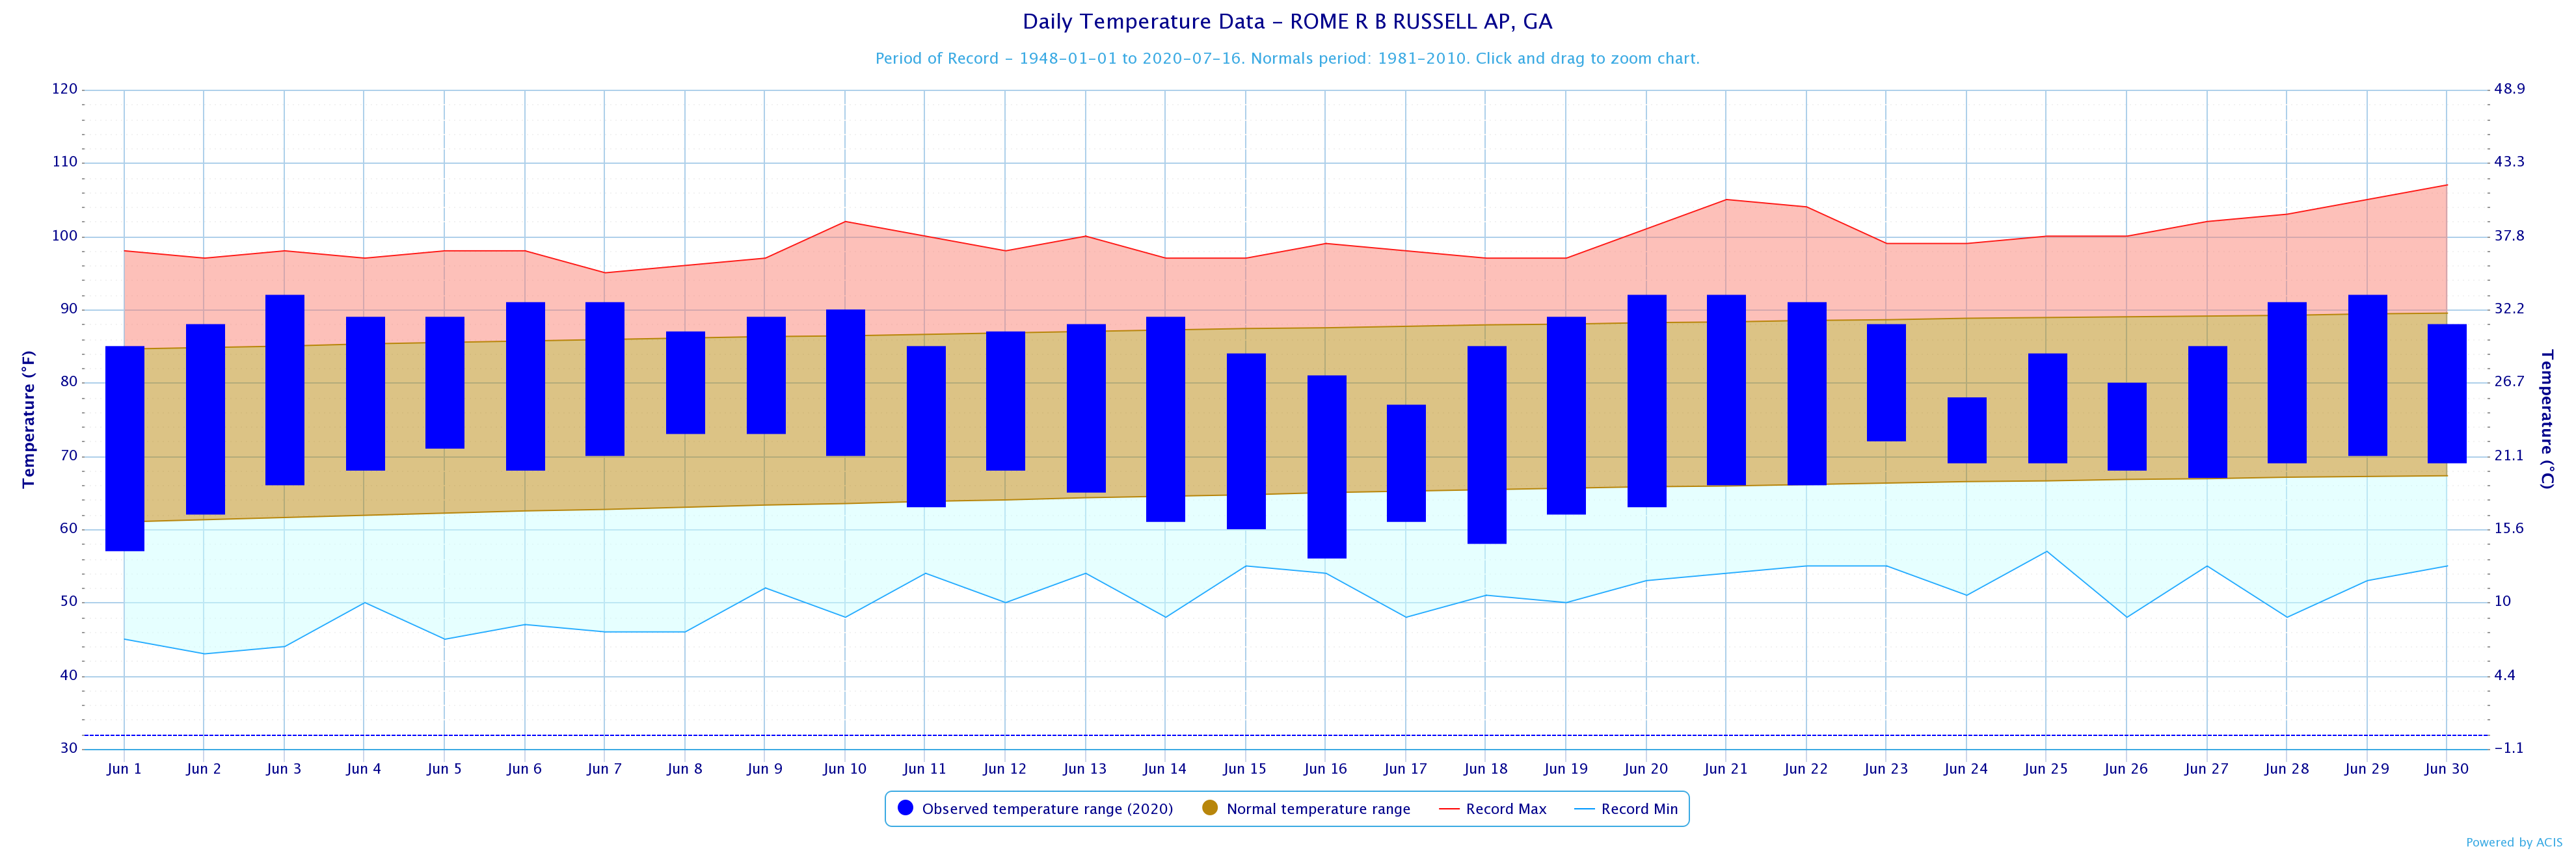
Temperatures through the month of June were around 0 to 1 degree cooler than normal. Precipitation through the month of June was around 0 to 1.5 inches below normal.
| June Rankings |
| Ranks | Temperatures | Precipitation |
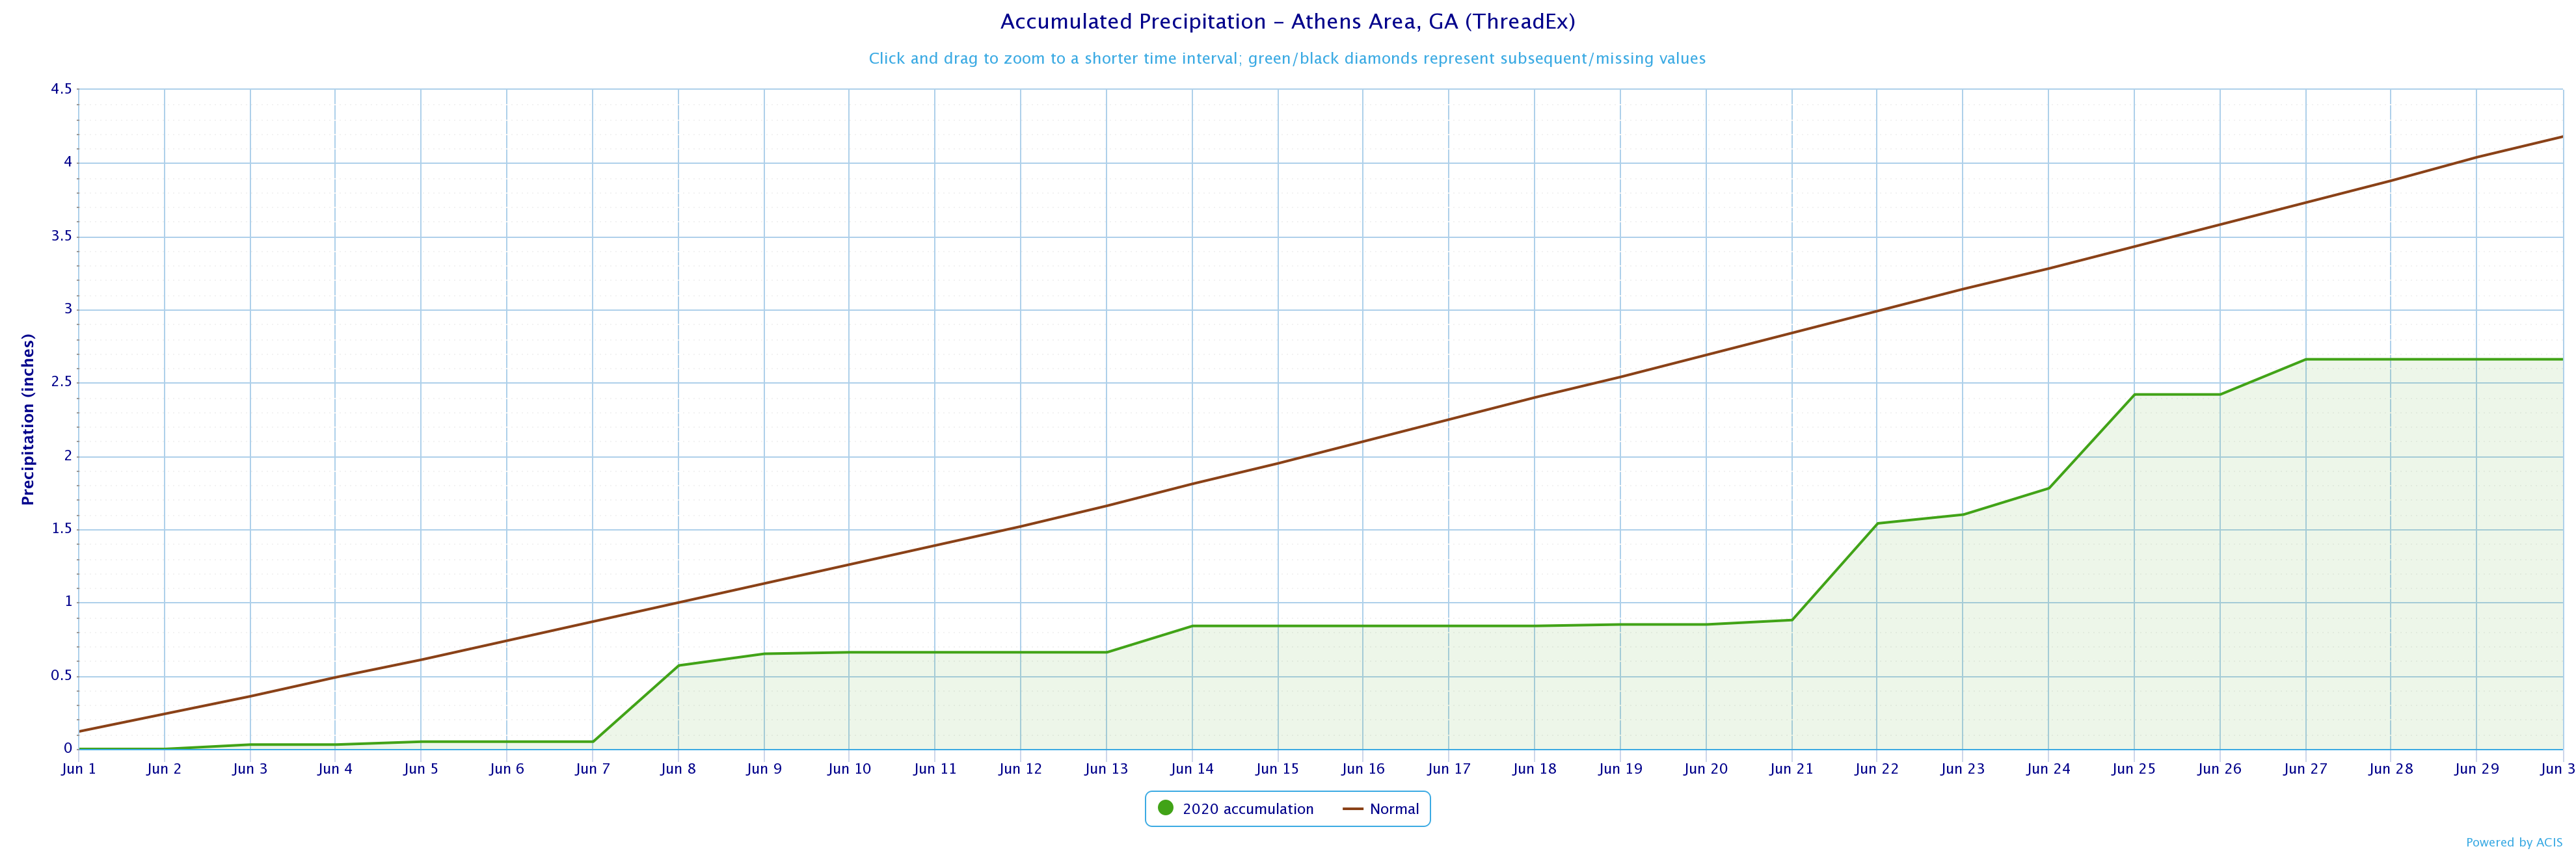
| Athens | 31st Warmest | 26th Driest |
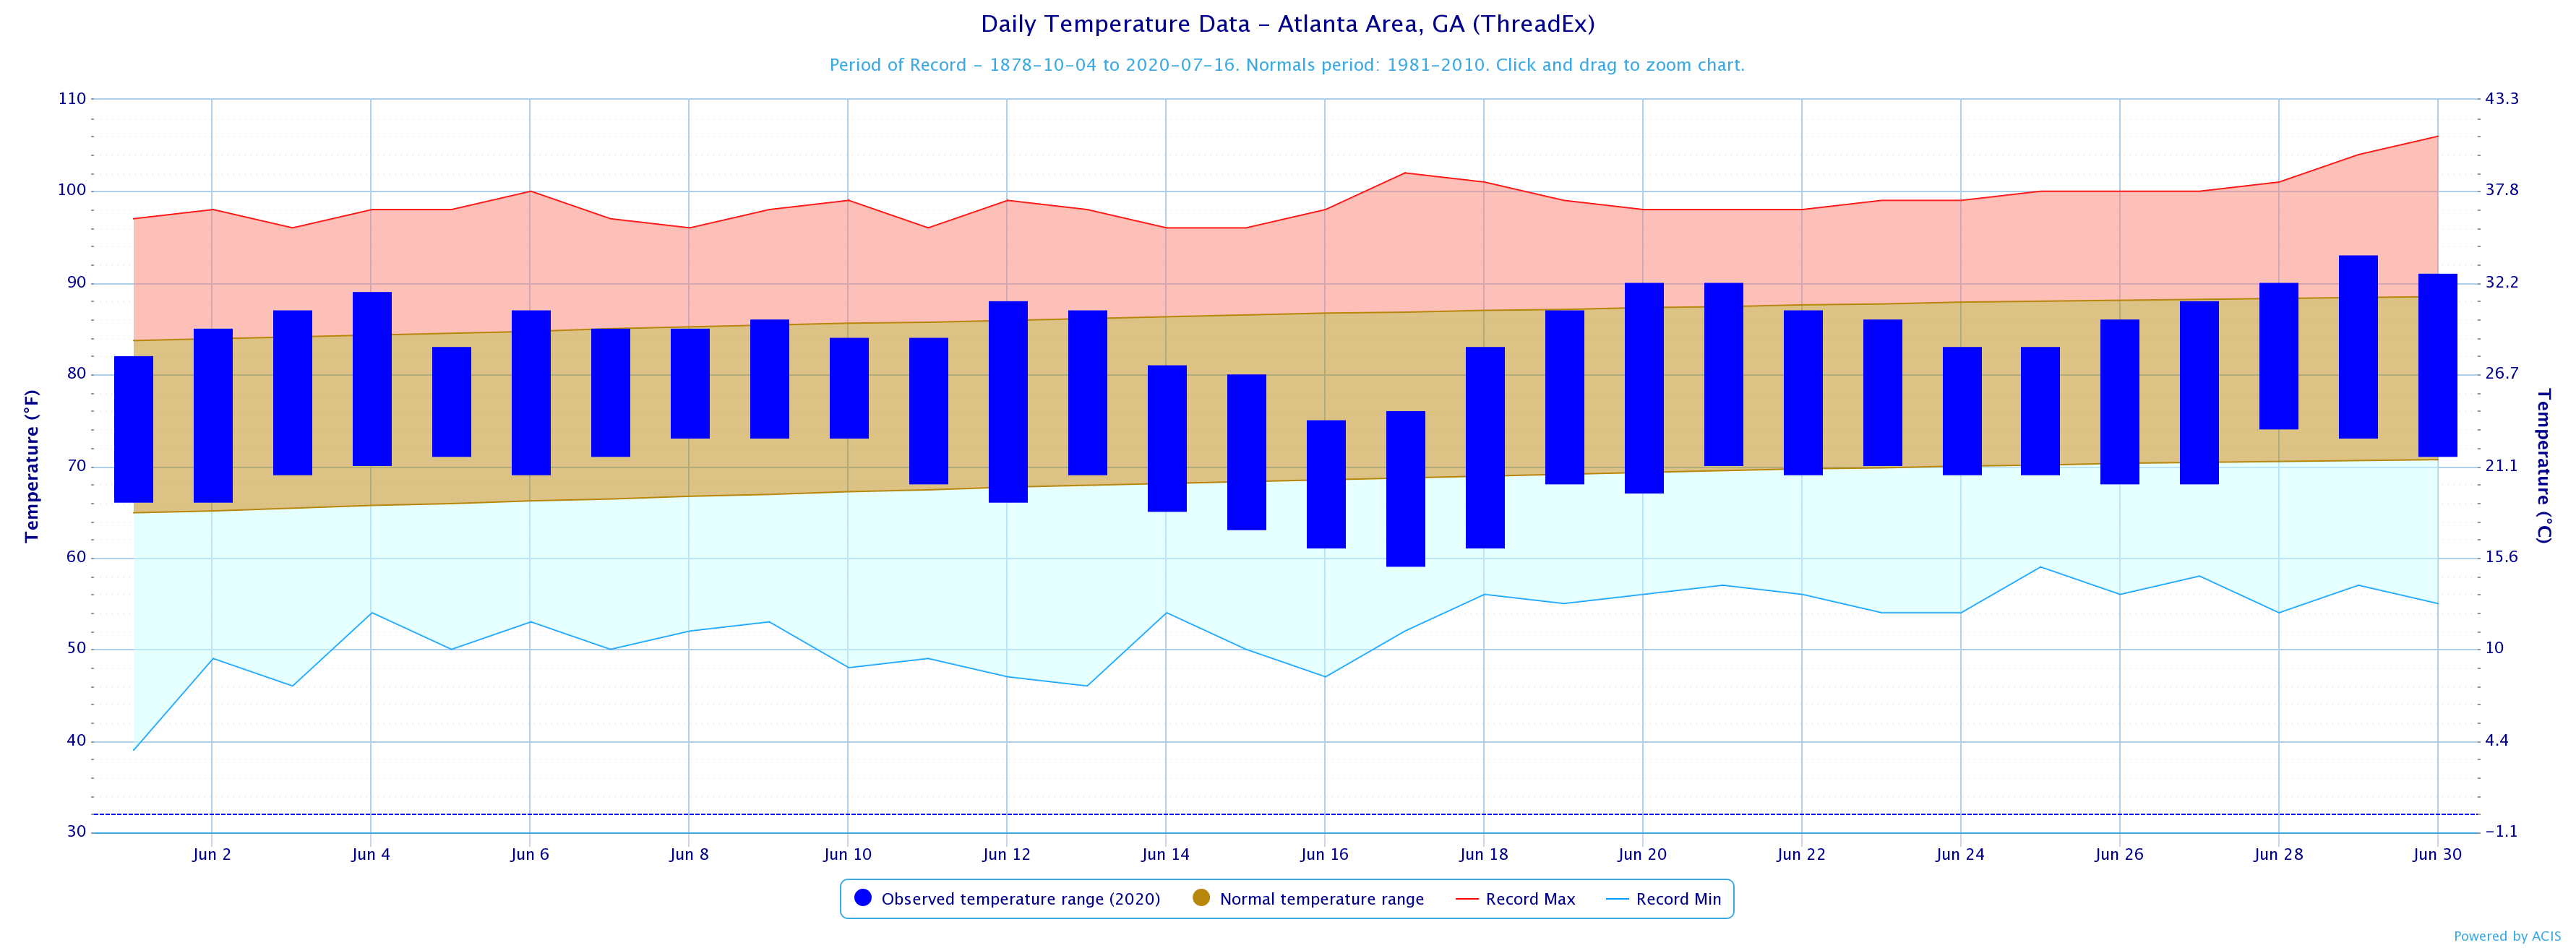
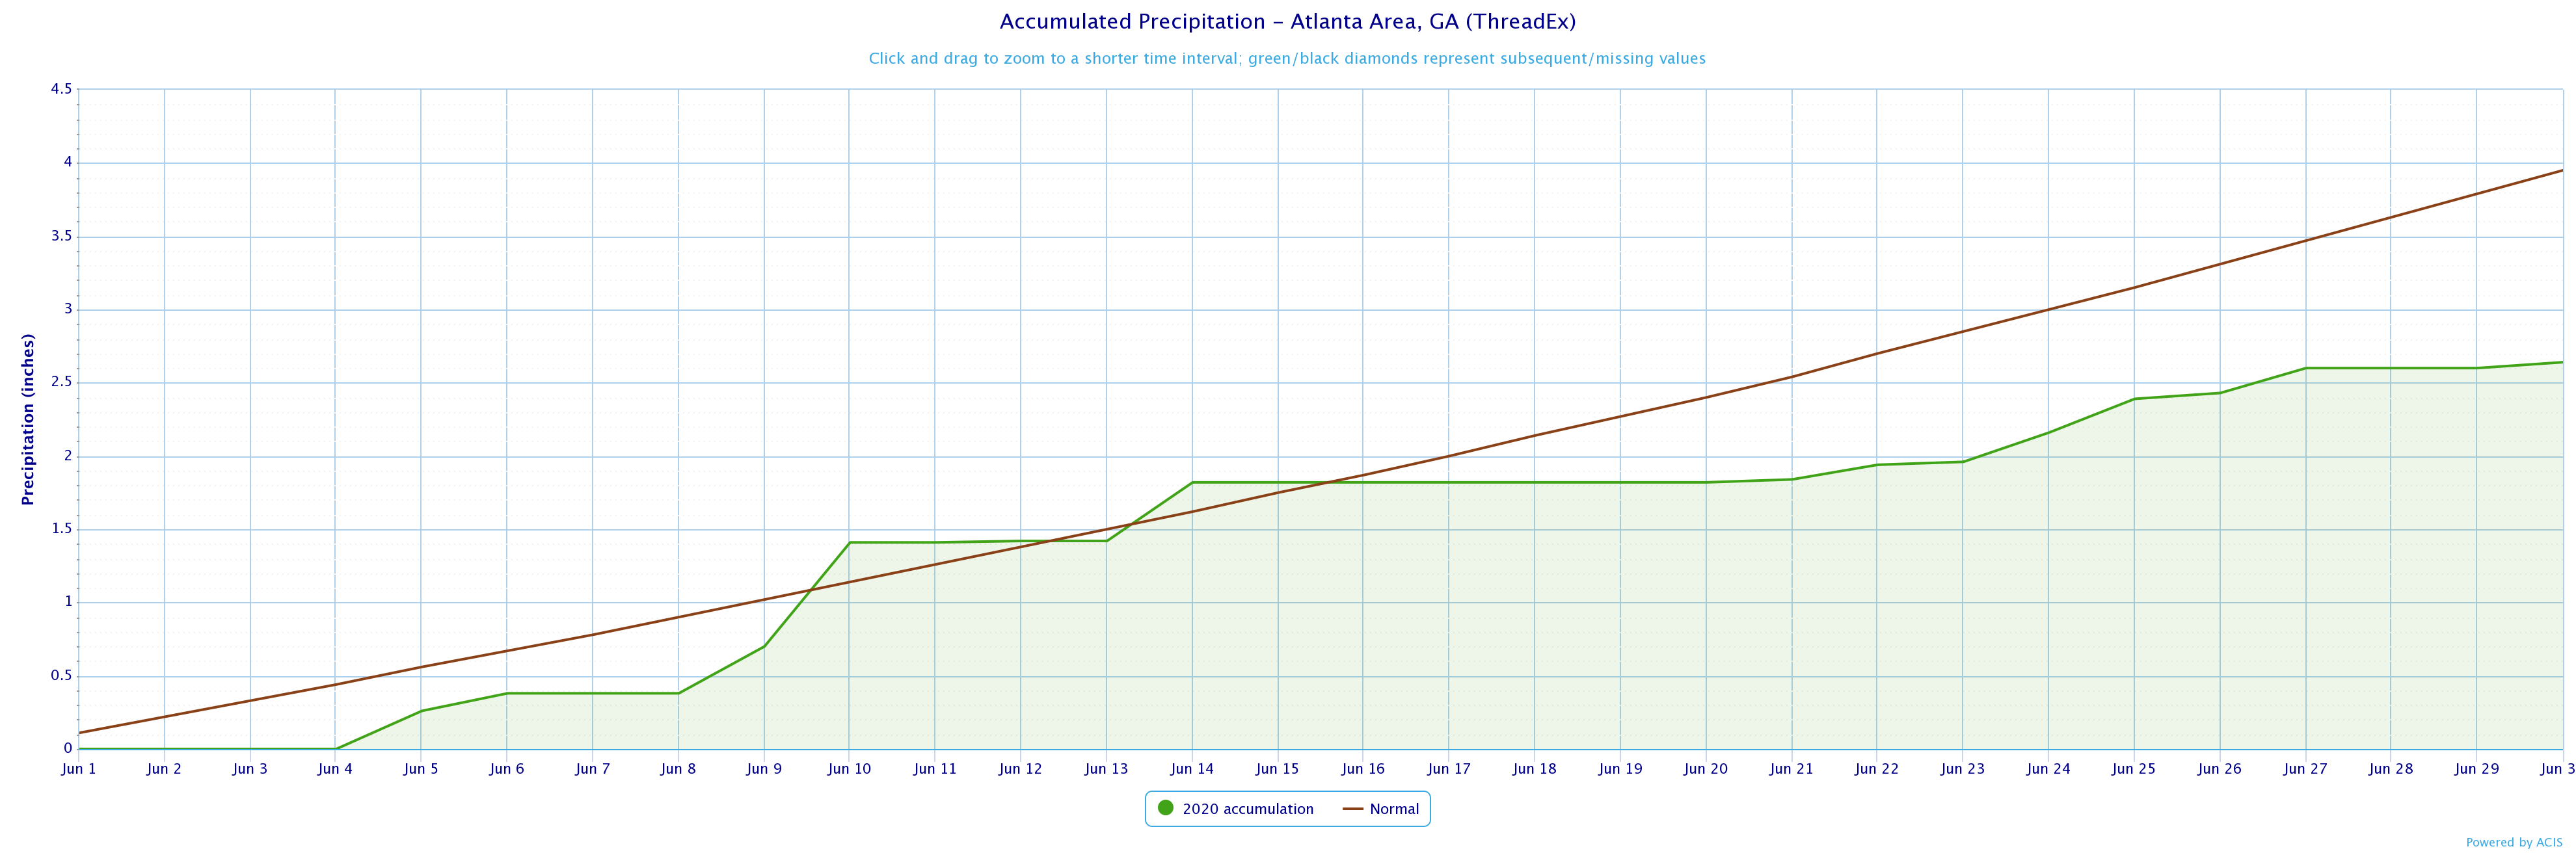
| Atlanta | 37th Coolest | 28th Driest |
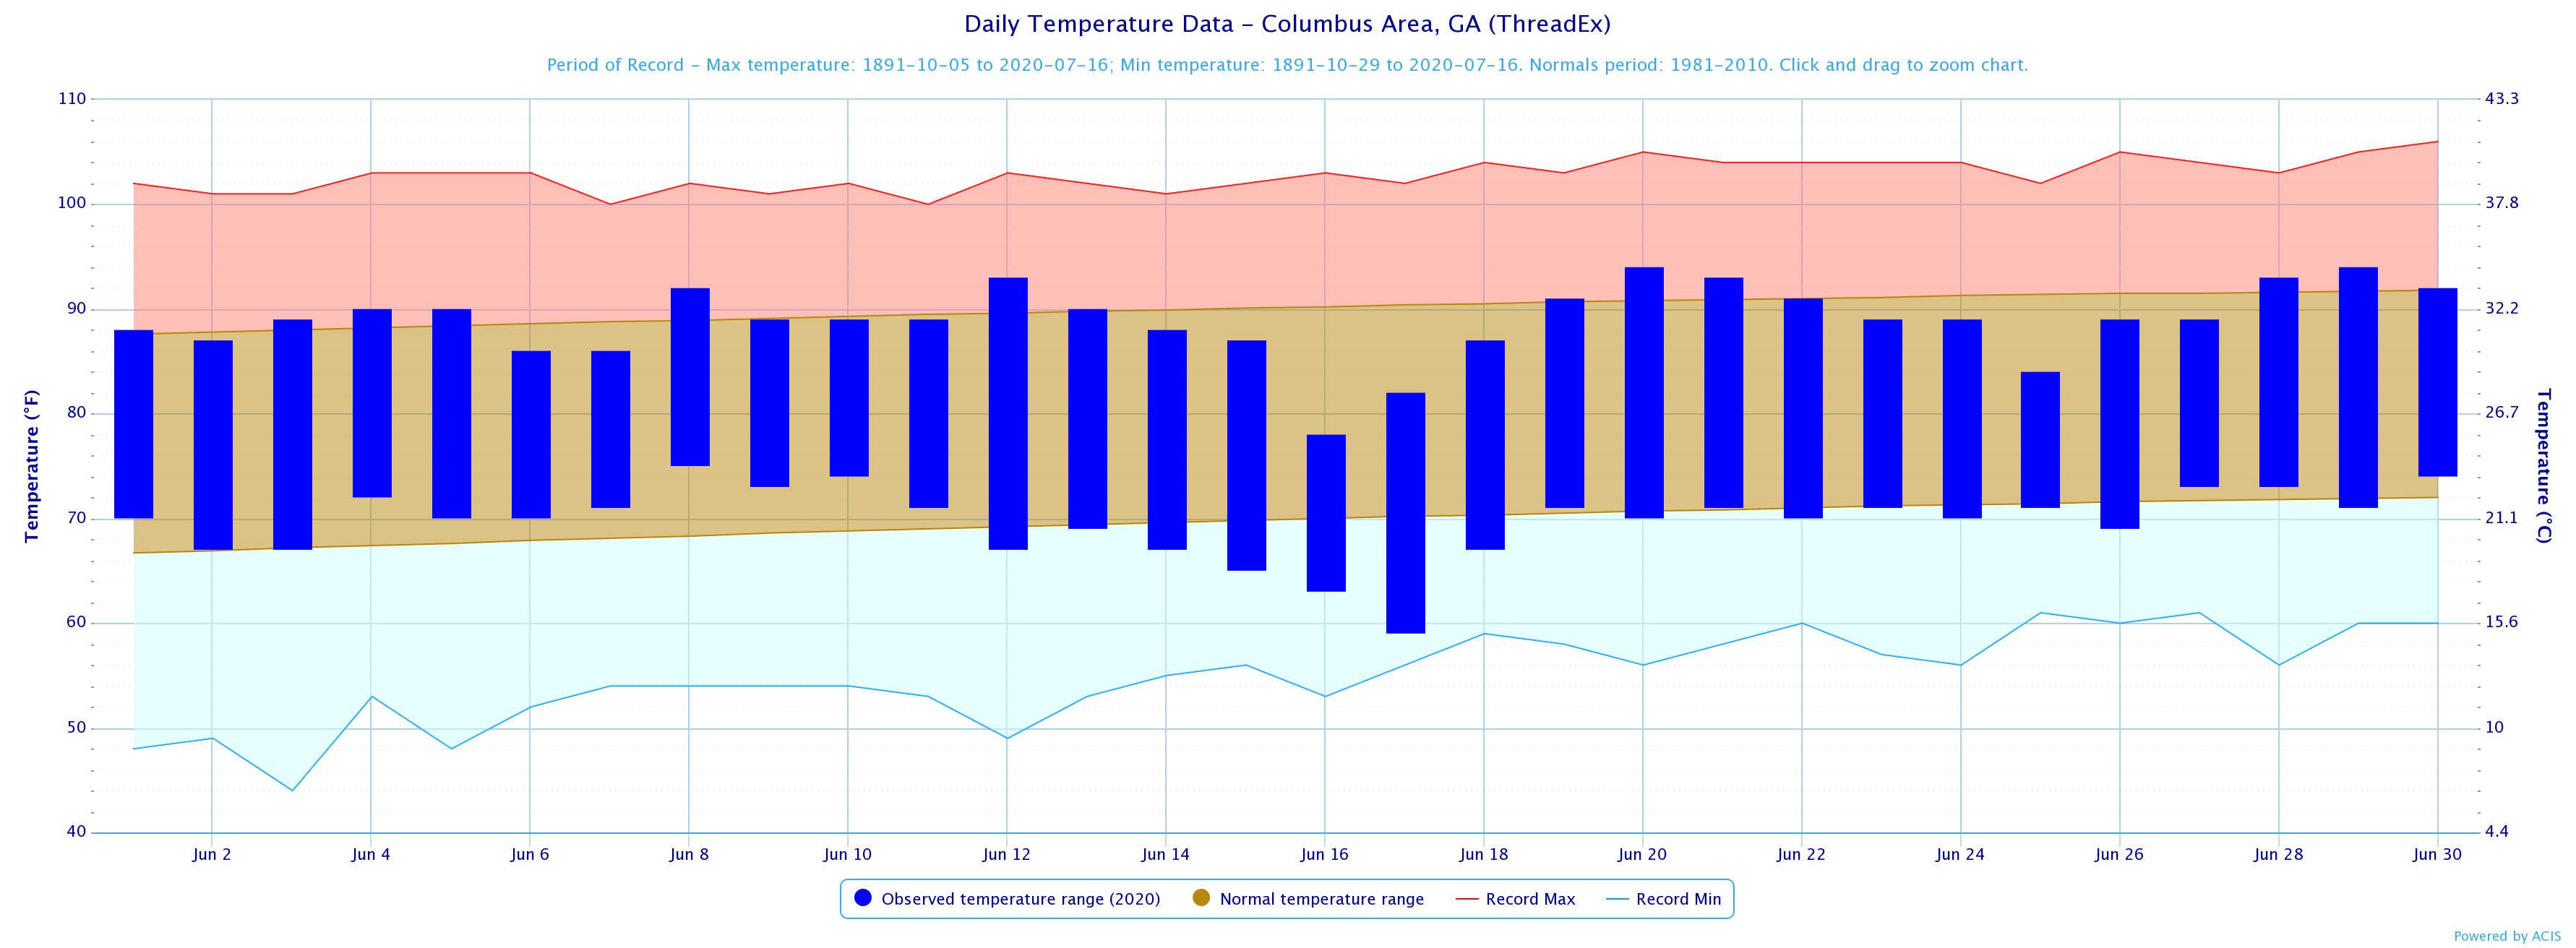
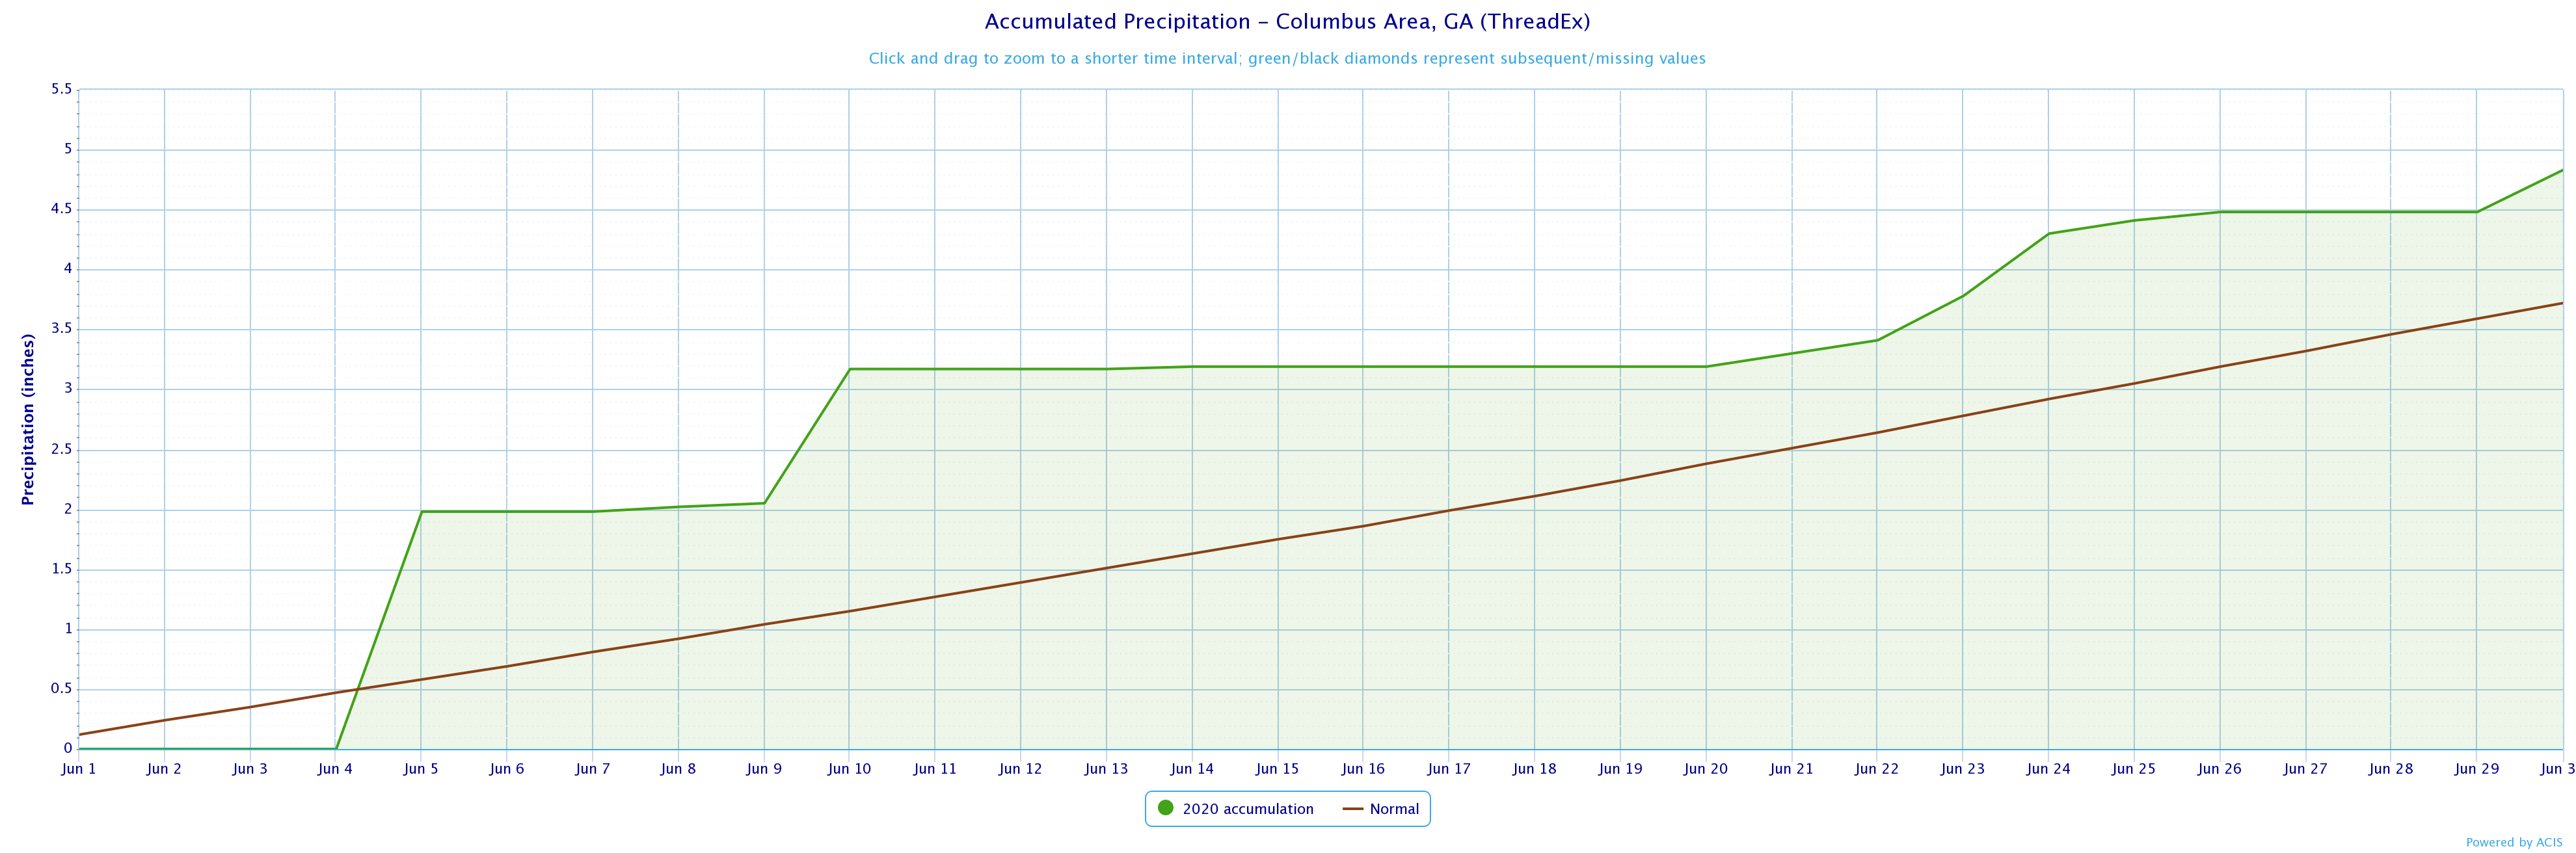
| Columbus | 33rd Coolest | 21st Wettest |
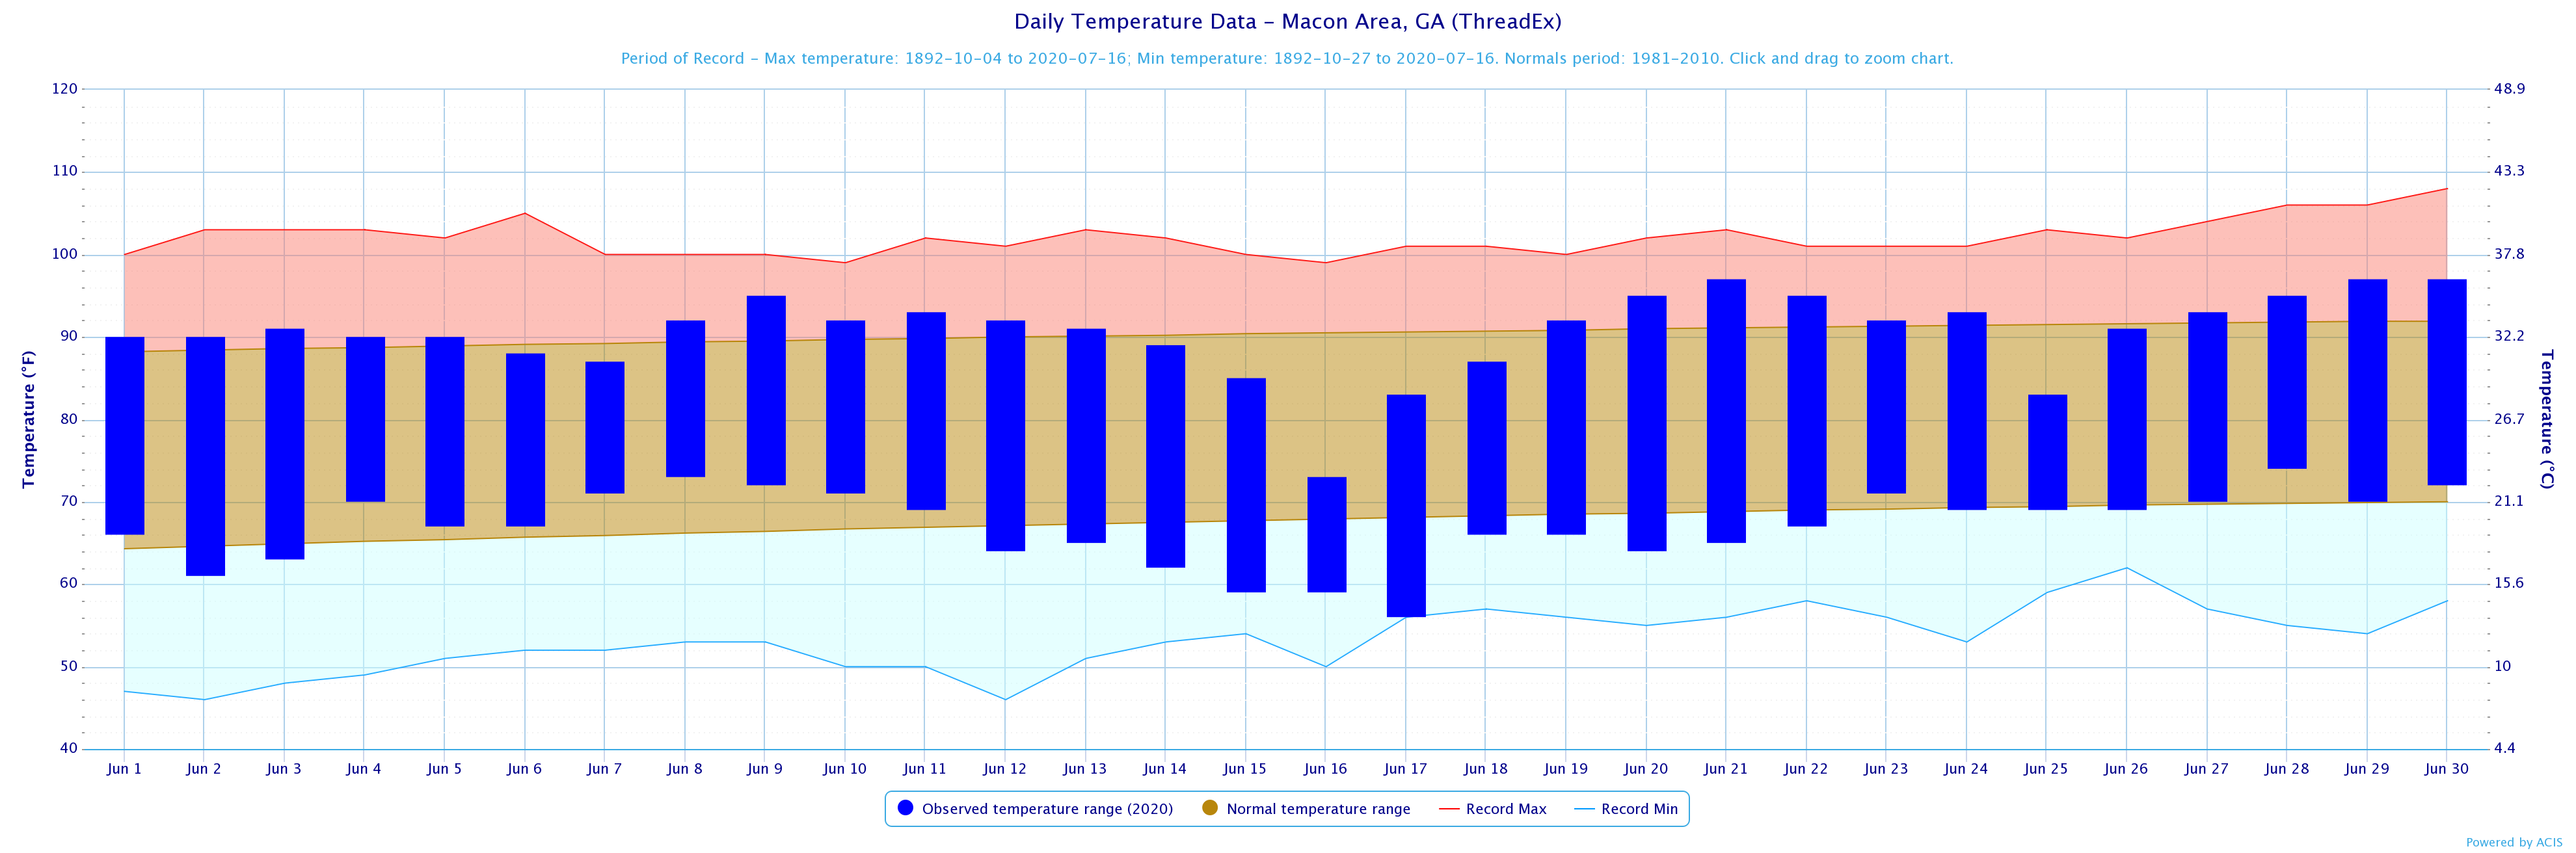
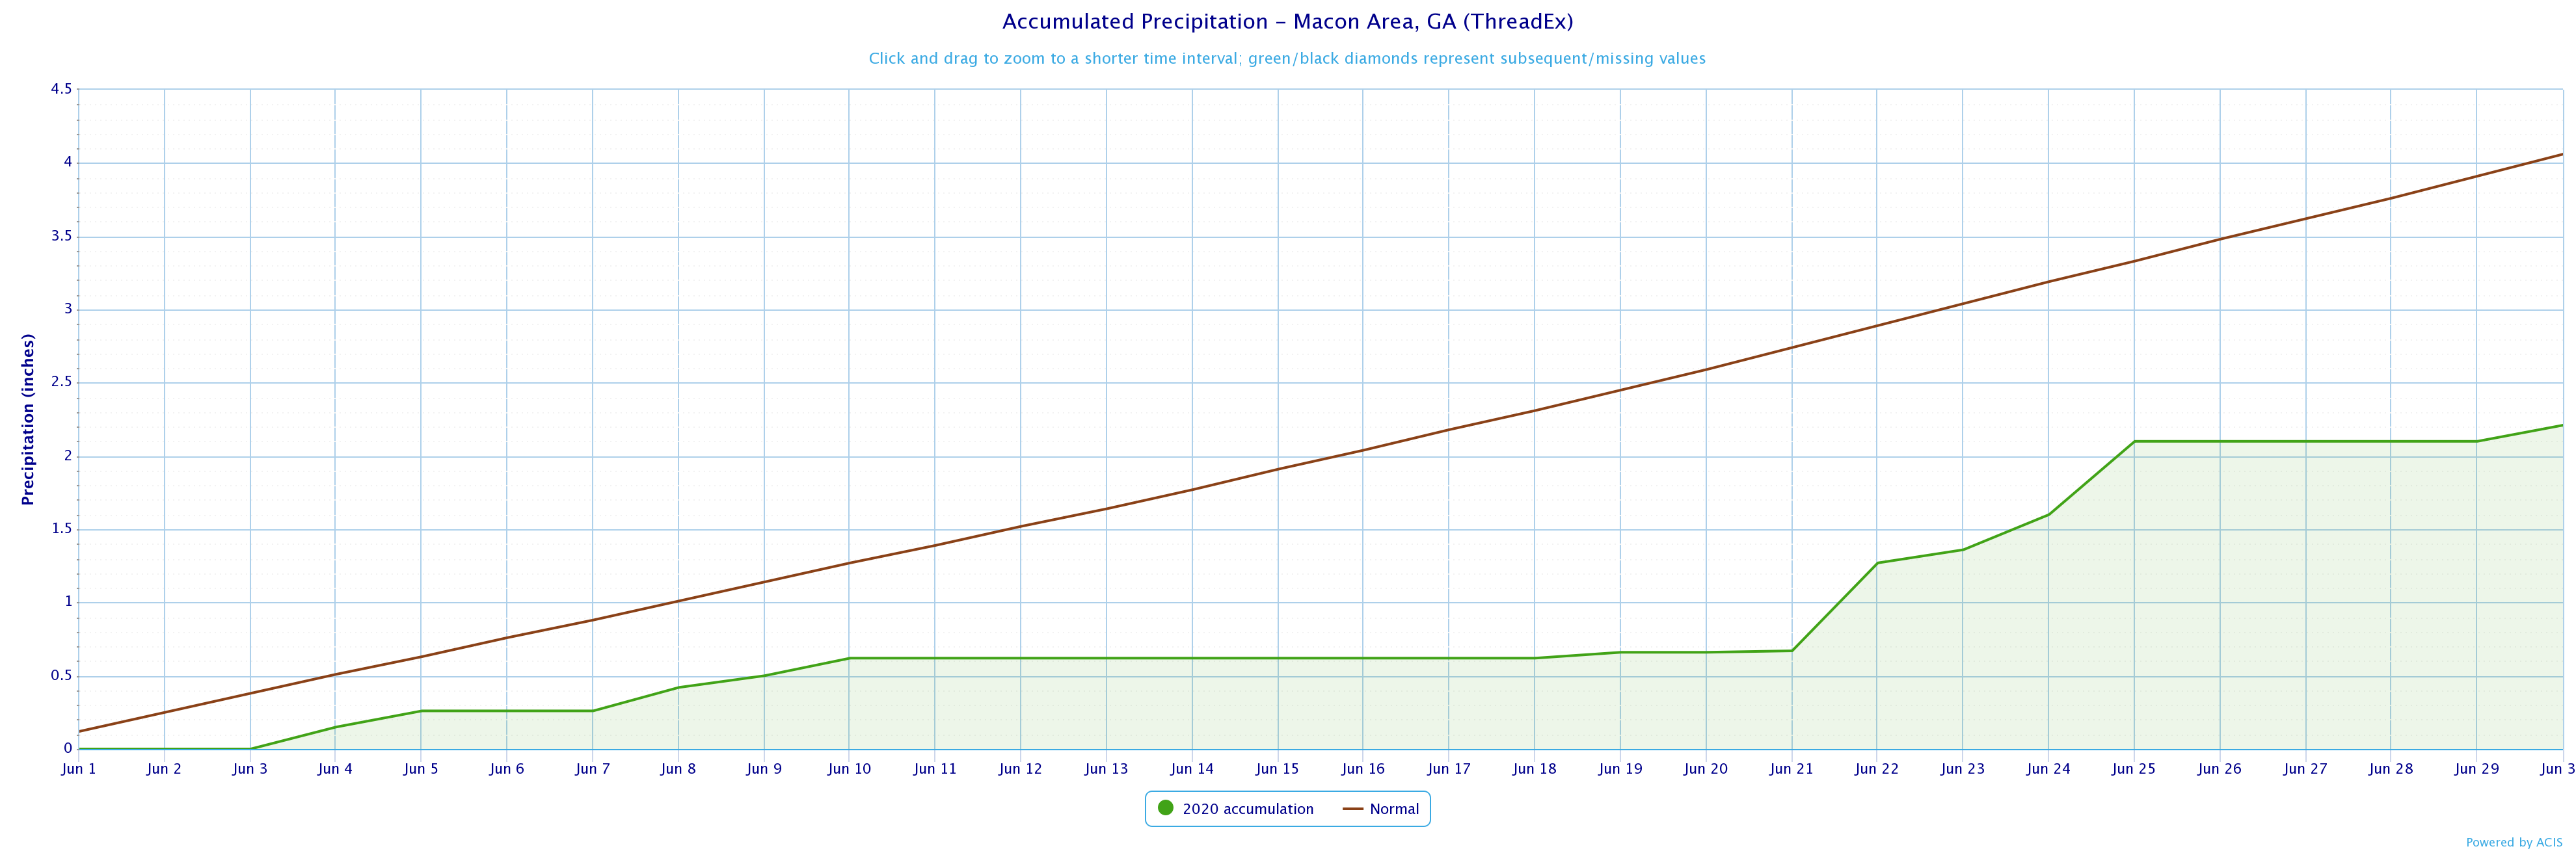
| Macon | 31st Coolest | 17th Driest |
|
June 2020 Temperature Climate Statistics
|
|||
| Climate Site | Average Temperature |
Normal Temperature
|
DFN (Departure
From Normal)
|
|
77.6
|
77.5
|
+1.1
|
|
|
76.8
|
77.3
|
-0.5
|
|
|
79.3
|
79.8
|
-0.5
|
|
|
78.8
|
78.9
|
-0.1
|
|
|
76.2
|
74.8
|
+1.4
|
|
|
75.2
|
76.8
|
-1.6
|
|
|
75.7
|
76.7
|
-1.0
|
|
|
74.7
|
75.6
|
-0.9
|
|
|
76.0
|
75.9
|
+0.1
|
|
|
76.6
|
75.9
|
+0.7
|
|
|
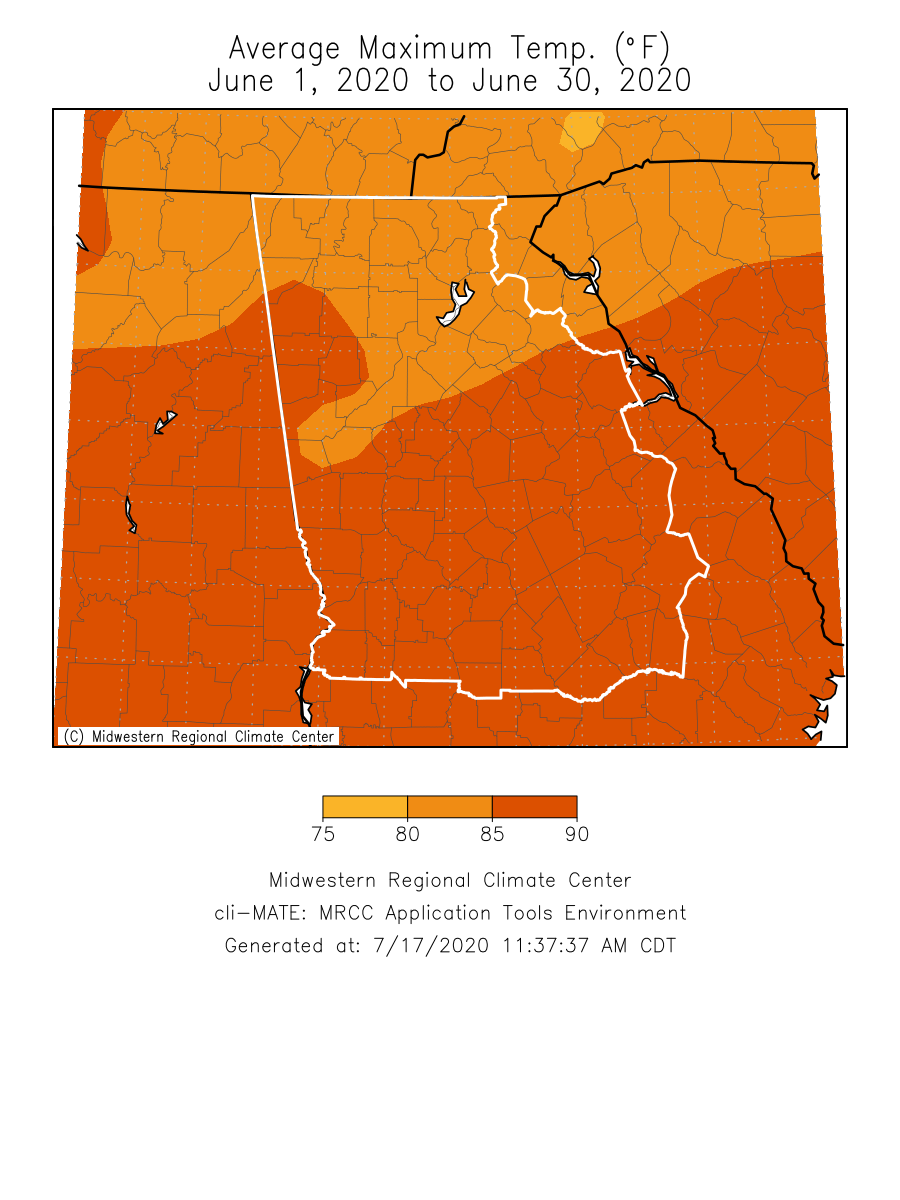
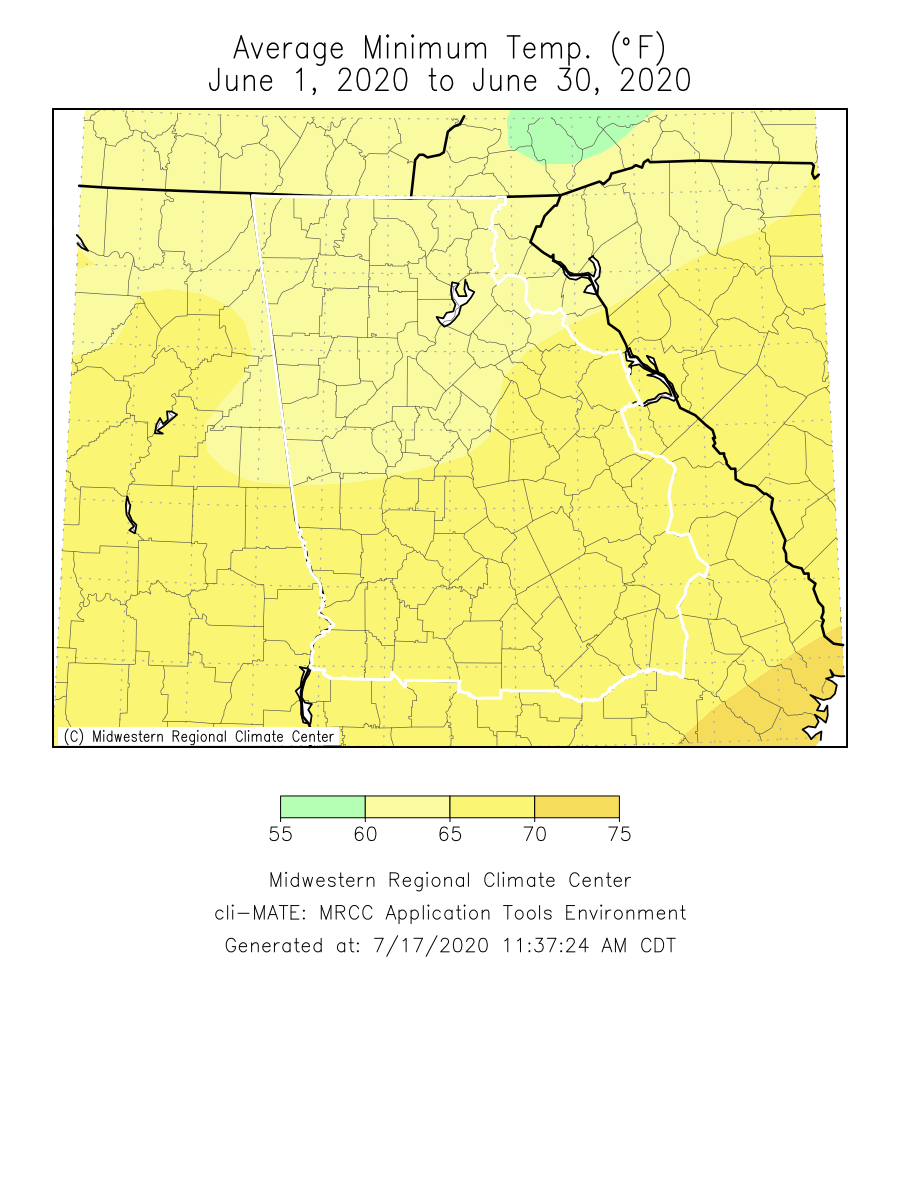
June 2020 Temperature Climate Statistics
|
||||
| Climate Site | Maximum Temperature | Max T Date |
Minimum Temperature
|
Min T Date
|
|
Athens
|
96
|
6/21
|
53
|
6/17*
|
|
Atlanta
|
93
|
6/29
|
59
|
6/17
|
|
Columbus
|
94
|
6/20, 6/29
|
59
|
6/17
|
|
Macon
|
97
|
6/21, 6/29, 6/30
|
56
|
6/17*
|
|
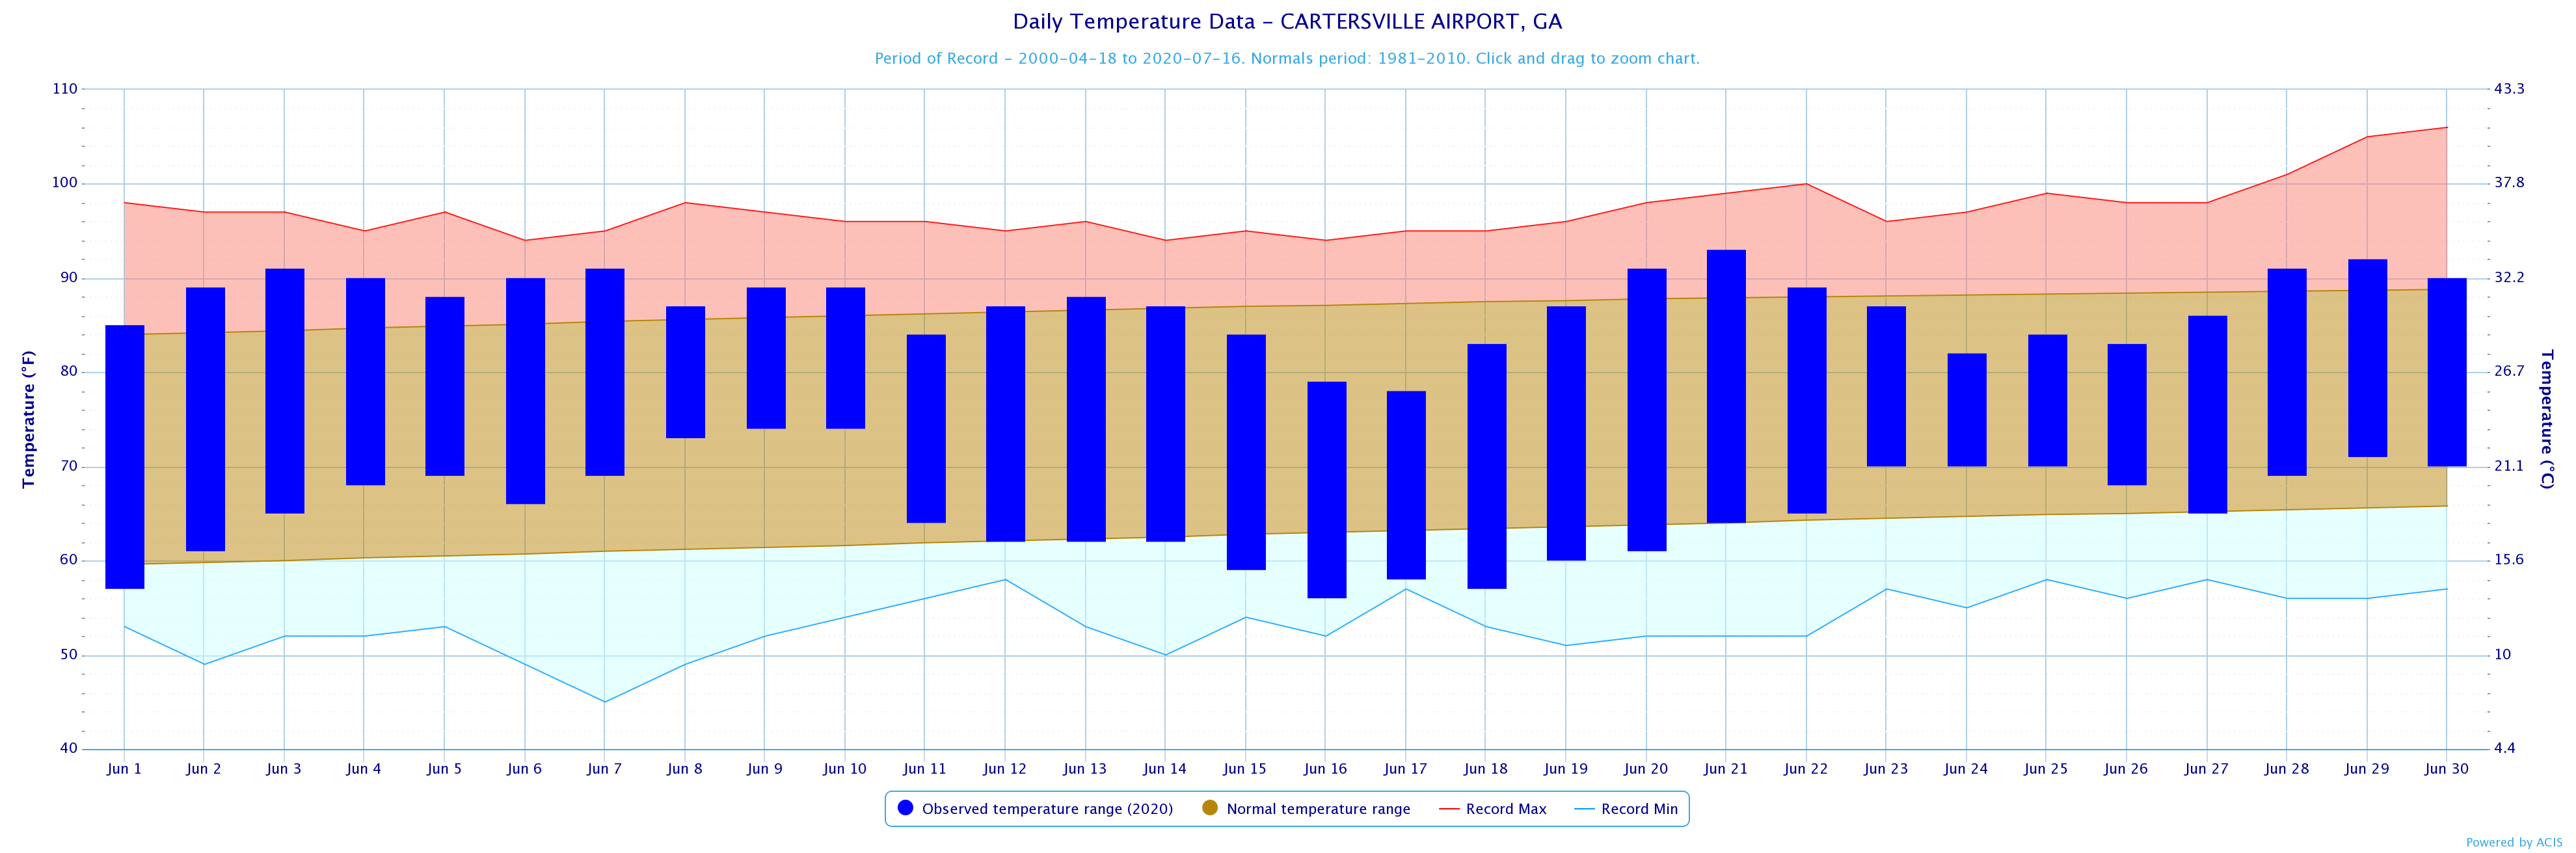
Cartersville
|
93
|
6/21
|
56
|
6/16
|
|
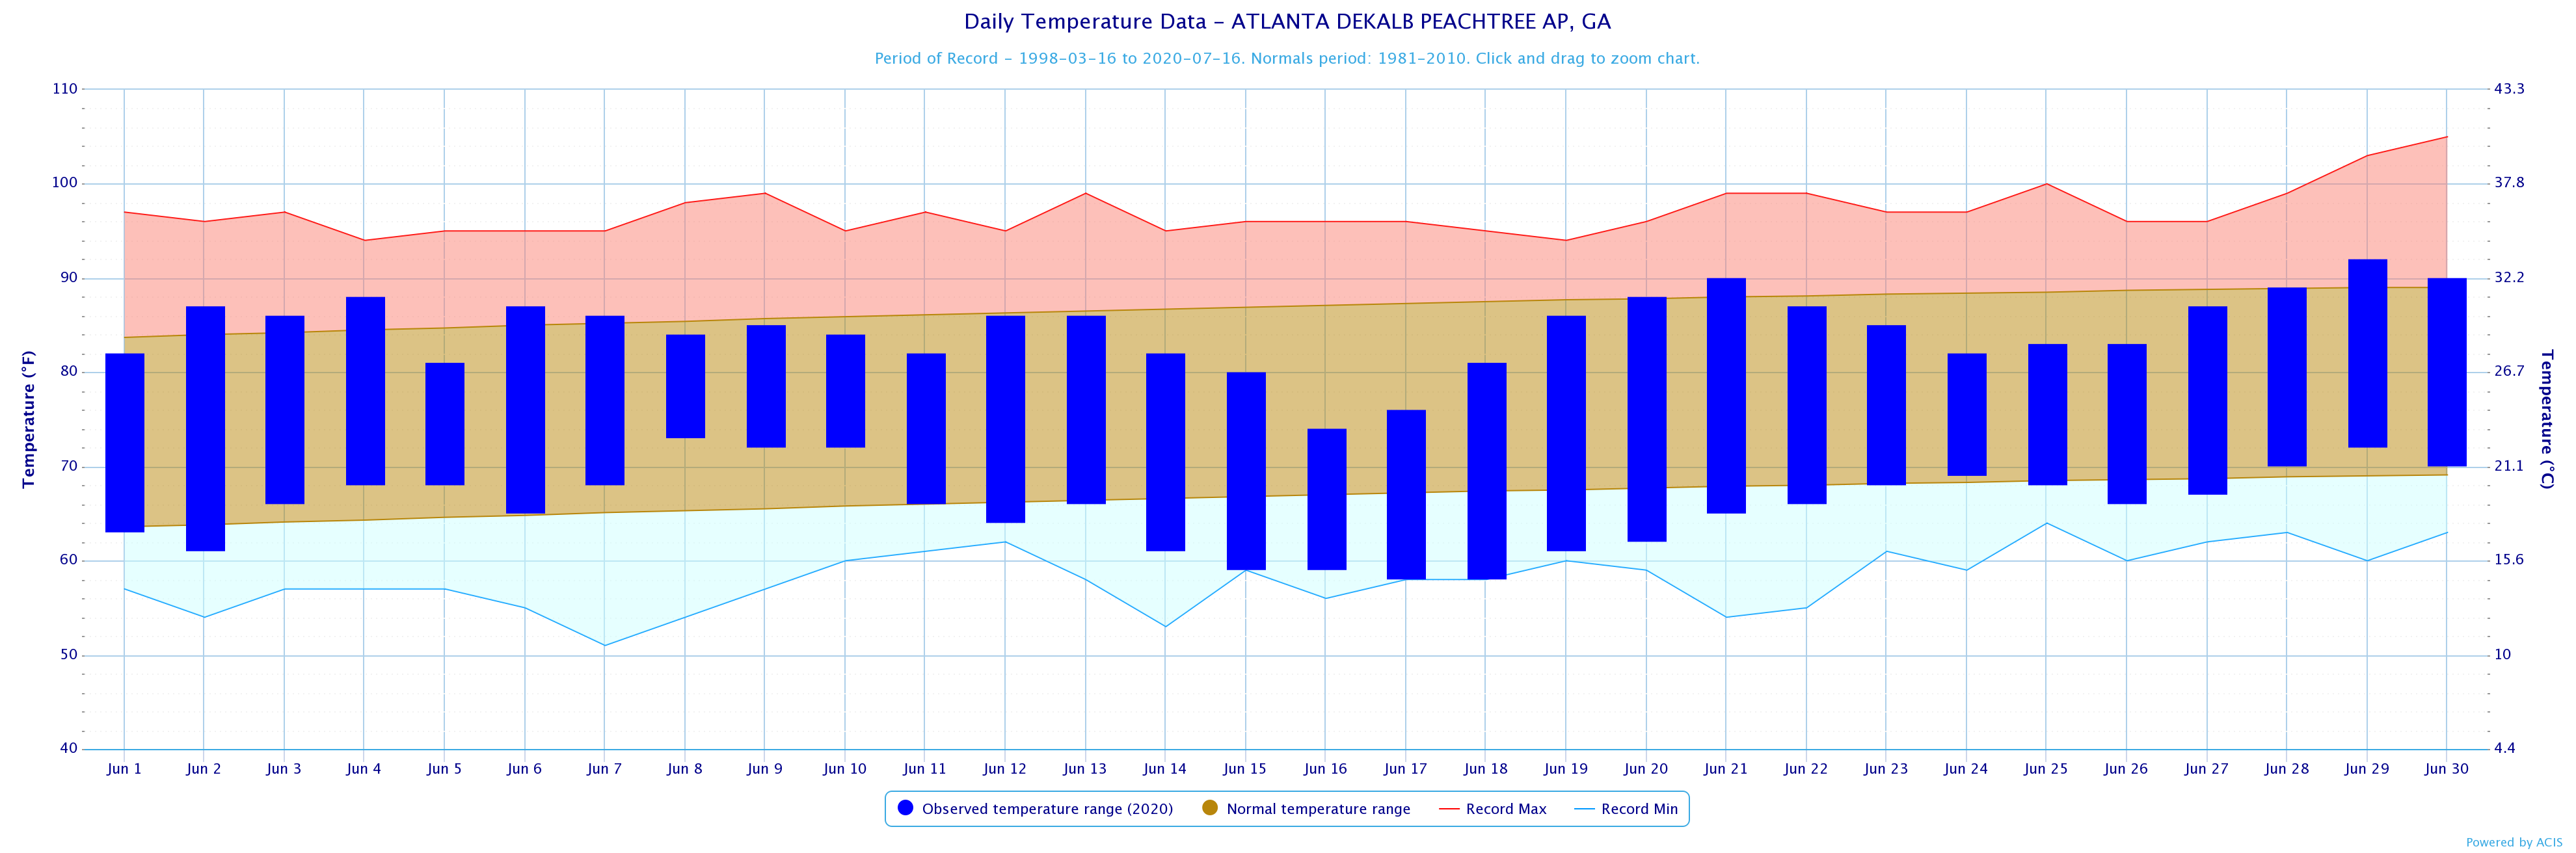
Dekalb Peachtree Arpt
|
92
|
6/29
|
58
|
6/17*, 6/18*
|
|
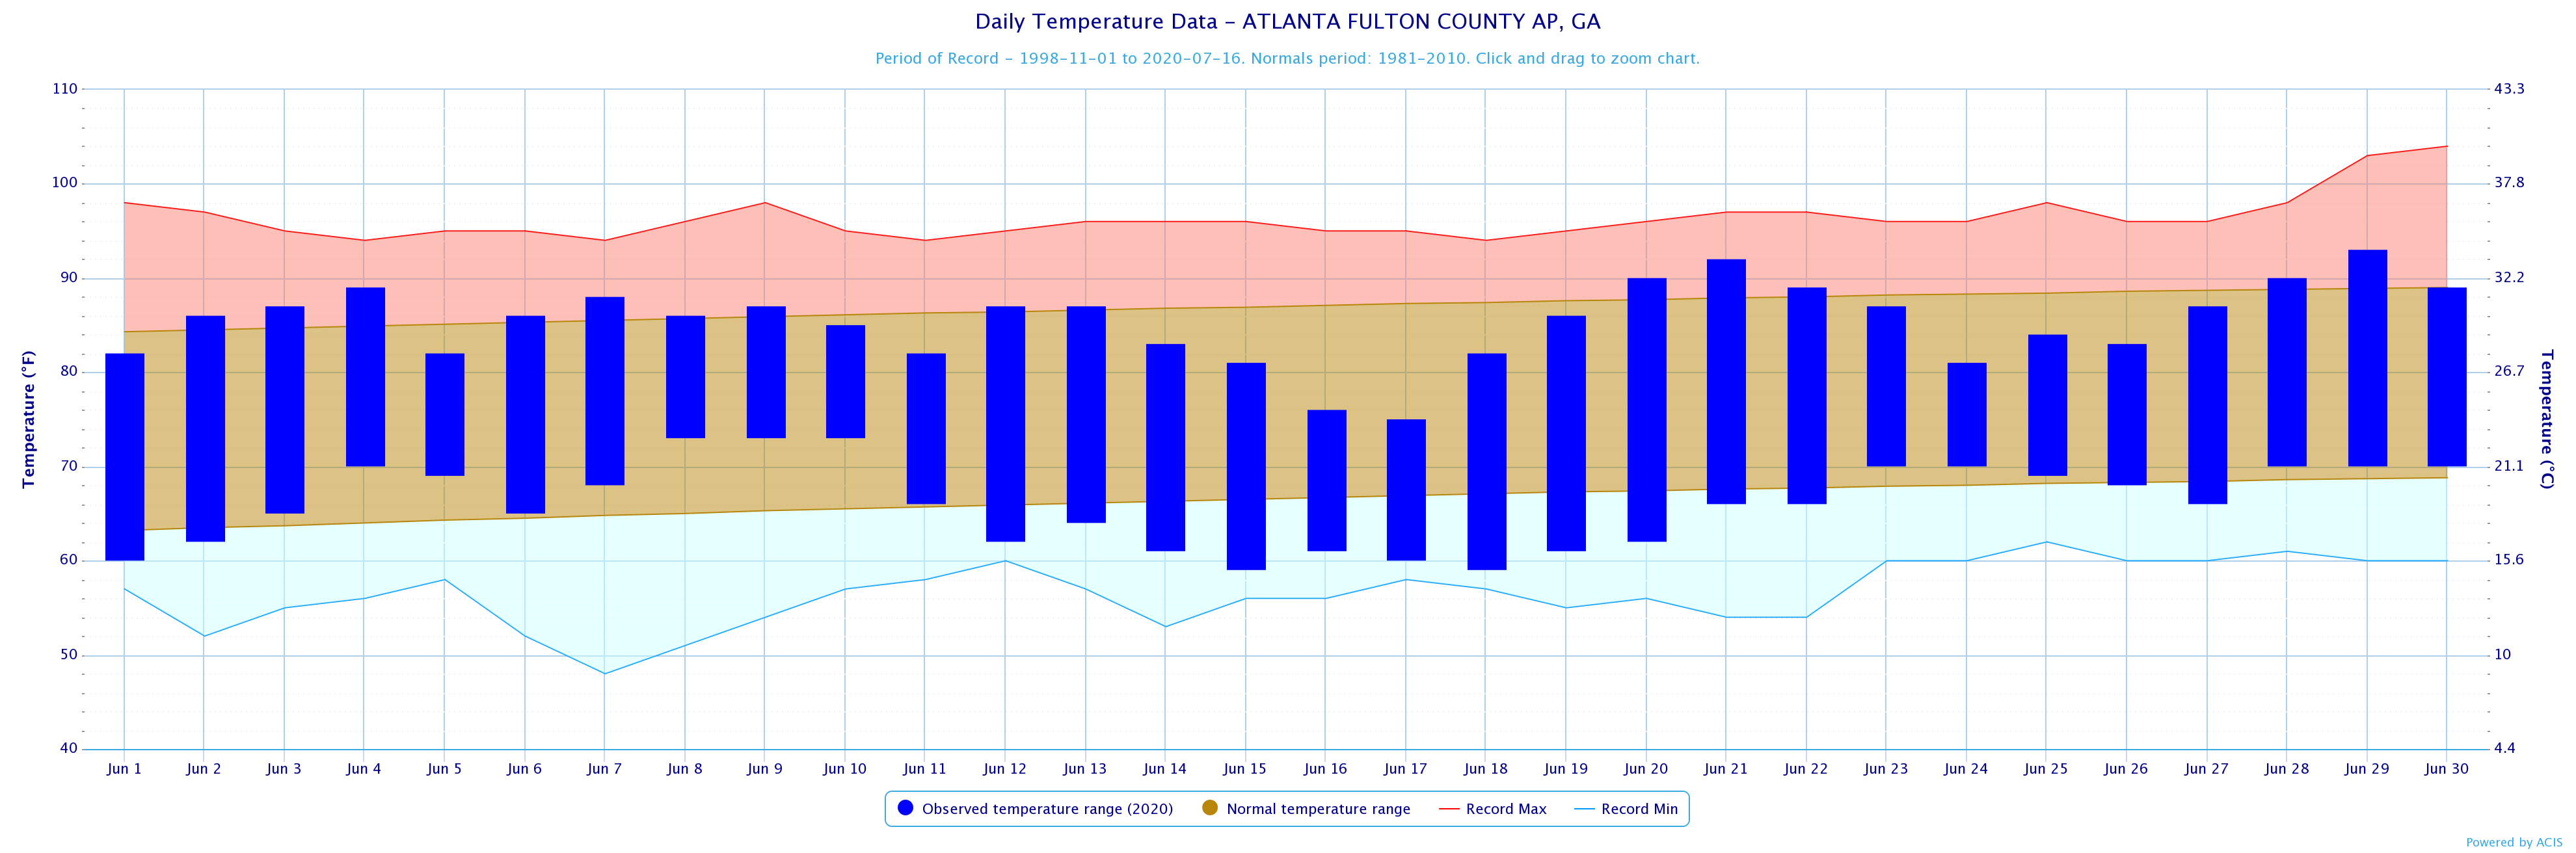
Fulton Co Arpt
|
93
|
6/29
|
59
|
6/15, 6/18
|
|
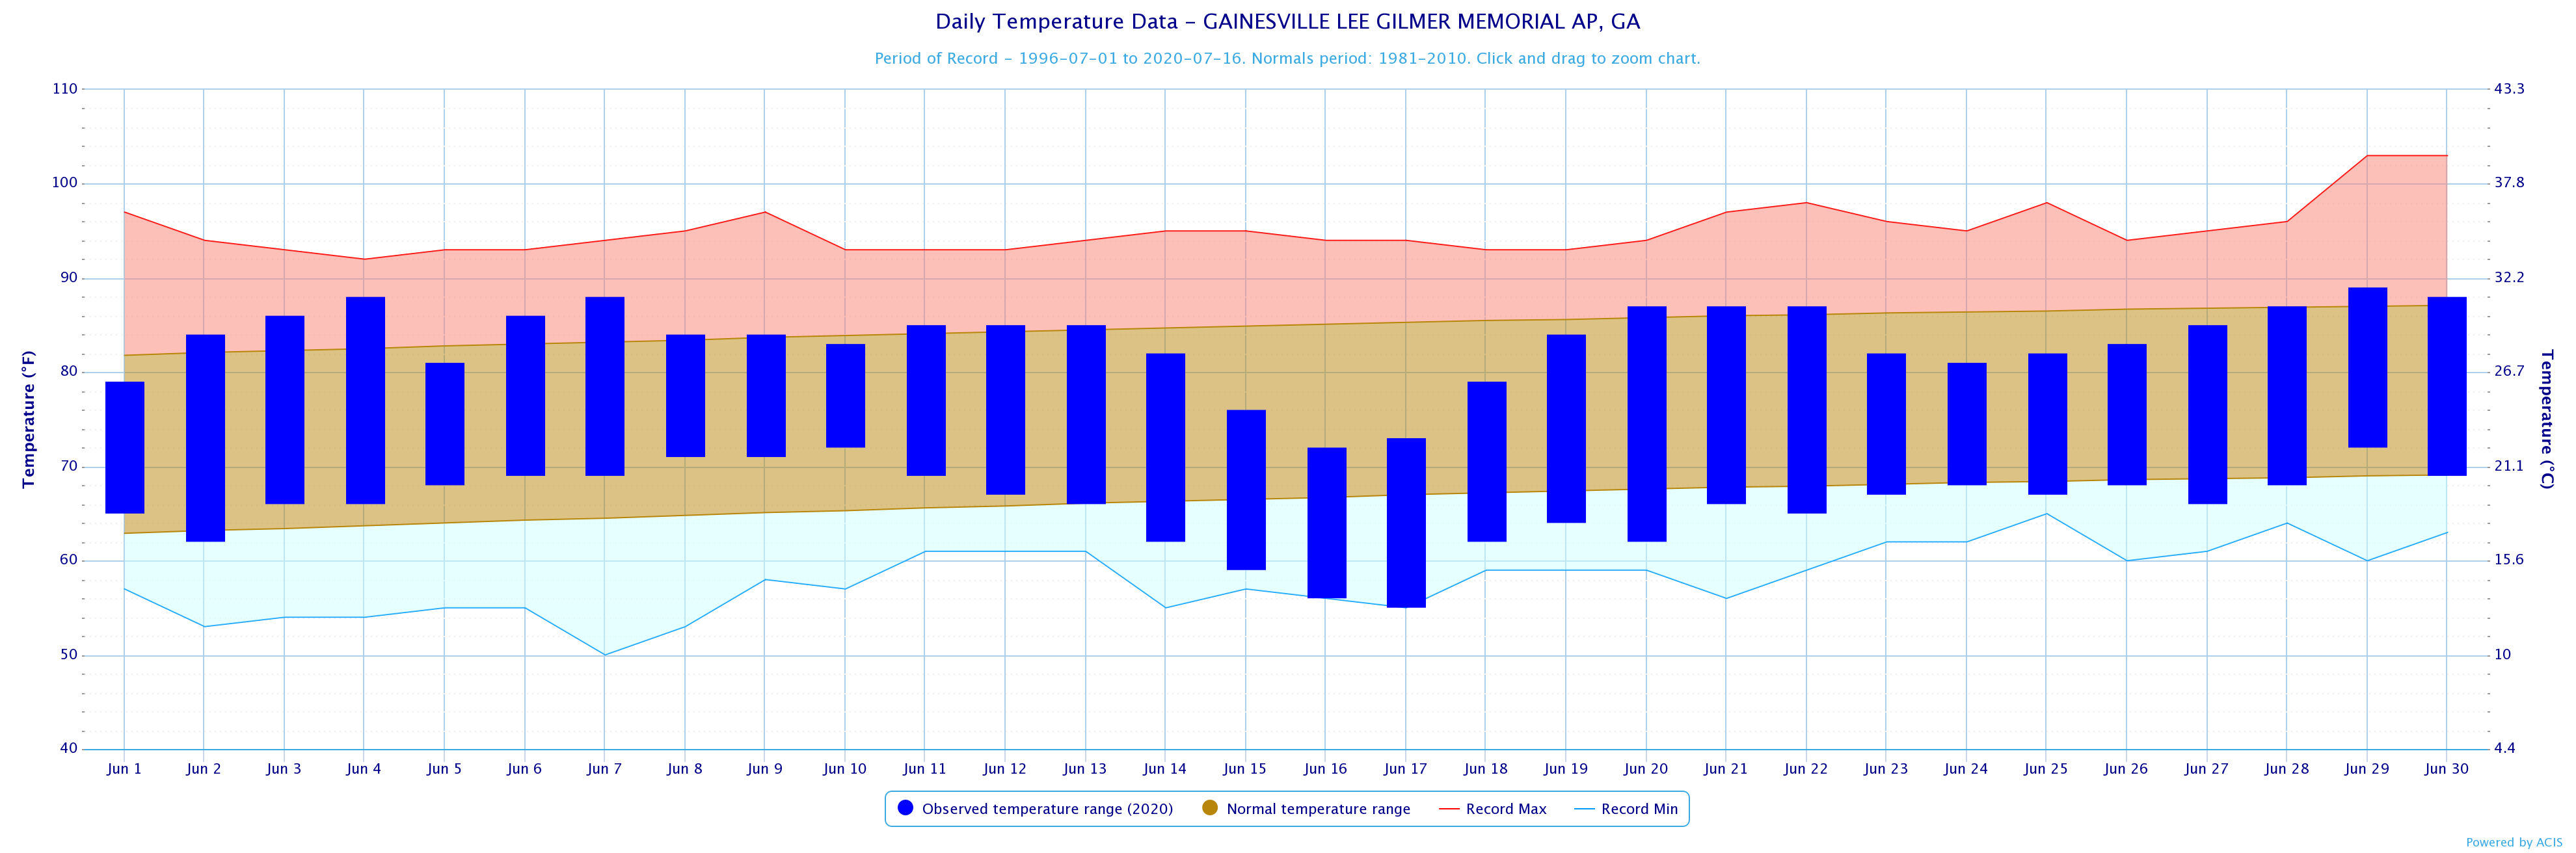
Gainesville
|
89
|
6/29
|
55
|
6/17*
|
|
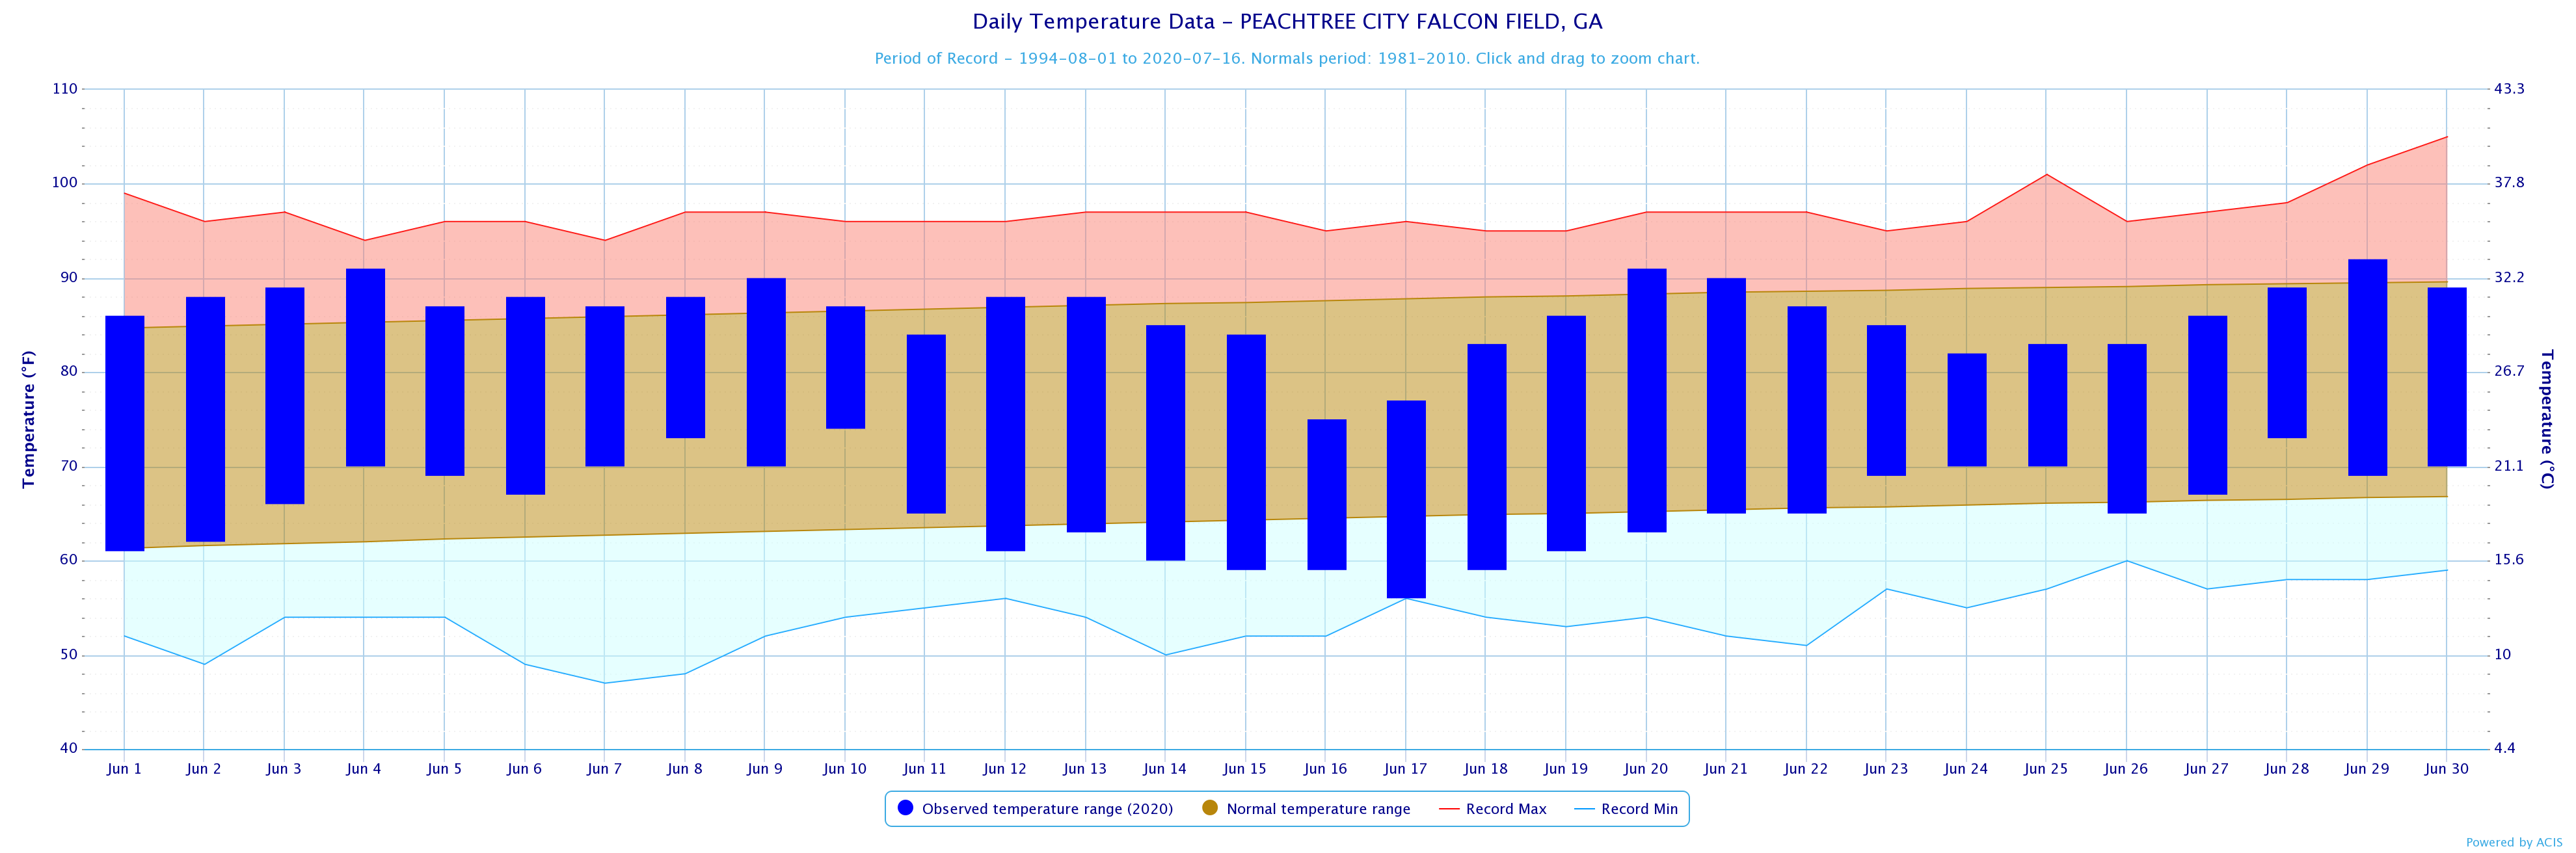
Peachtree City
|
92
|
6/29
|
56
|
6/17*
|
|
Rome
|
92
|
6/20, 6/21, 6/29
|
56
|
6/16
|
*Indicates a daily record was set
|
June 2020 Precipitation Climate Statistics
|
|||
| Climate Site | Total Precipitation |
Normal Precipitation
|
DFN (Departure
From Normal)
|
|
2.66
|
4.18
|
-1.52
|
|
|
2.64
|
3.95
|
-1.31
|
|
|
4.83
|
3.72
|
+1.11
|
|
|
2.21
|
4.06
|
-1.85
|
|
|
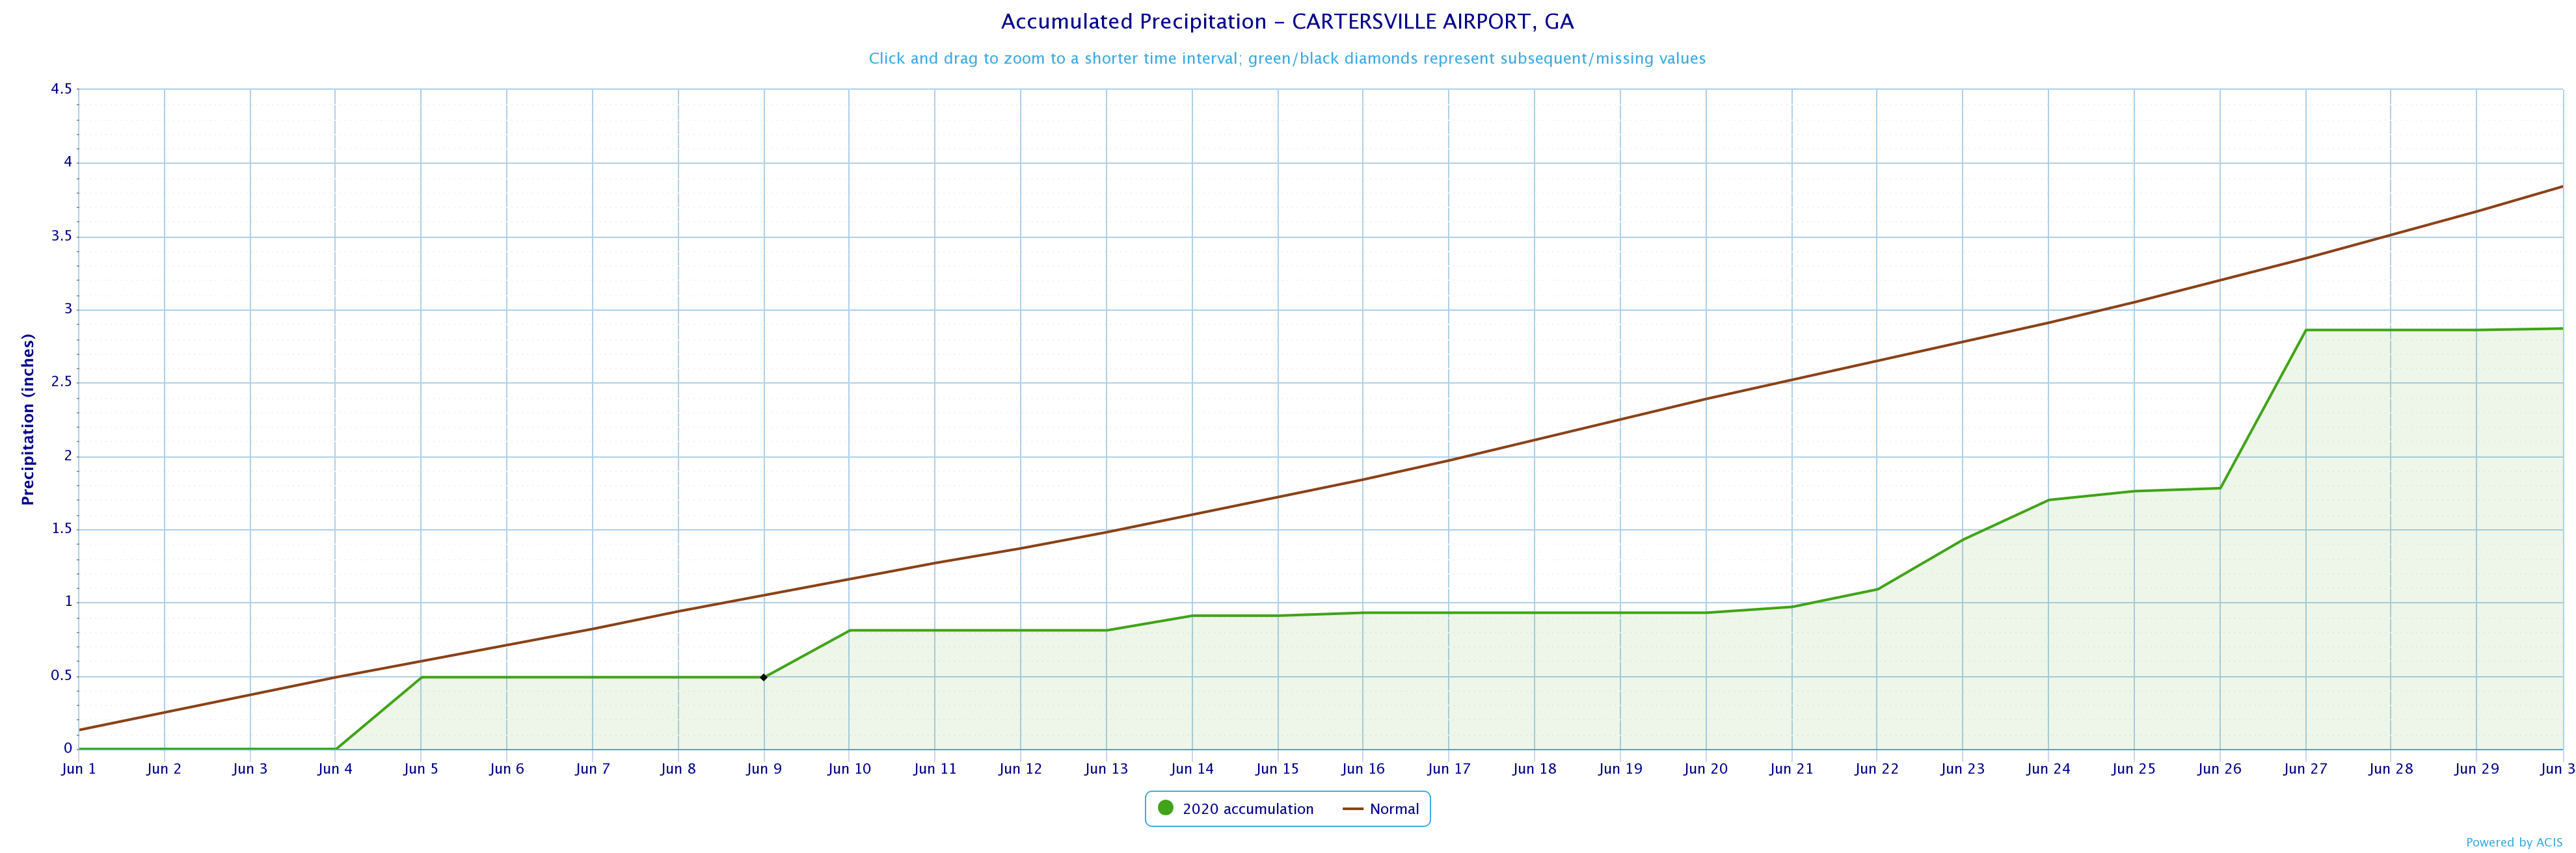
2.87
|
3.84
|
-0.97
|
|
|
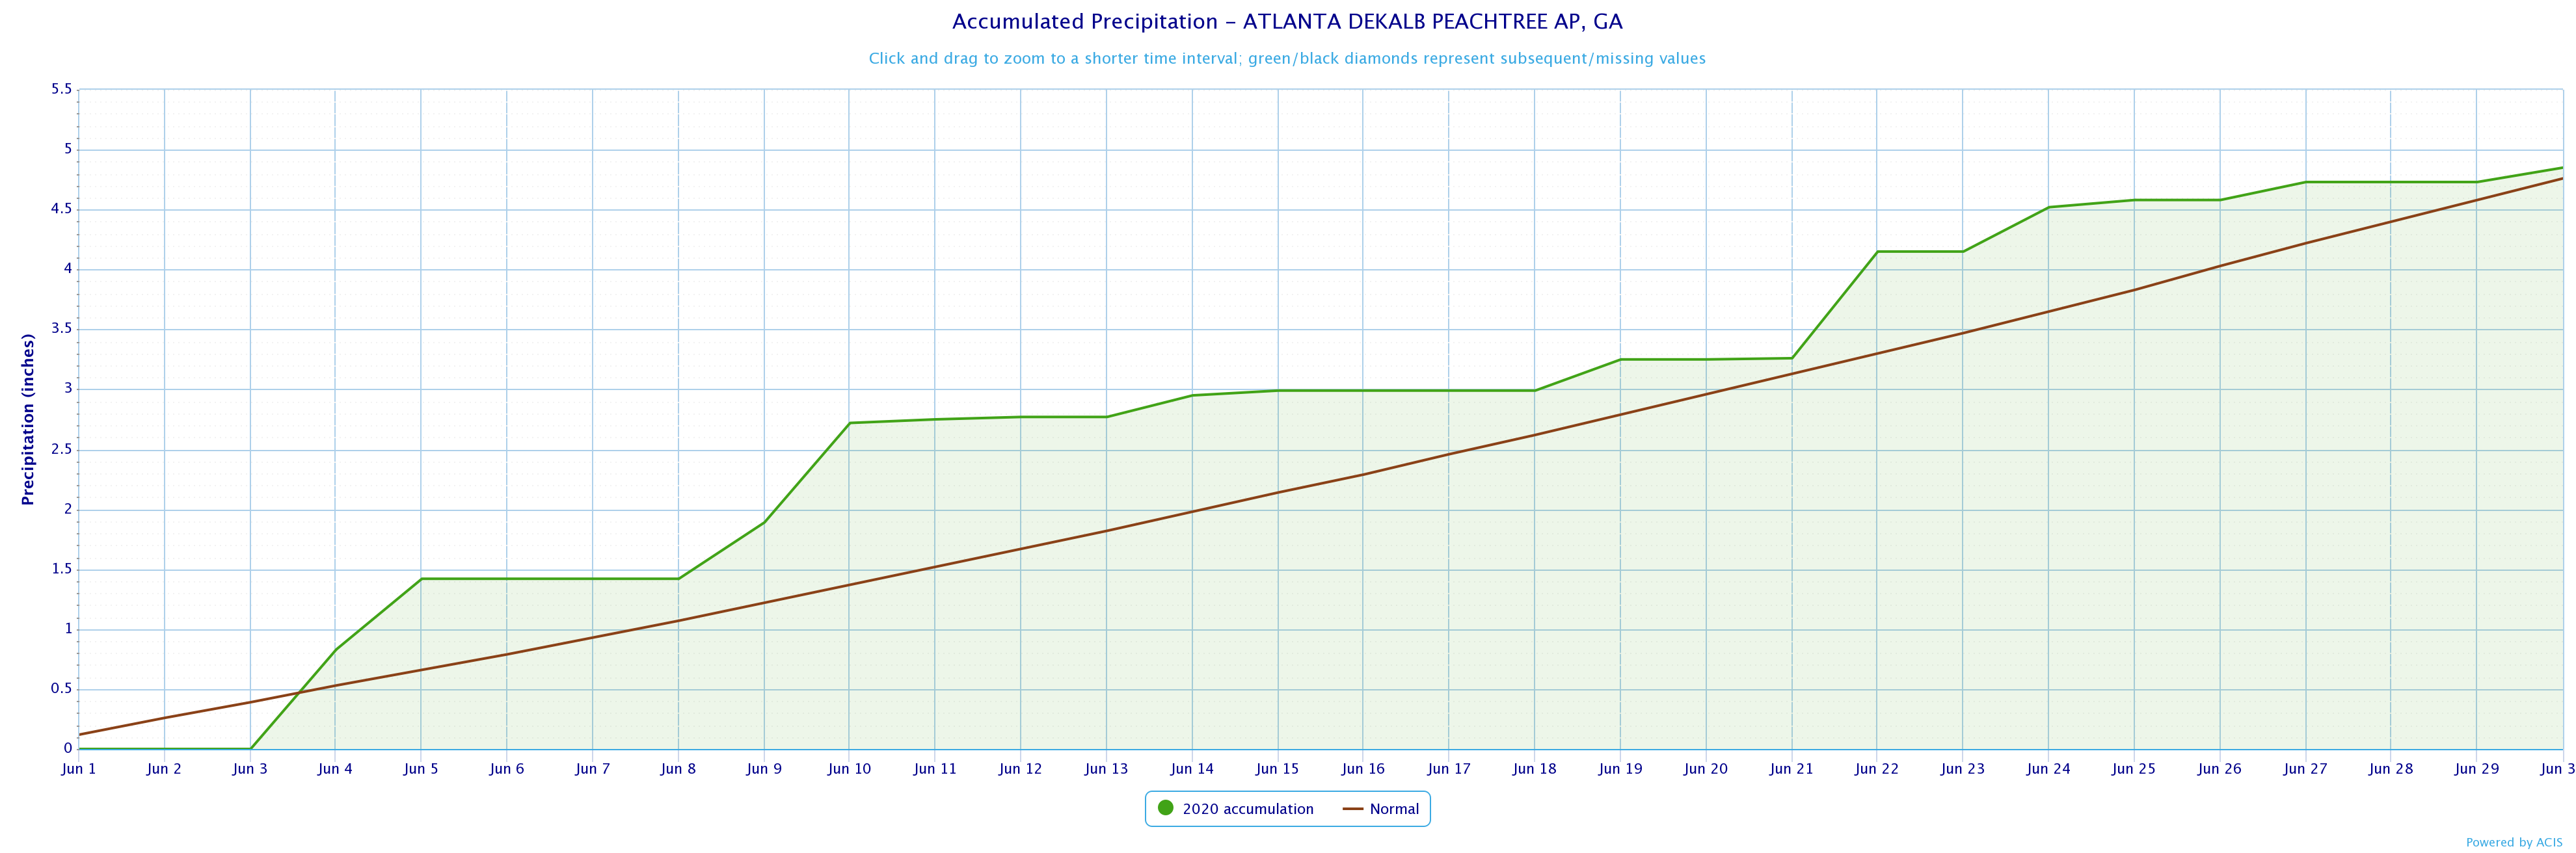
4.85
|
4.76
|
+0.09
|
|
|
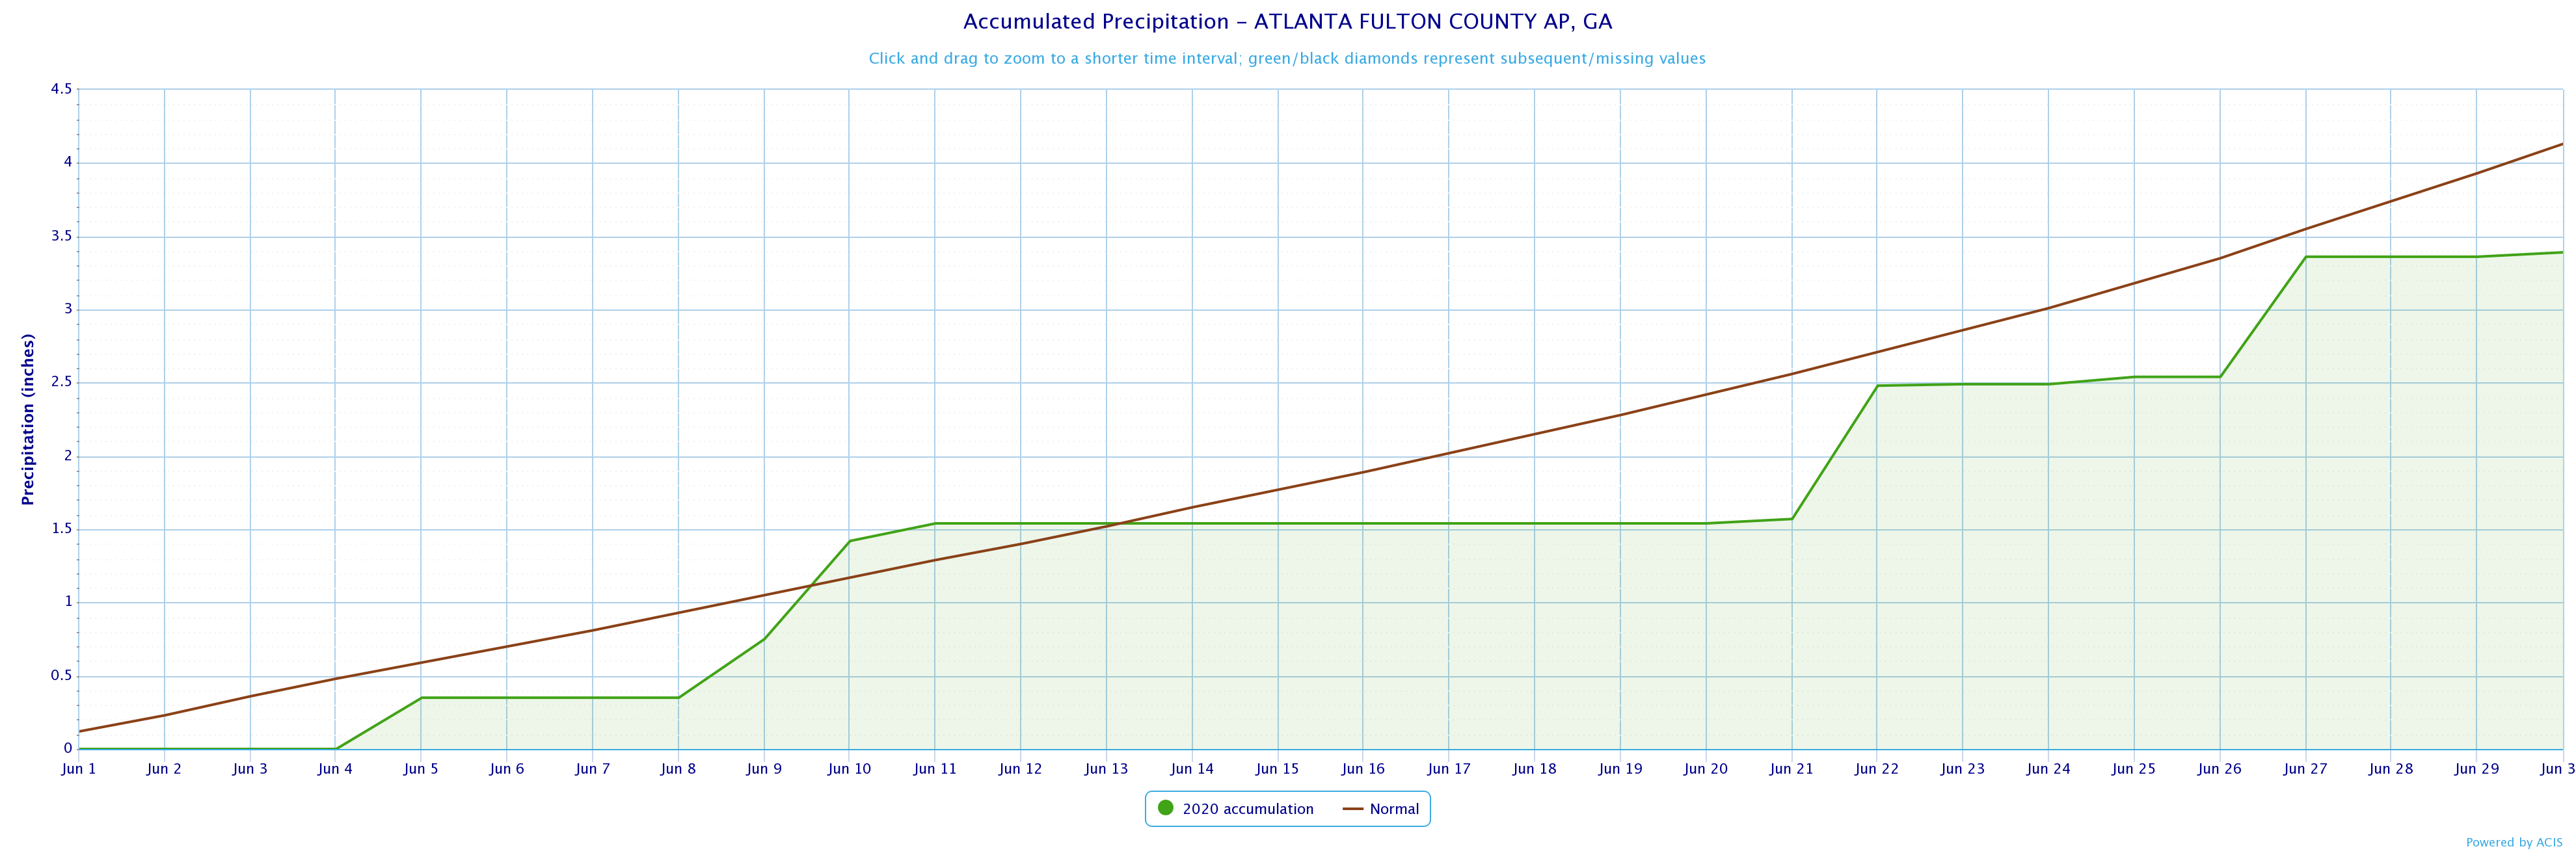
3.39
|
4.13
|
-0.74
|
|
|
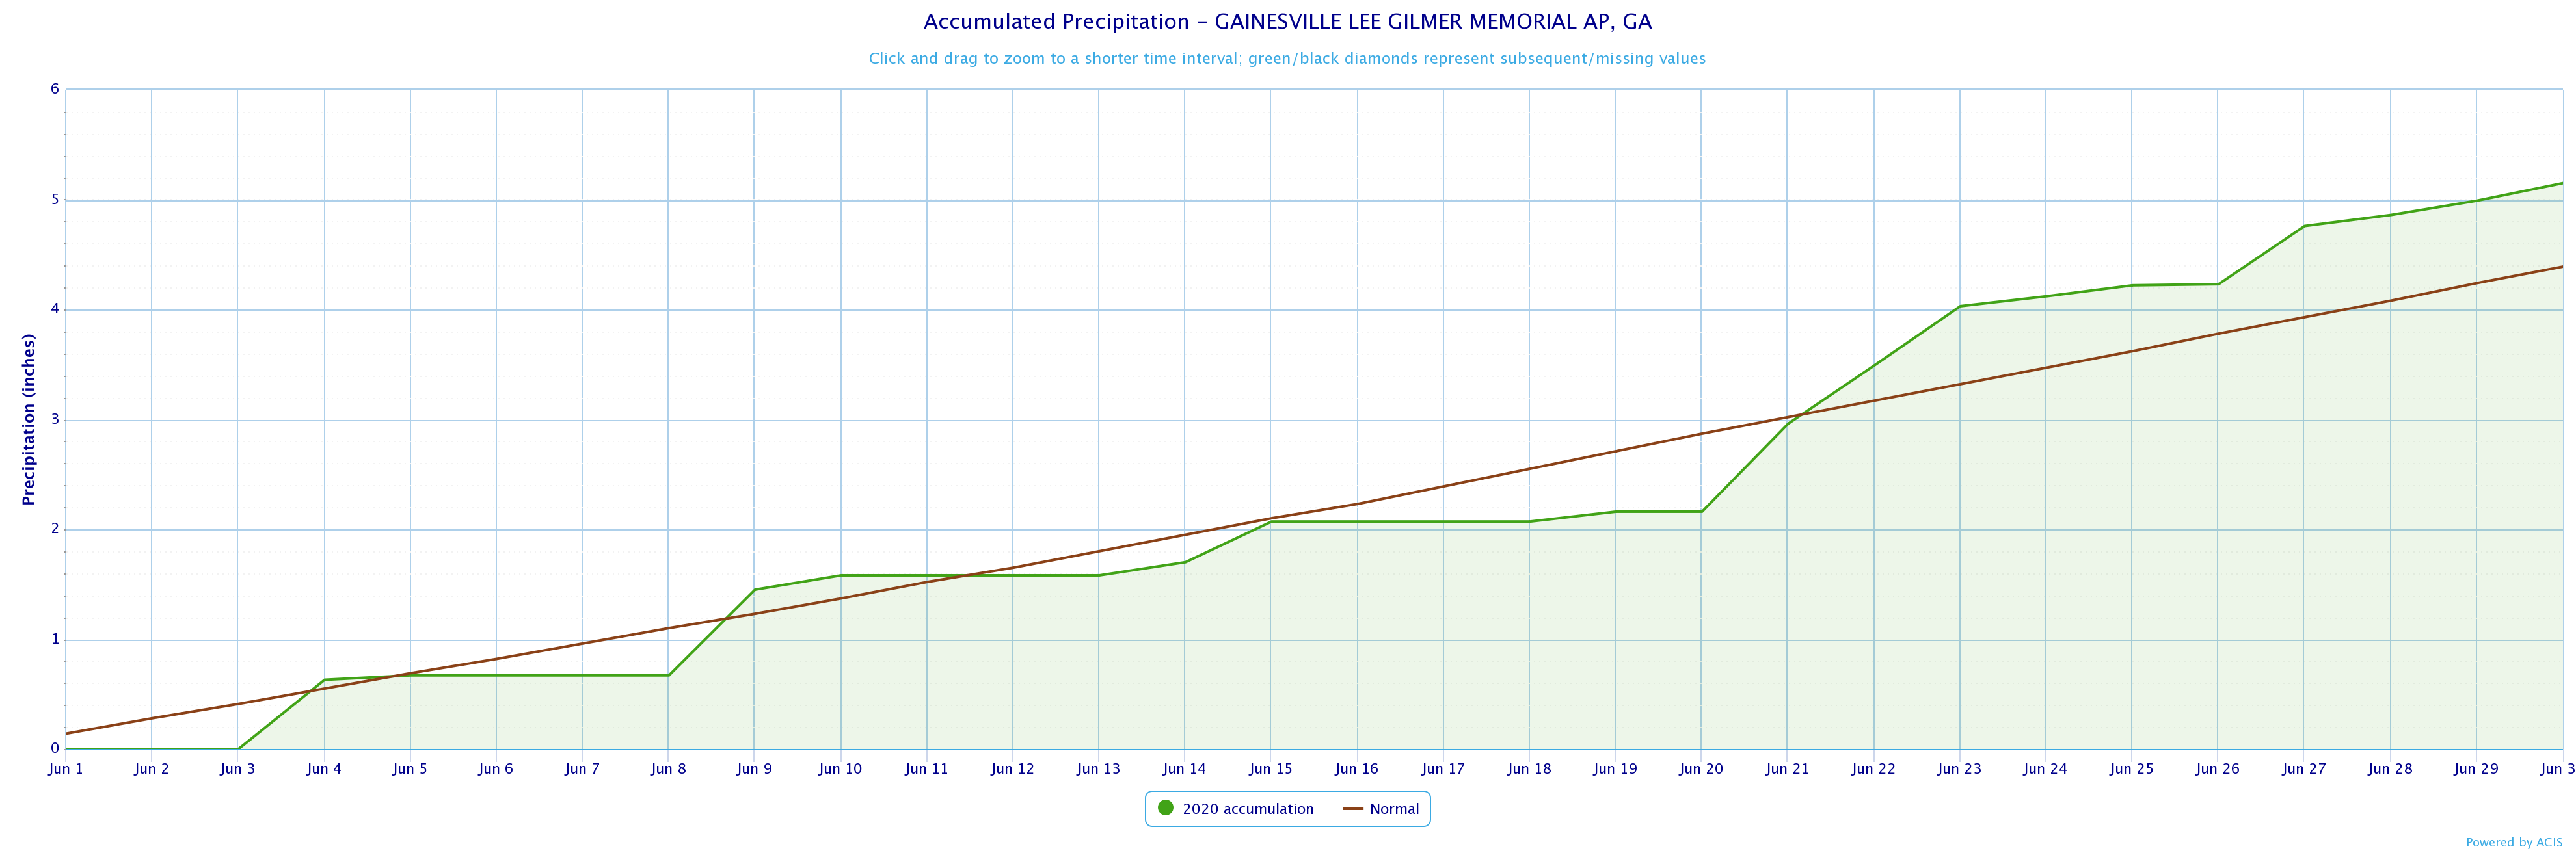
5.15
|
4.39
|
+0.76
|
|
|
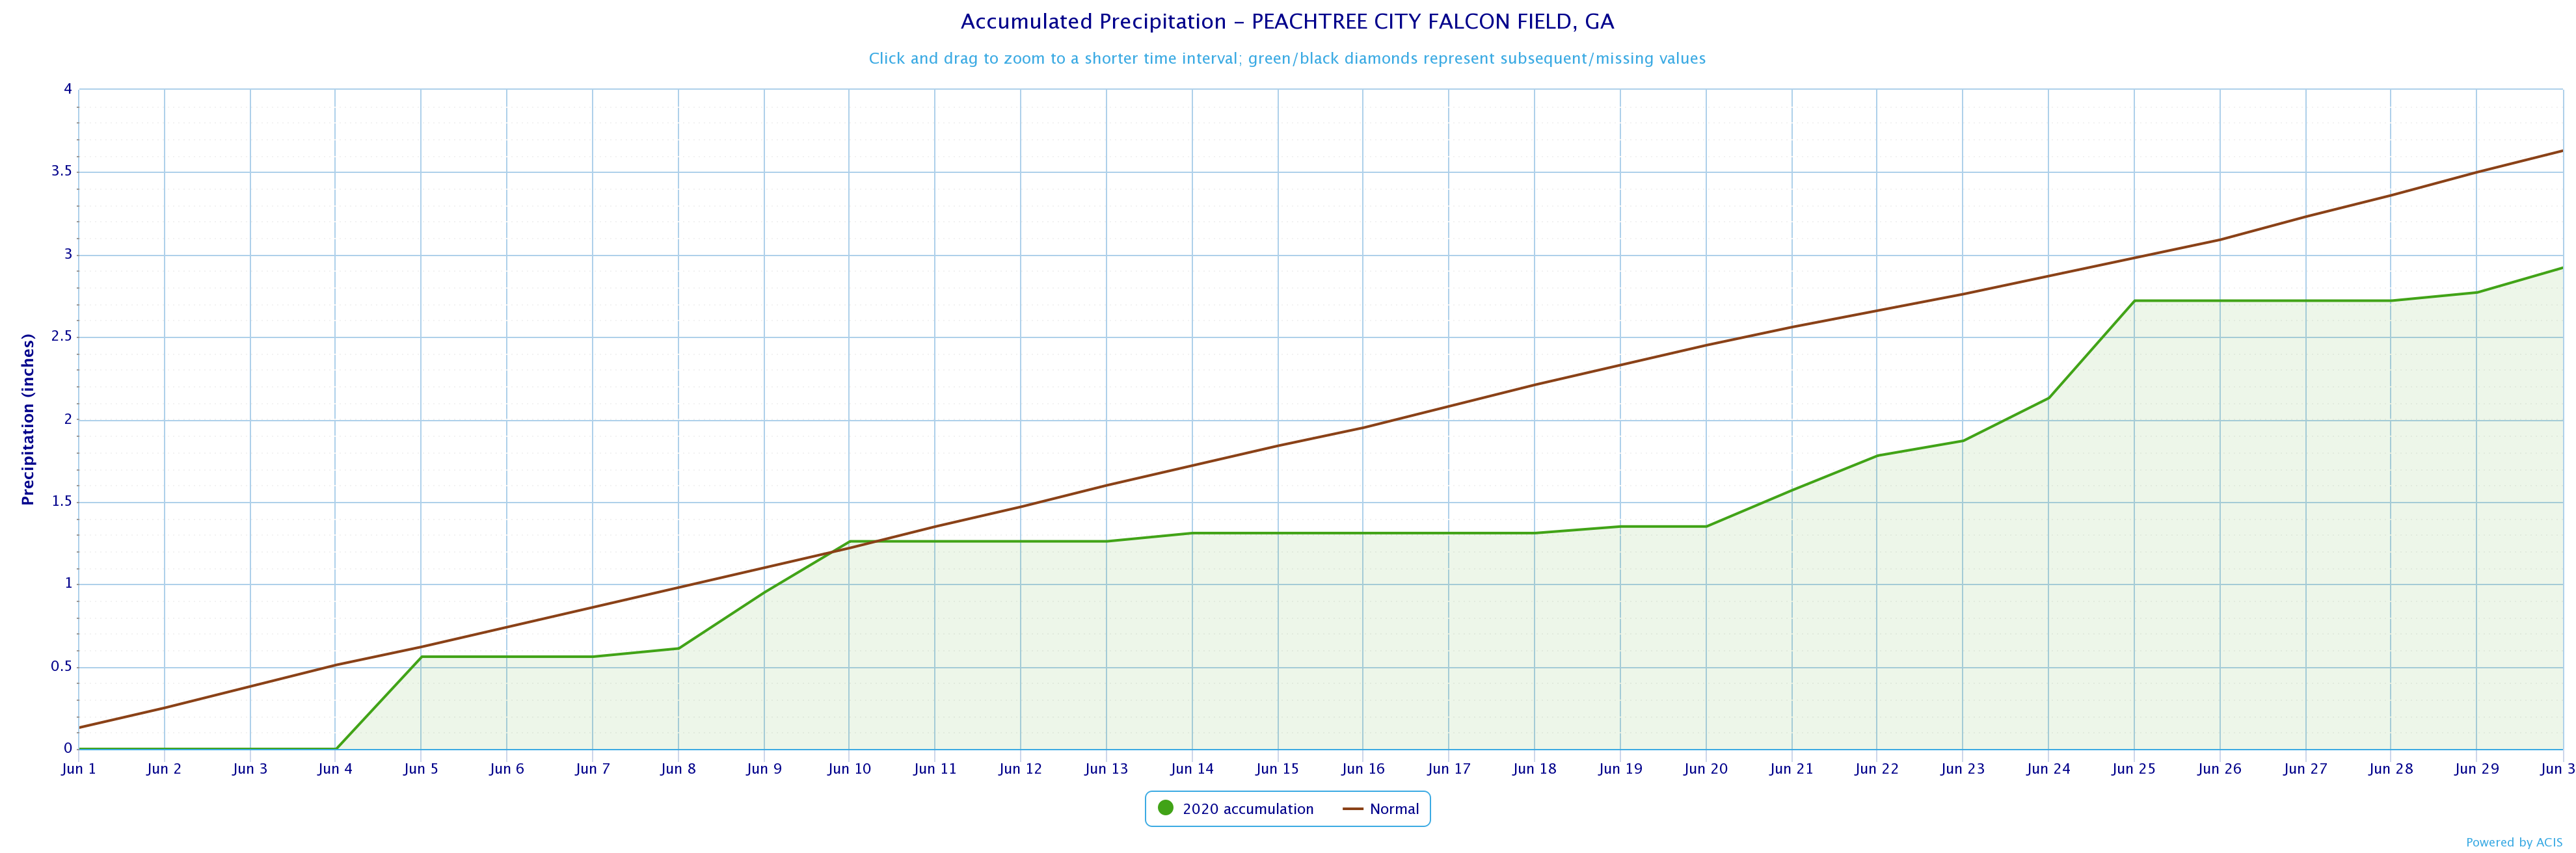
2.92
|
3.63
|
-0.71
|
|
|
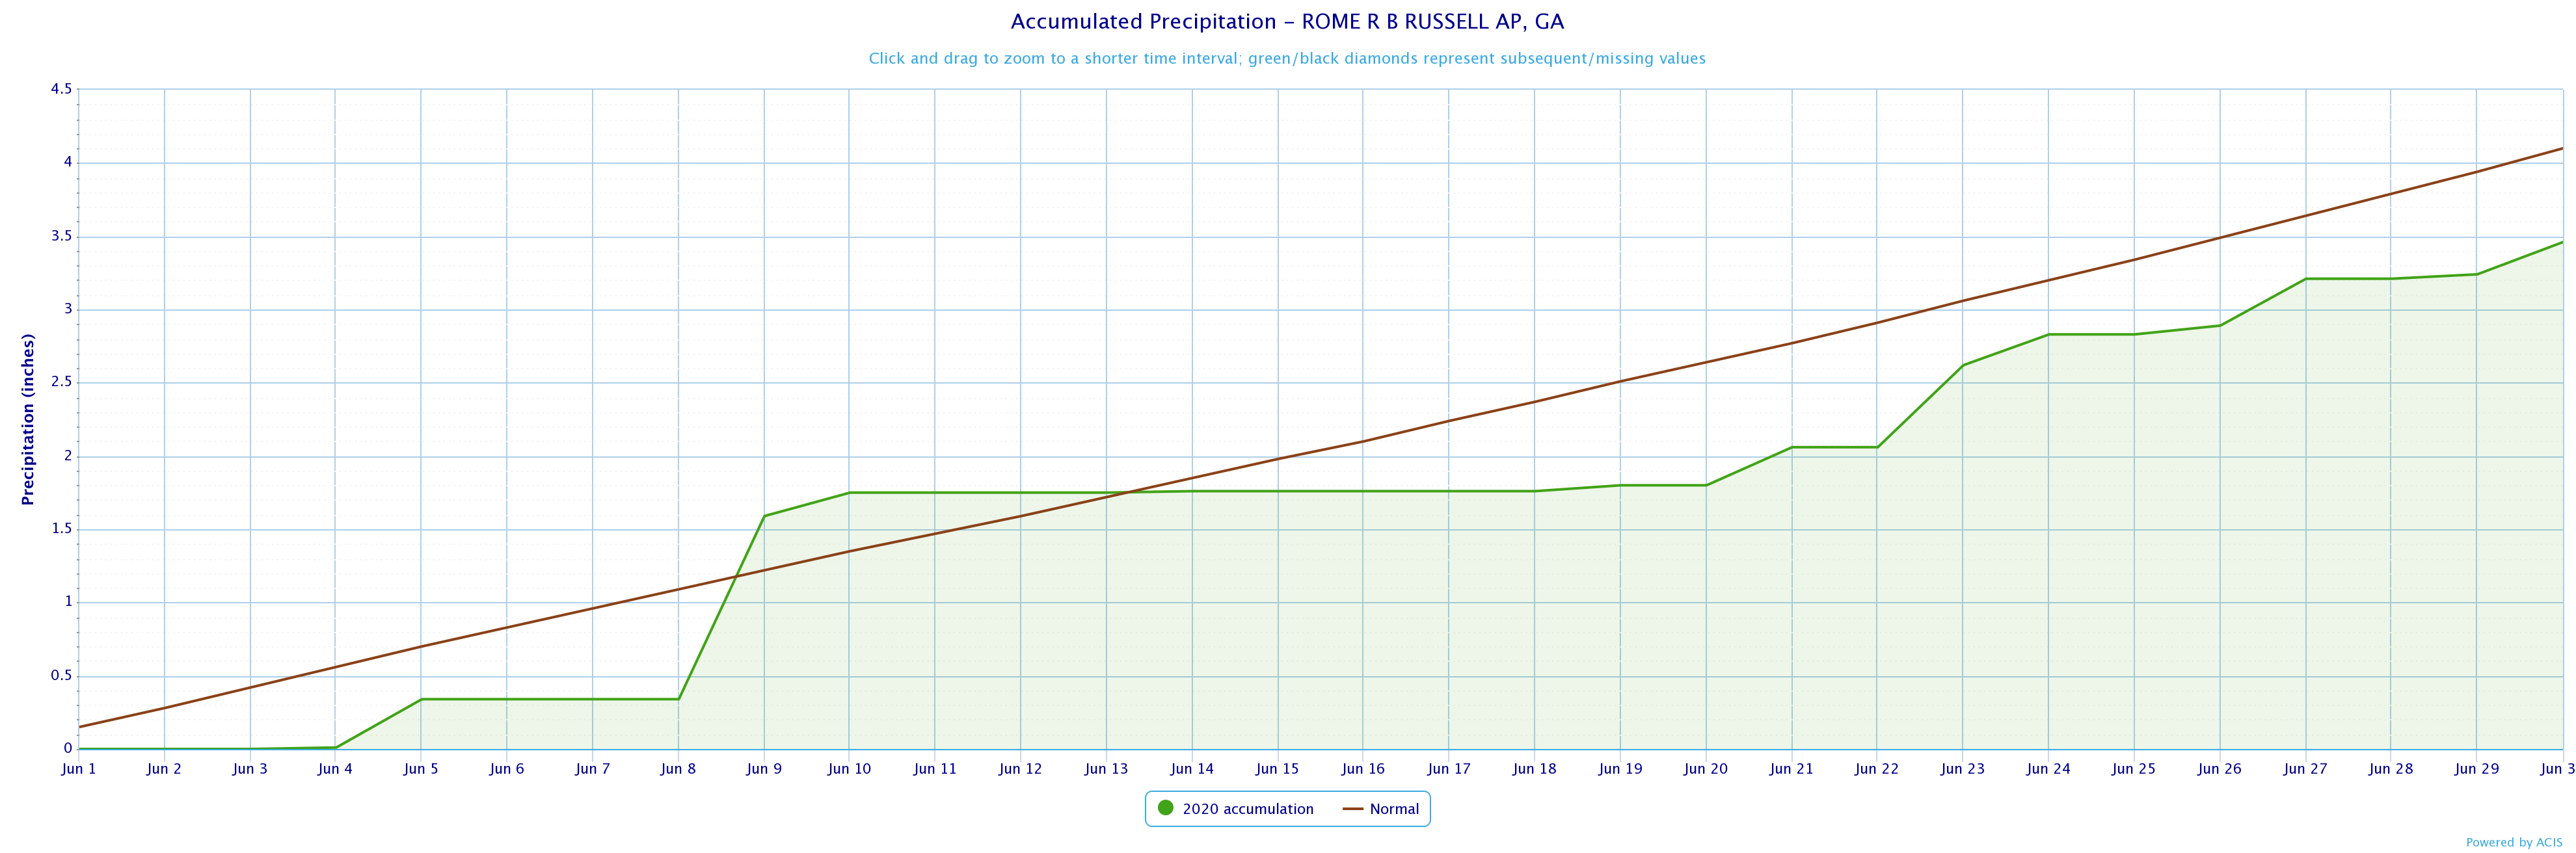
3.46
|
4.10
|
-0.64
|
|
|
June 2020 Precipitation Climate Statistics
|
||||
| Climate Site | Maximum Daily Precip | Max P Date | ||
|
Athens
|
0.66
|
6/22
|
||
|
Atlanta
|
0.71
|
6/10
|
||
|
Columbus
|
1.98
|
6/5
|
||
|
Macon
|
0.60
|
6/22
|
||
|
Cartersville
|
1.08
|
6/27
|
||
|
Dekalb Peachtree Arpt
|
0.89
|
6/22
|
||
|
Fulton Co Arpt
|
0.91
|
6/22
|
||
|
Gainesville
|
0.80
|
6/21
|
||
|
Peachtree City
|
0.59
|
6/25
|
||
|
Rome
|
1.25
|
6/9 | ||
*Indicates a daily record was set; BOLD indicates an all time June record
Data prepared by NWS Peachtree City/Atlanta.
Temperature Maps |
Precipitation Maps
|
Temperature Graphs
|
Precipitation Graphs |
|
June 2020 Climate Records
|
|||
|
Date
|
Type
|
Location
|
Record
|
|
6/17
|
Lowest Min Temp
|
Athens
|
A minimum temperature of 53 degrees was reached. This ties the previous record of 53 degrees, last set in 1974.
|
|
6/17
|
Lowest Min Temp
|
Macon
|
A minimum temperature of 56 degrees was reached. This ties the previous record of 56 degrees, last set in 2012.
|
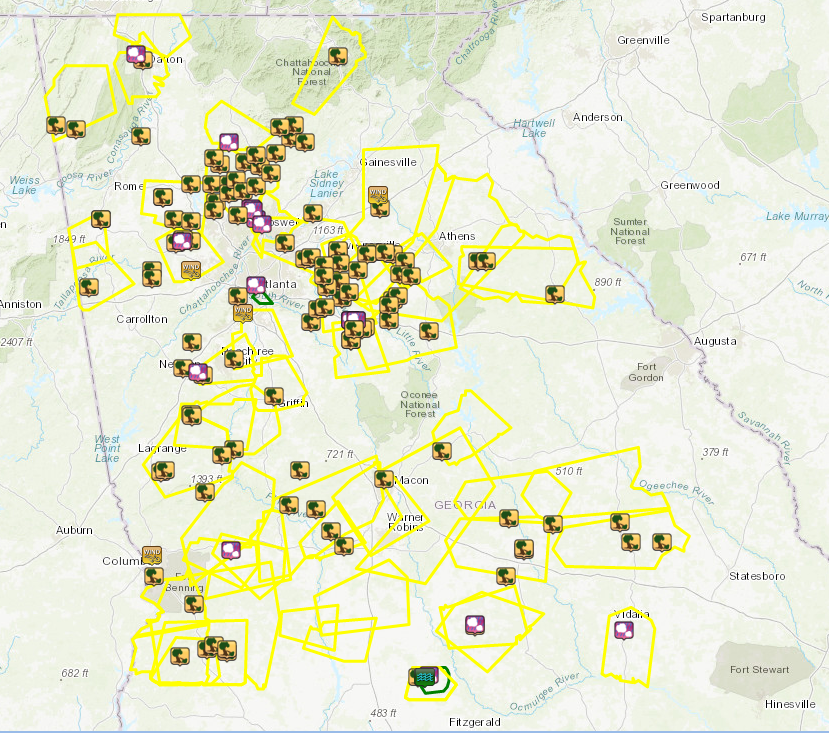
Here is a visual summary of all the warnings and local storm reports issued across portions of northern and central Georgia in June 2020.
Based on the Climate Prediction Center's outlook for July, all of north and central Georgia has a 40% to 50% chance of above normal temperatures. For precipitation, all of north and central Georgia has a 40% to 50% chance of above normal precipitation .
Data prepared by NWS Peachtree City/Atlanta.

