| Previous Month | Next Month |
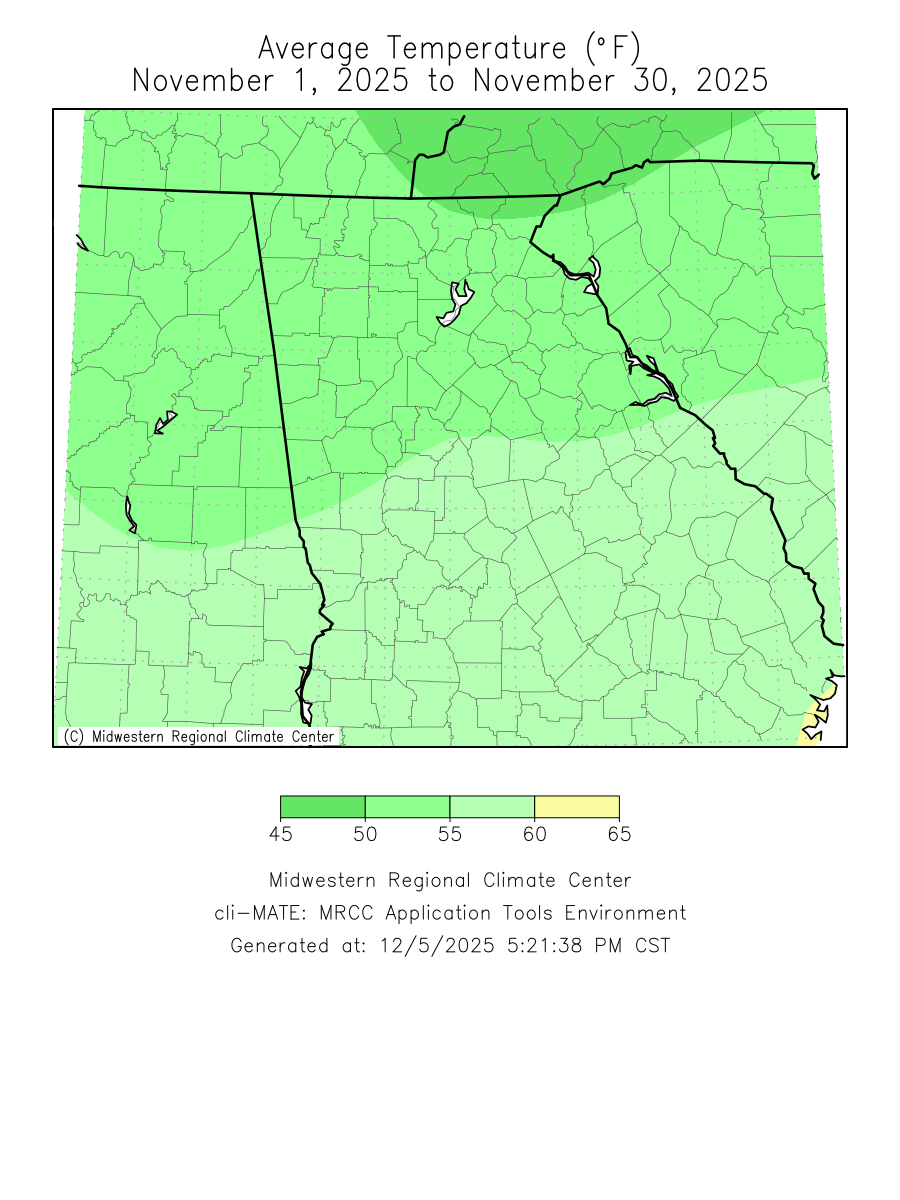
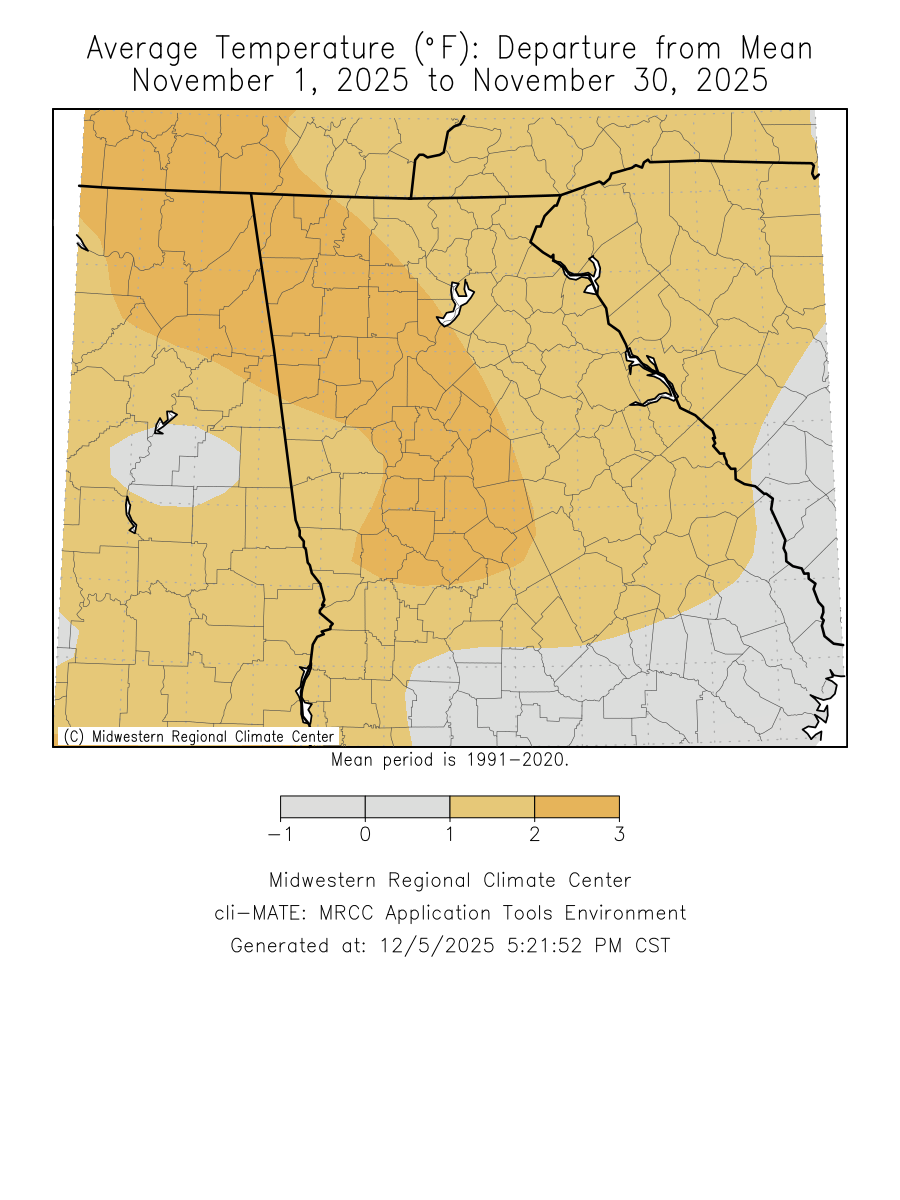
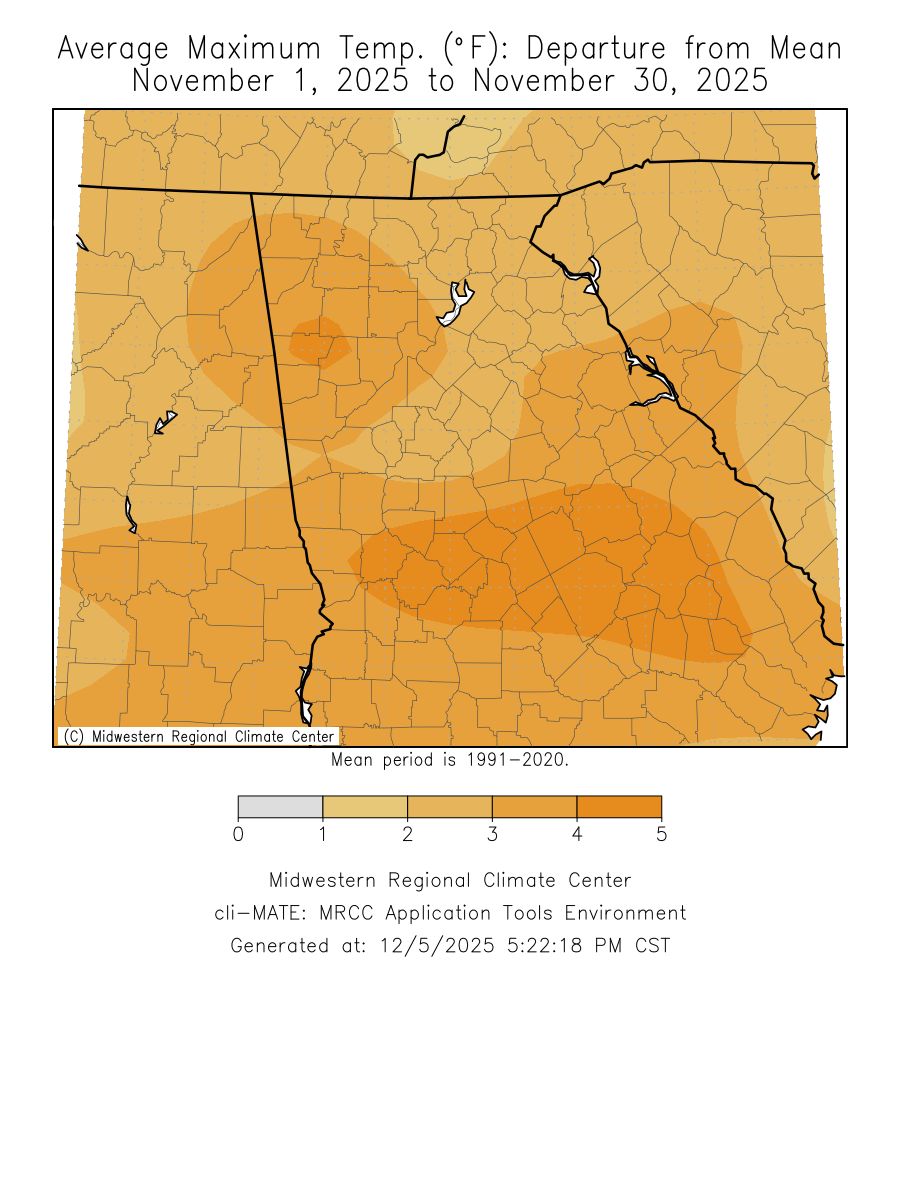
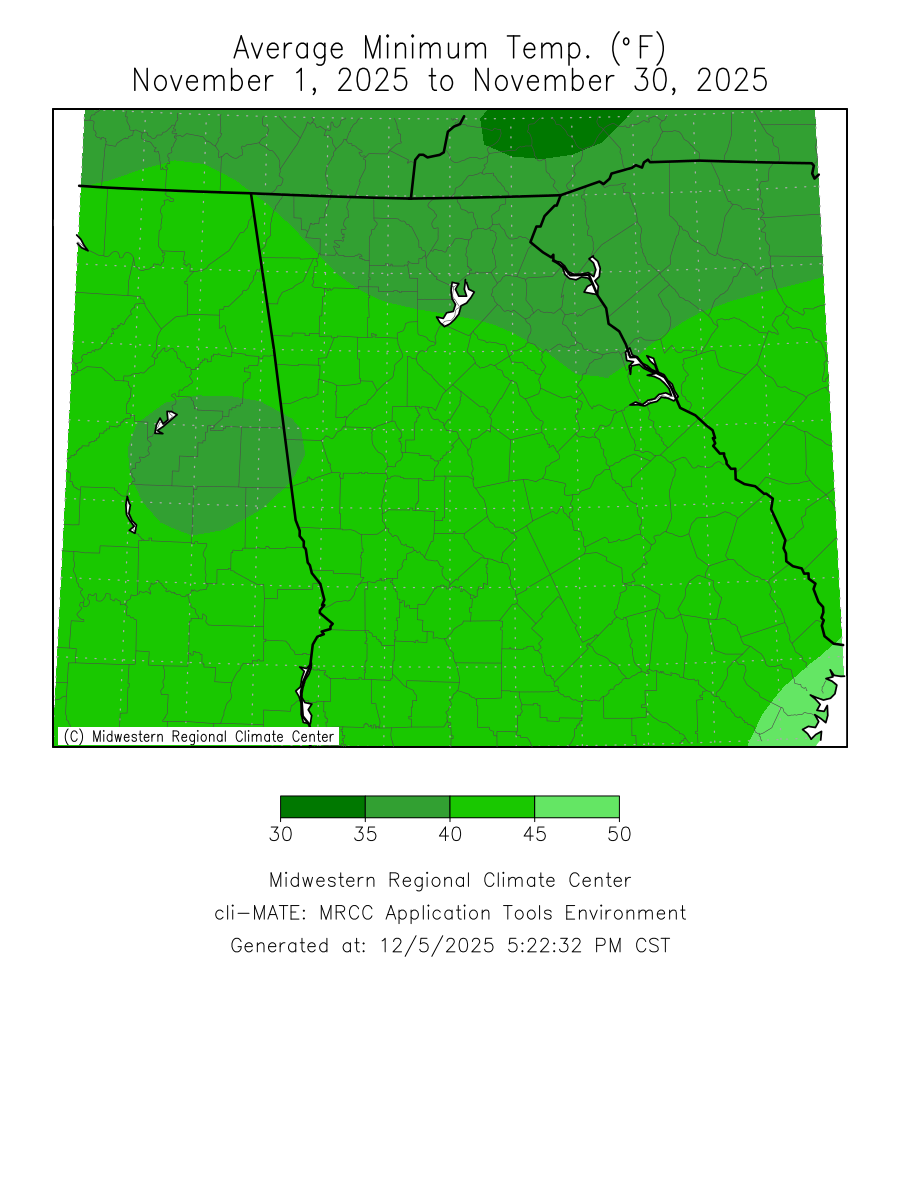
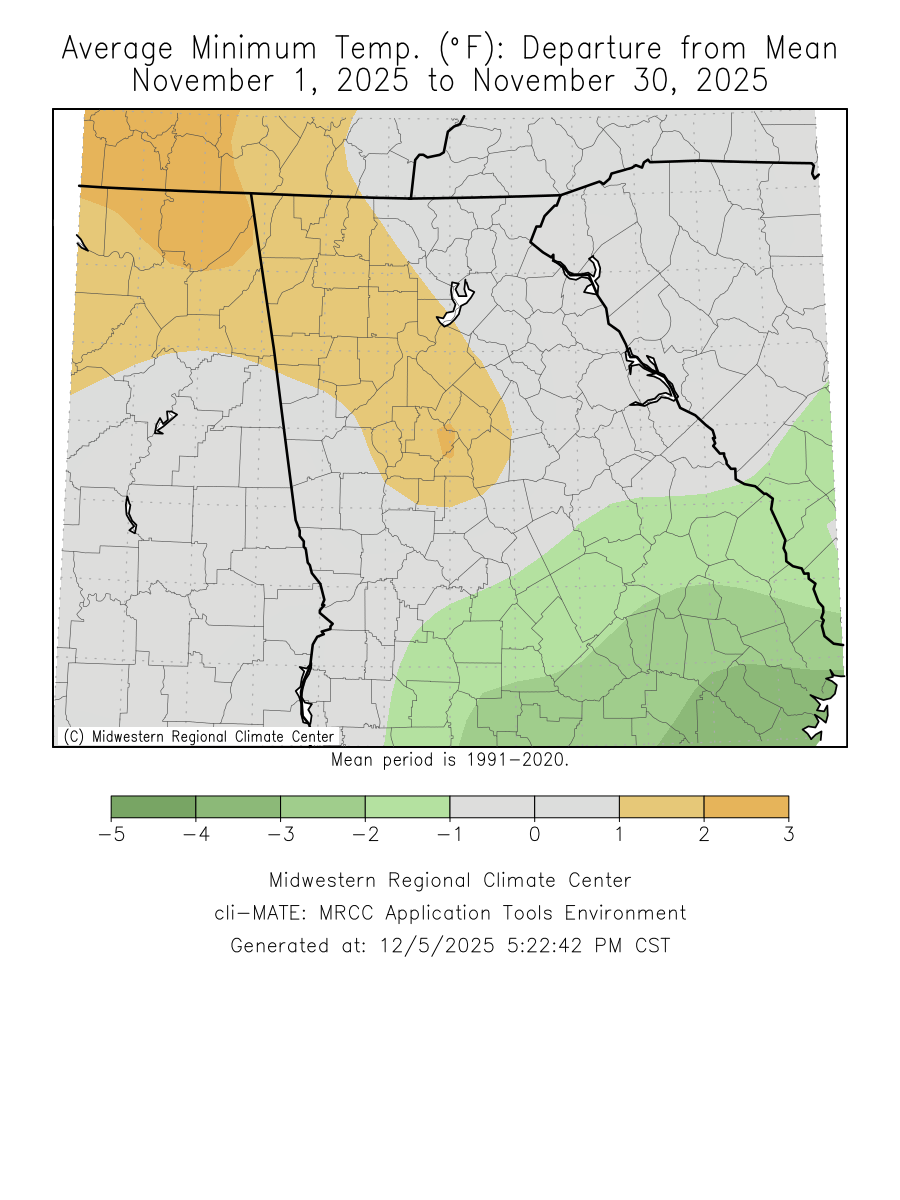
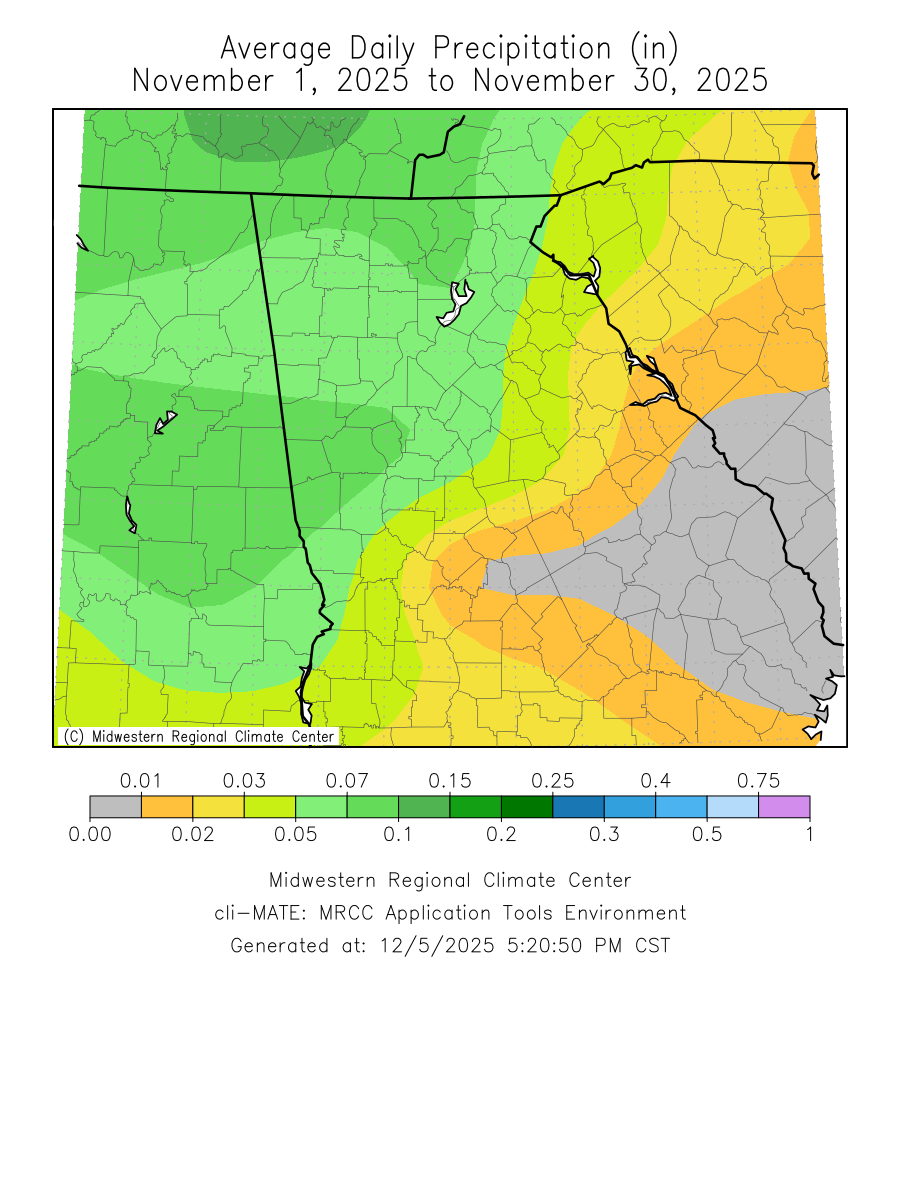
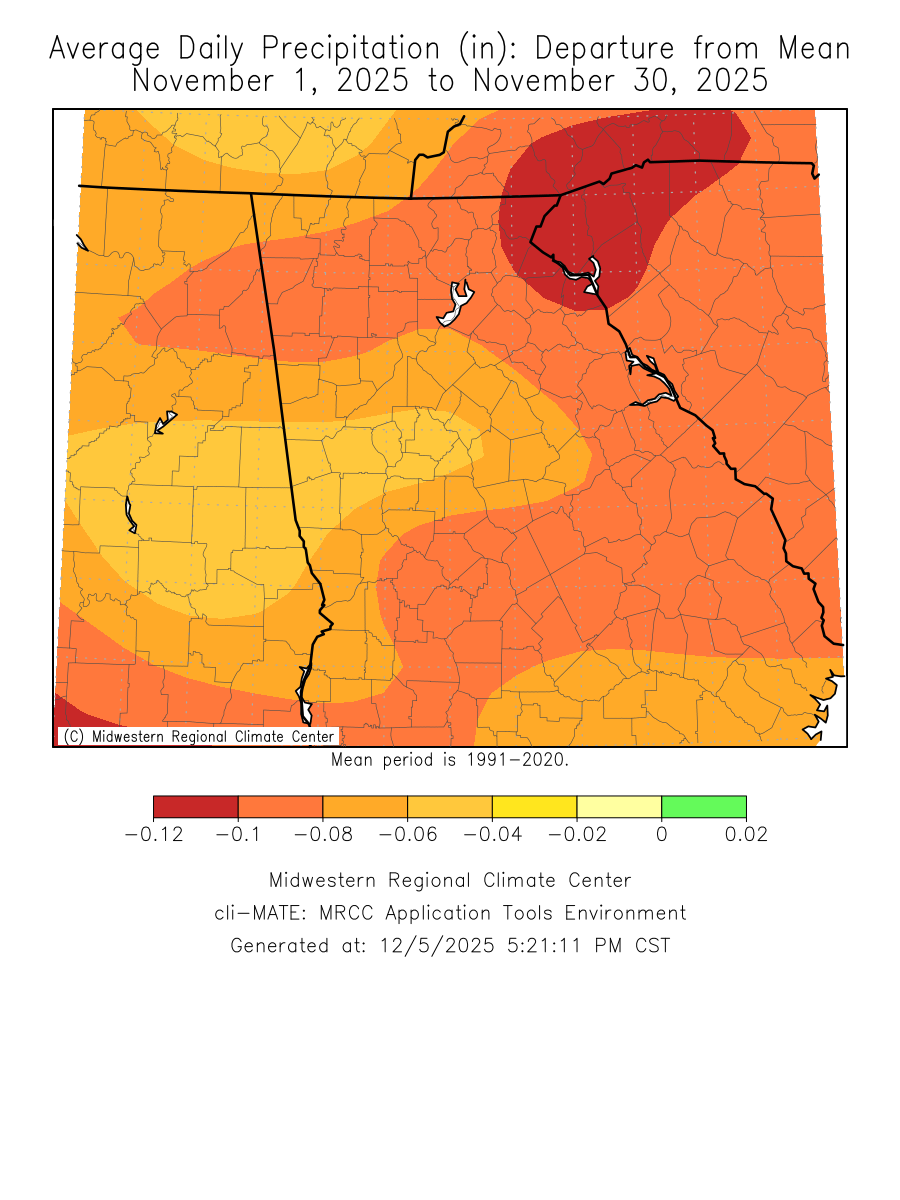
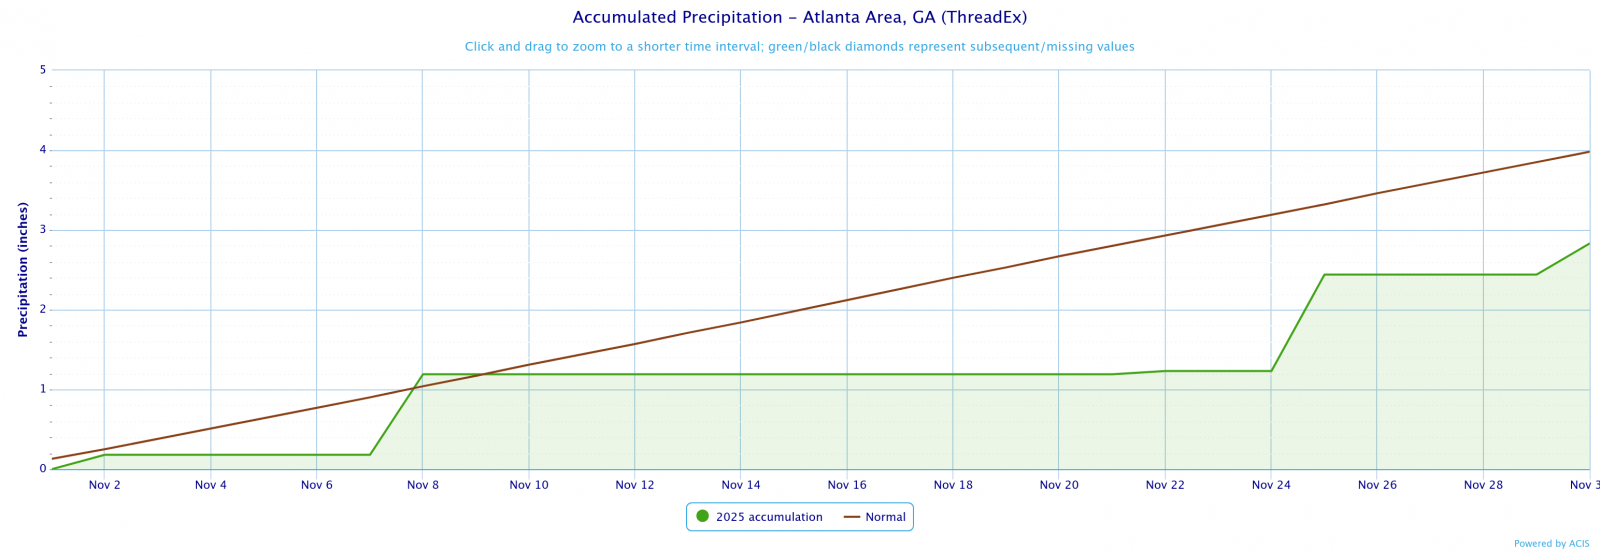
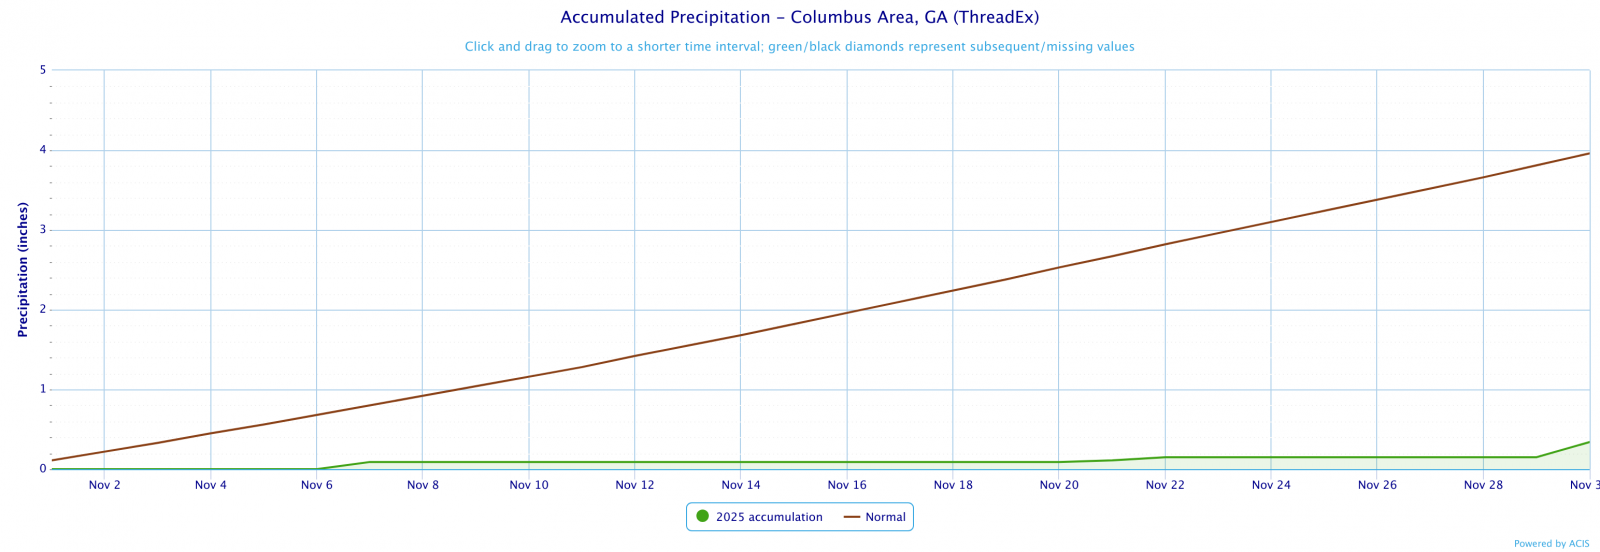
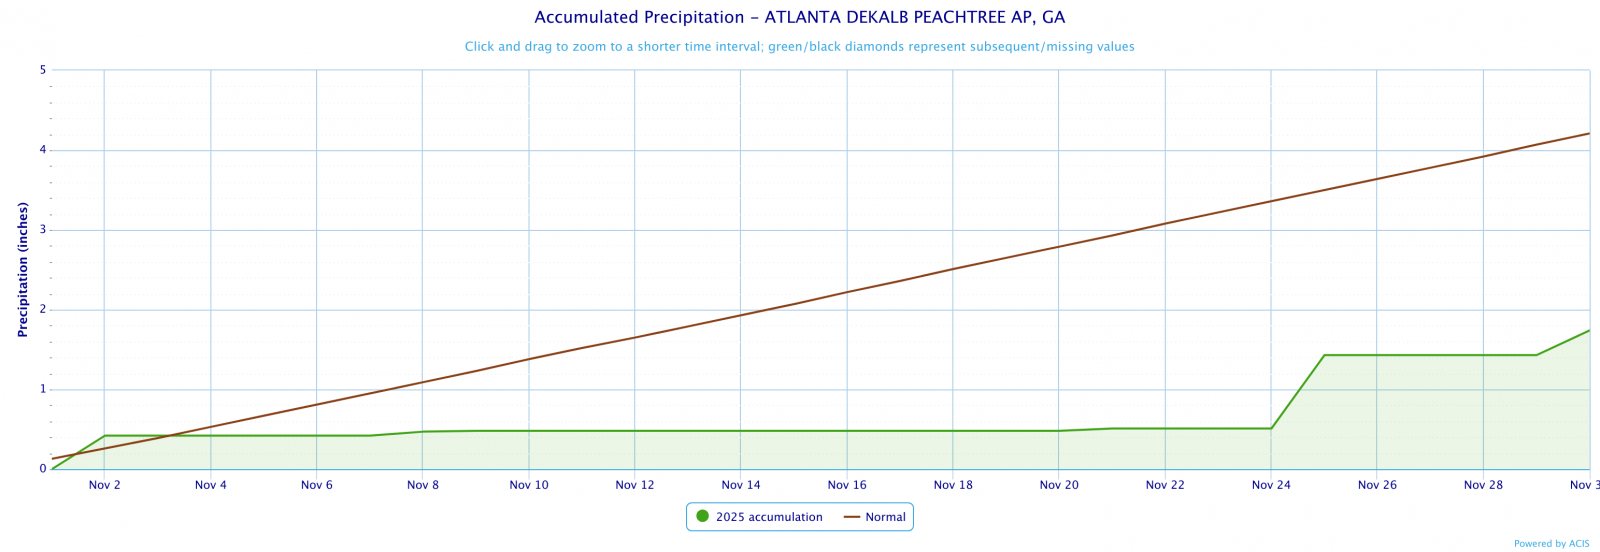
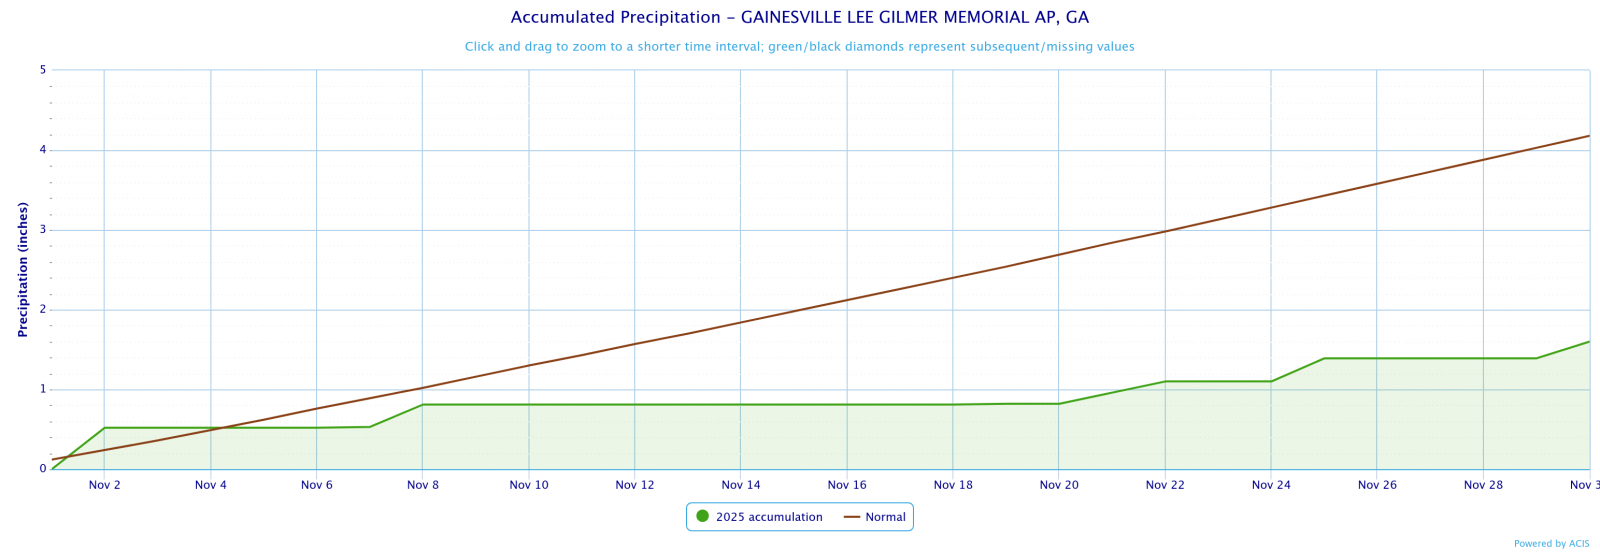
Temperatures through the month of November were around three degrees above normal. Precipitation through the month of November was between two to three inches below normal.
|
November 2025 Climate Averages
|
|||
|
Climate Site
|
November Temp (°F)
|
Average Temp
|
Departure from normal
|
|
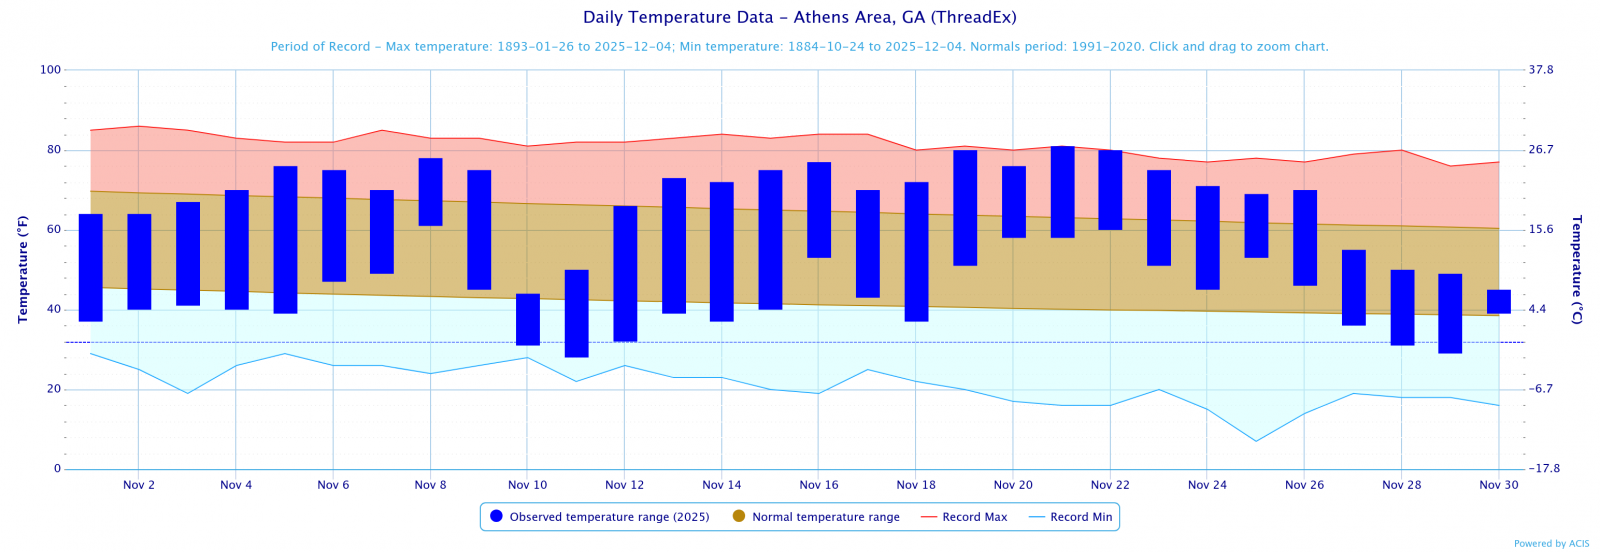
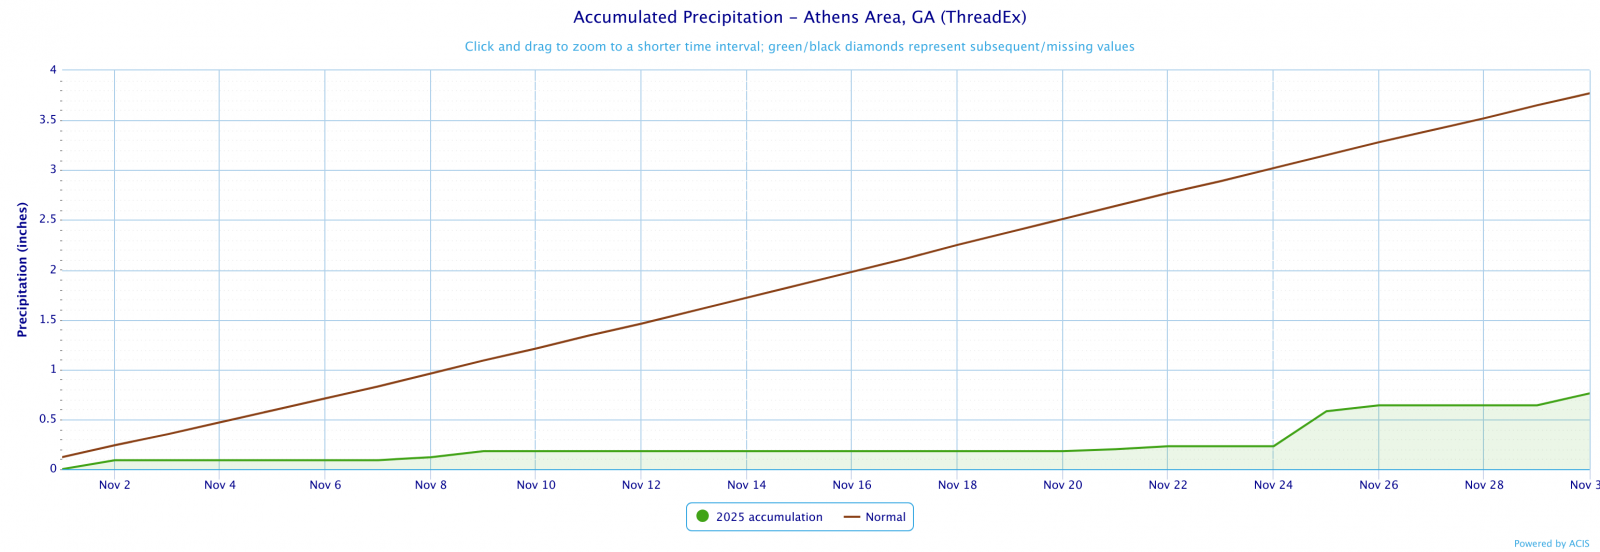
Athens
|
55.6
|
53.3
|
2.3
|
|
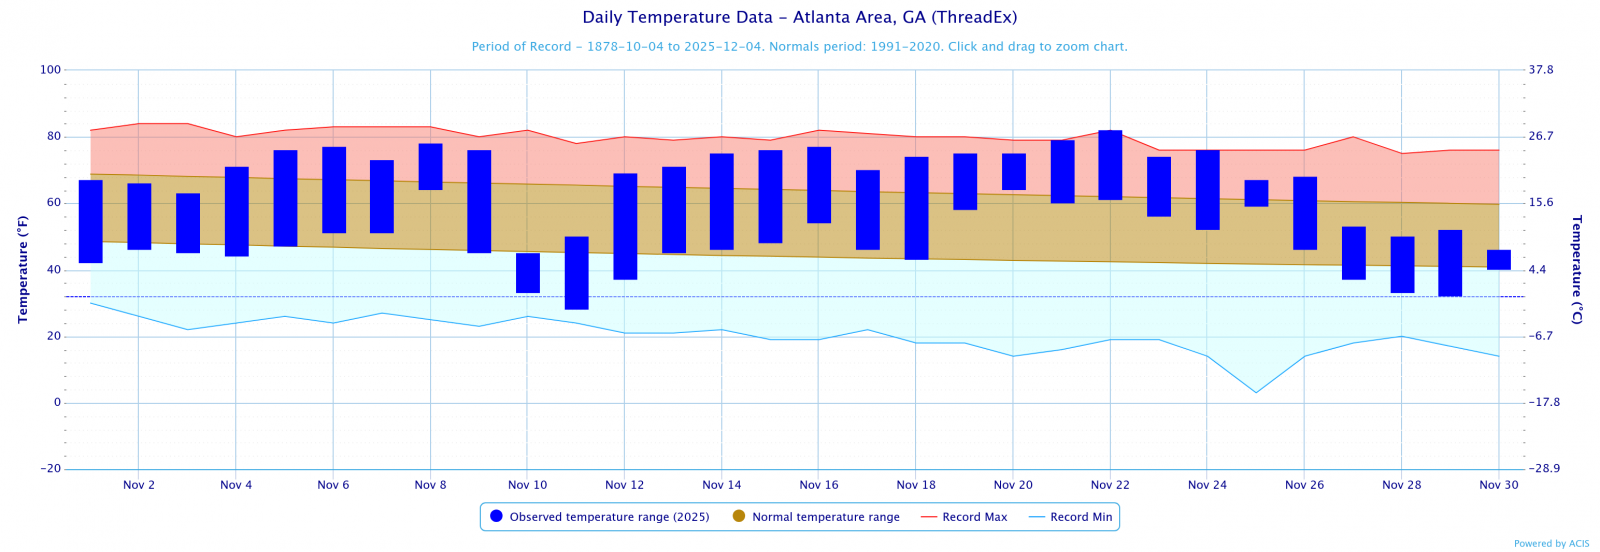
Atlanta
|
57.7
|
54.2
|
3.5
|
|
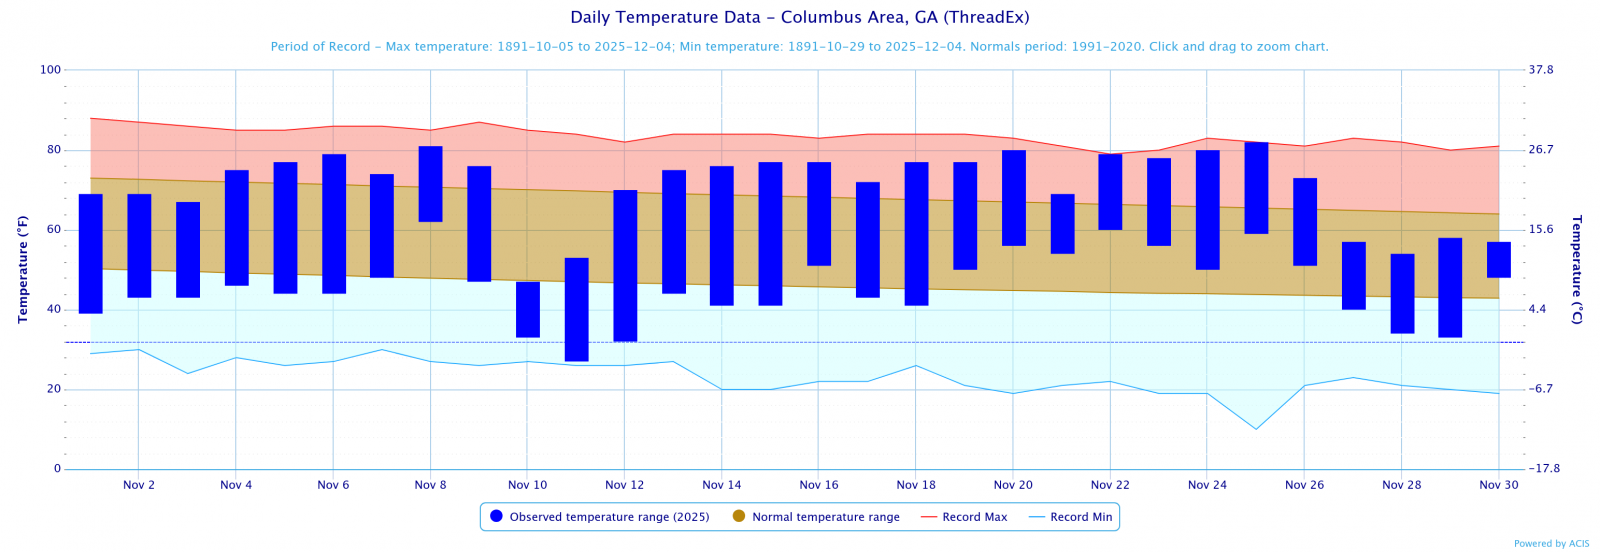
Columbus
|
58.3
|
57.3
|
1.0
|
|
Macon
|
56.9
|
55.8
|
1.1
|
|
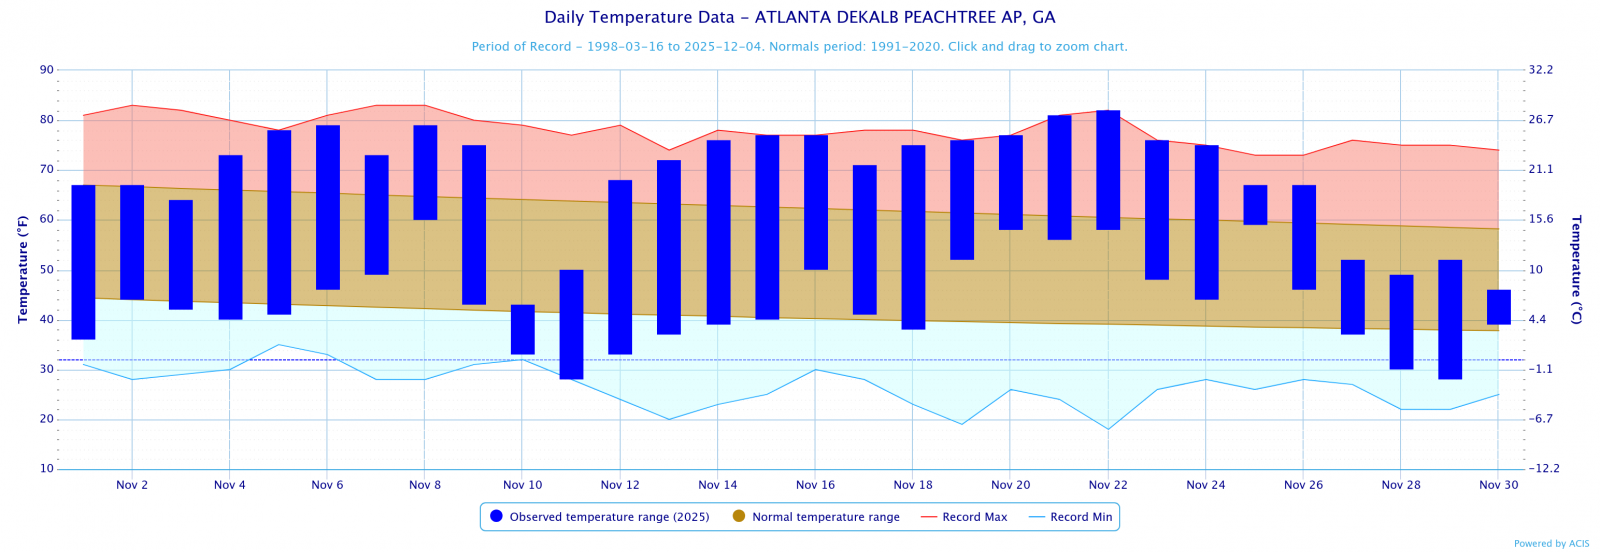
Dekalb Peachtree Arpt
|
56
|
51.5
|
4.5
|
|
Fulton Co Arpt
|
54.4
|
52.3
|
2.1
|
|
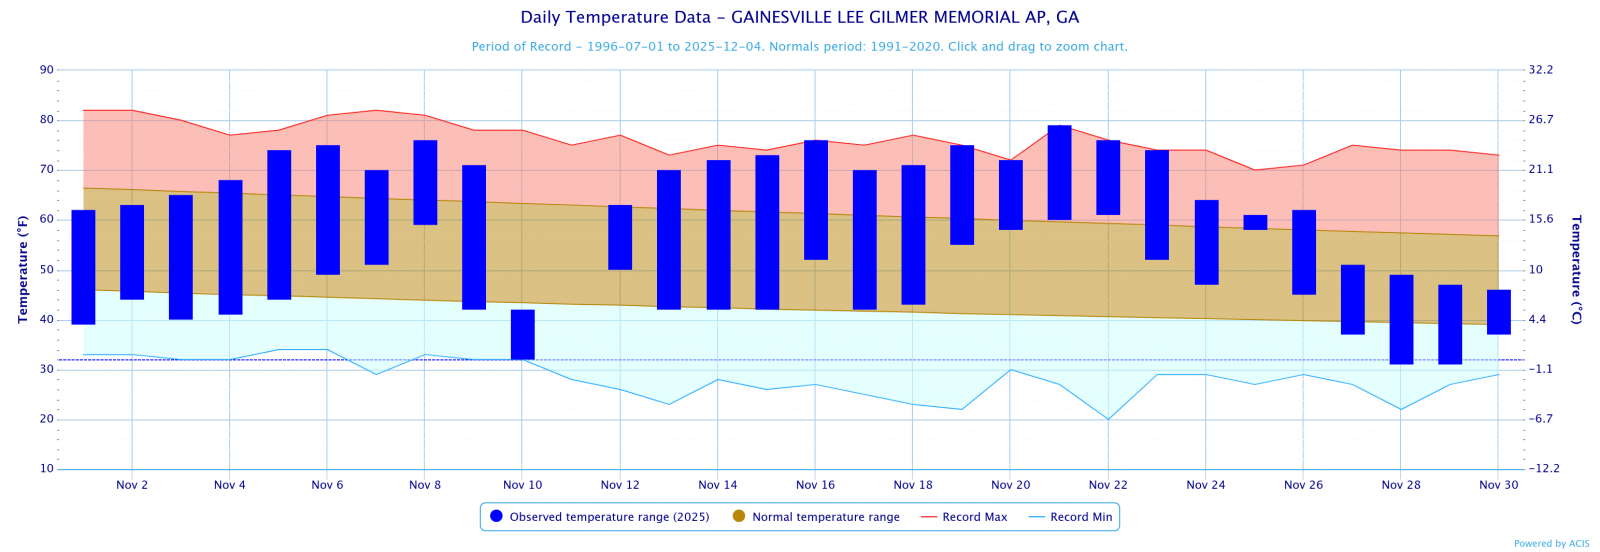
Gainesville
|
55.9
|
51.8
|
4.1
|
|
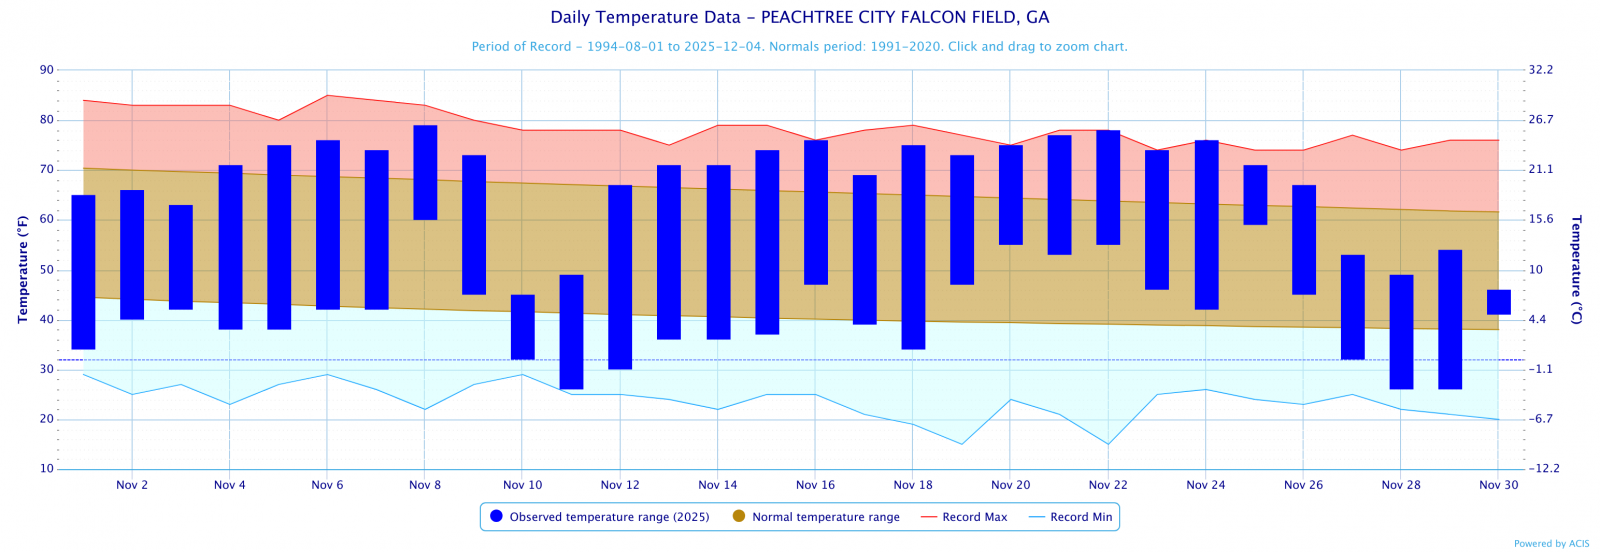
Peachtree City
|
54.3
|
53.2
|
1.1
|
|
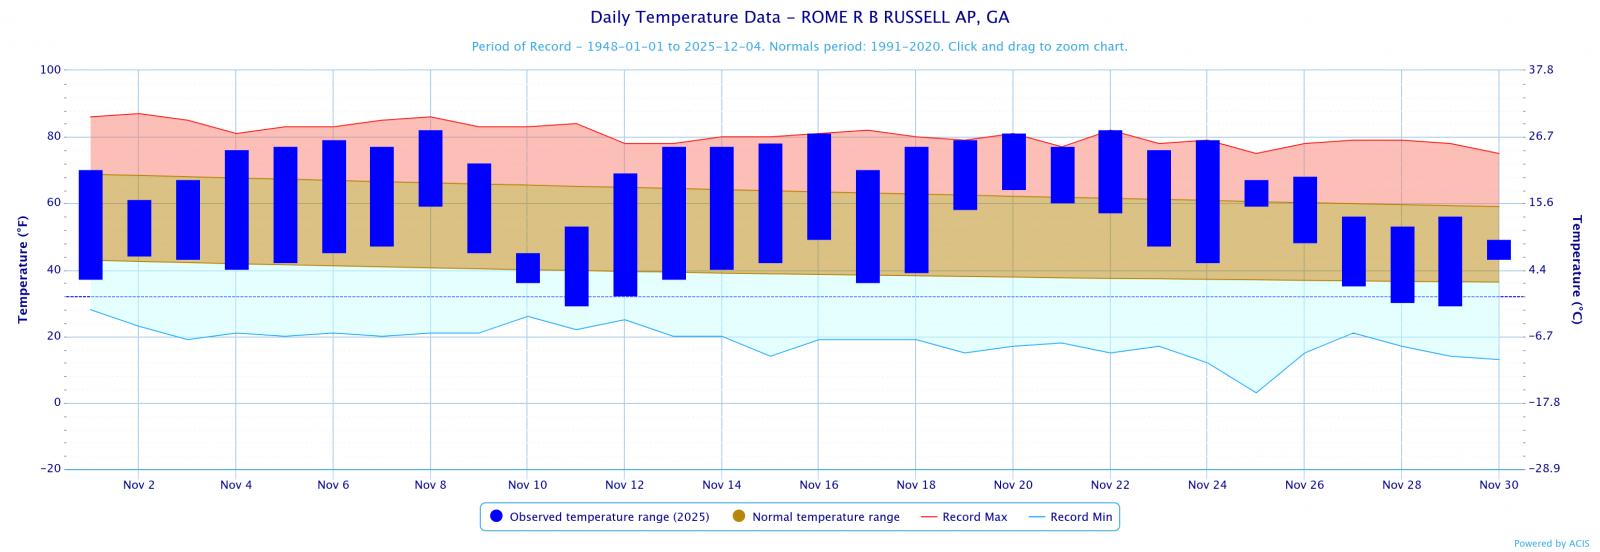
Rome
|
57.1
|
51.4
|
5.7
|
|
November 2025 Temperature Climate Statistics
|
||||
|
Climate Site |
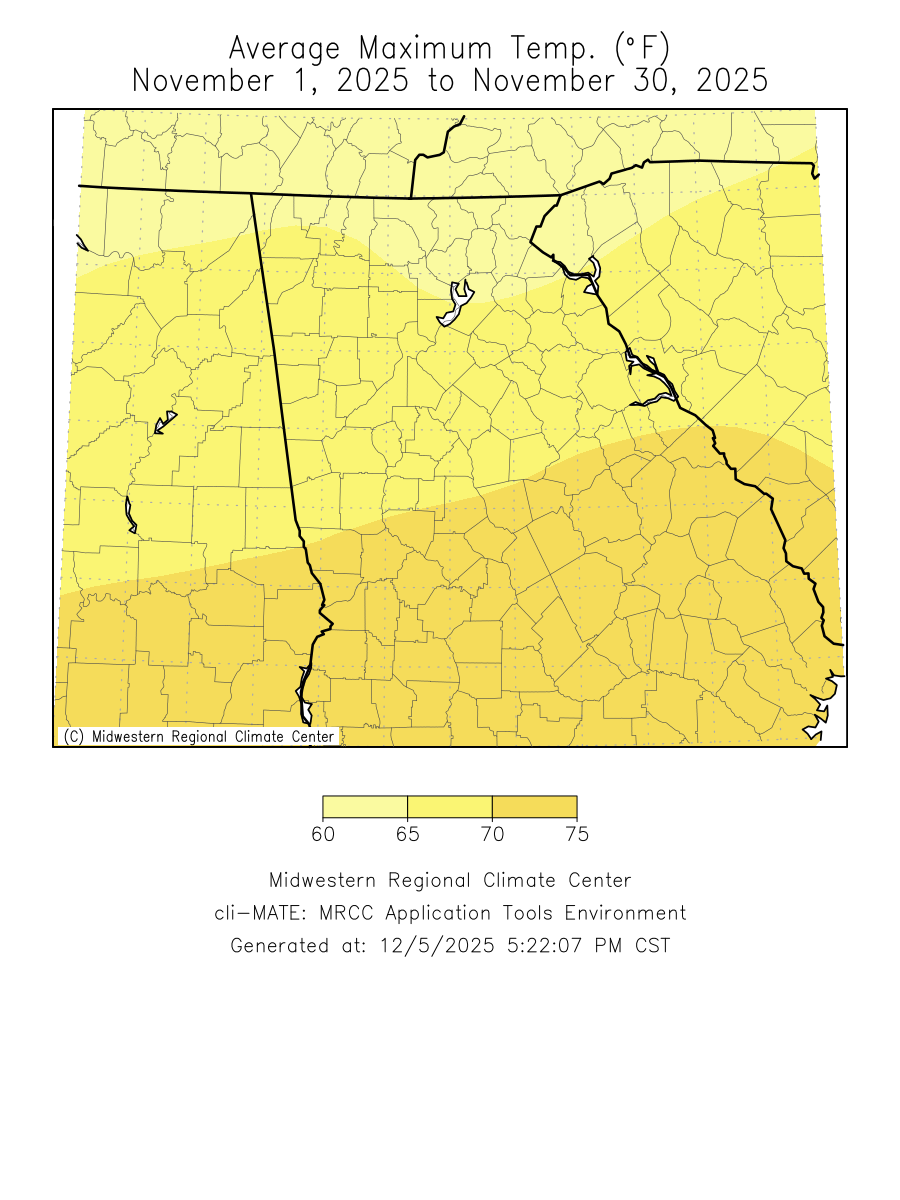
Maximum Temperature |
Max T Date |
Minimum Temperature
|
Min T Date
|
|
Athens
|
81
|
11/21
|
28
|
11/11
|
|
Atlanta
|
82
|
11/22
|
28
|
11/11
|
|
Columbus
|
82
|
11/25
|
27
|
11/11
|
|
Macon
|
84
|
11/19
|
24
|
11/29
|
|
Dekalb Peachtree Arpt
|
82
|
11/22
|
28
|
11/11, 29
|
|
Fulton Co Arpt
|
80
|
11/22
|
26
|
11/29
|
|
Gainesville
|
79
|
11/21
|
31
|
11/28, 29
|
|
Peachtree City
|
79
|
11/8
|
26
|
11/28,29
|
|
Rome
|
82
|
11/8, 22
|
29
|
11/11, 29
|
|
November 2025 Precipitation Climate Statistics
|
|||
|
Climate Site |
Total Precipitation |
Average Precipitation
|
DFN (Departure From Normal)
|
|
Athens
|
0.76
|
3.77
|
-3.01
|
|
Atlanta
|
2.83
|
3.98
|
-1.15
|
|
Columbus
|
0.34
|
3.96
|
-3.62
|
|
Macon
|
0.07
|
3.37
|
-3.30
|
|
Dekalb Peachtree Arpt
|
1.74
|
4.21
|
-2.47
|
|
Fulton County Arpt
|
1.61
|
3.77
|
-2.16
|
|
Gainesville
|
1.6
|
4.18
|
-2.58
|
|
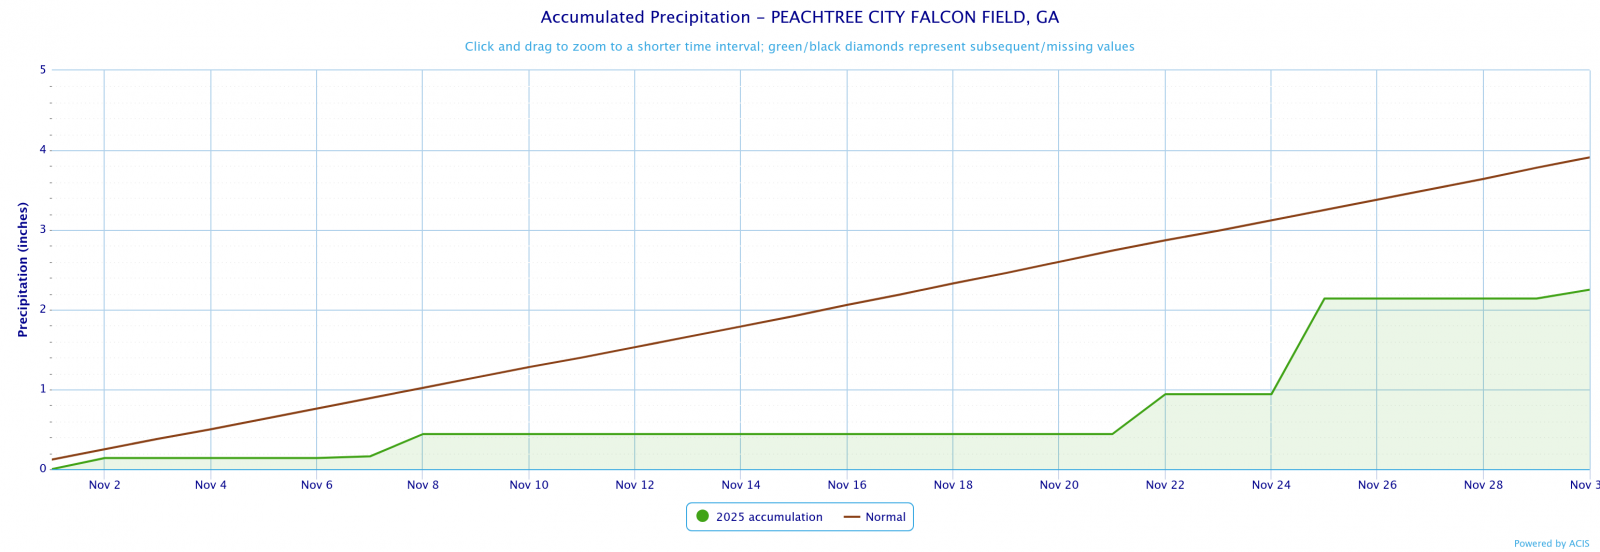
Peachtree City
|
2.25
|
3.91
|
-1.66
|
|
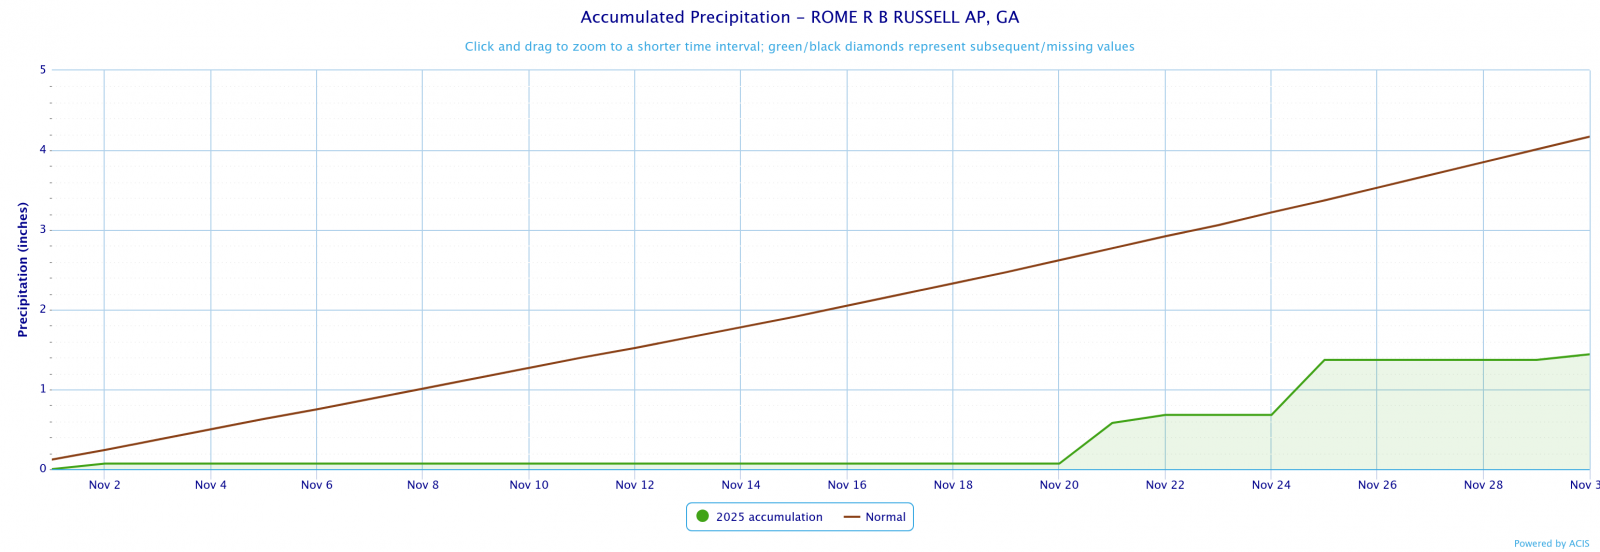
Rome
|
1.44
|
4.17
|
-2.73
|
|
November 2025 Precipitation Climate Statistics
|
||||
|
Climate Site |
Maximum Daily Precip (in inches) |
Max P Date |
||
|
Athens
|
0.41
|
11/25
|
||
|
Atlanta
|
1.21
|
11/25
|
||
|
Columbus
|
0.19
|
11/30
|
||
|
Macon
|
0.03
|
11/21
|
||
|
Dekalb Peachtree Arpt
|
0.92
|
11/25
|
||
|
Fulton Co Arpt
|
0.78
|
11/25
|
||
|
Gainesville
|
0.52
|
11/2
|
||
|
Peachtree City
|
1.20
|
11/25
|
||
|
Rome
|
0.69
|
11/25
|
||
Data prepared by NWS Peachtree City/Atlanta
| Temperature Maps | Precipitation Maps |
| Temperature Graphs | Precipitation Graphs |


|
November 2025 Climate Records
|
|||
|
Date
|
Type
|
Location
|
Records set over a 24-hour period
|
|
11/10
|
Min Temp
|
Macon |
Macon fell to 29°F which ties the record of 29°F set in 1923.
|
|
11/11
|
Min Temp
|
Macon |
Macon fell to 25°F which broke the record of 26°F set in 1913.
|
|
11/19
|
Max Temp
|
Macon
|
Macon rose to 84°F which broke the record of 83°F in 1942.
|
|
11/20
|
Max Temp
|
Macon
|
Macon rose to 81°F which ties the record of 81°F in 1991.
|
|
11/22
|
Max Temp
|
Macon
|
Macon rose to 83°F which broke the record of 80°F in 1942.
|
|
11/25
|
Max Temp
|
Macon
|
Macon rose to 82°F which broke the record of 80°F in 1958.
|
|
11/22
|
Max Temp
|
Columbus |
Columbus rose to 79°F which ties the record of 79°F in 1934.
|
|
11/25
|
Max Temp
|
Columbus
|
Columbus rose to 82°F which ties the record of 82°F in 1921.
|
|
11/21
|
Max Temp
|
Atlanta
|
Atlanta rose to 79°F which broke the record of 77°F in 2011.
|
|
11/22
|
Max Temp
|
Atlanta
|
Atlanta rose to 82°F which broke the record of 77°F in 2011.
|
|
11/24
|
Max Temp
|
Atlanta
|
Atlanta rose to 76°F which ties the record of 76°F in 2014.
|
|
11/21
|
Max Temp
|
Athens
|
Athens rose to 81°F which broke the record of 79°F in 1942.
|
|
11/22
|
Max Temp
|
Athens
|
Athens rose to 80°F which broke the record of 79°F in 1983.
|
Based on the Climate Prediction Center's outlook for December, Georgia has a 30-50% chance for above normal temperatures. For precipitation, most of Georgia has of south and central Georgia has a 40-60% chance of below normal precipitation while the remainder of Georgia has an equal chance of above or below normal precipitation.
 |
 |

