| Previous Month | Next Month |
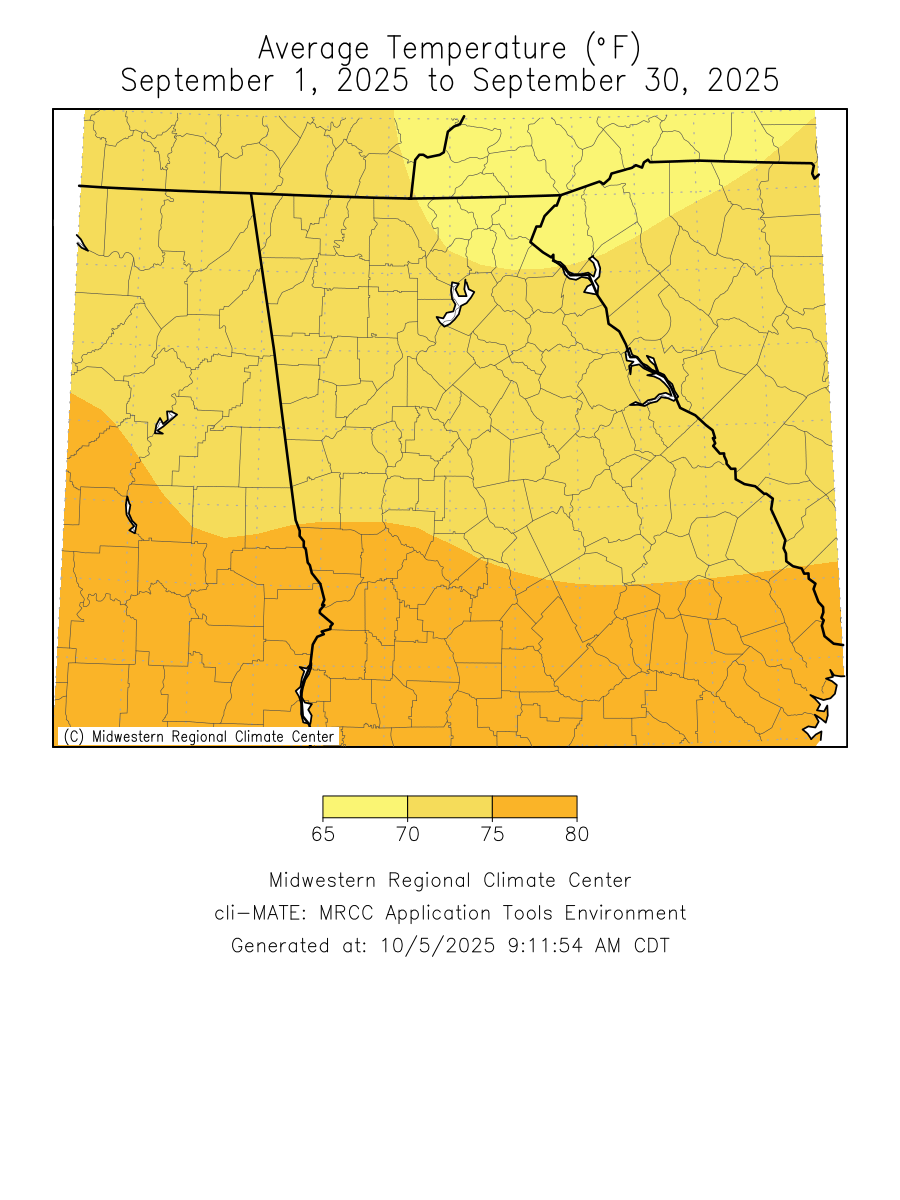
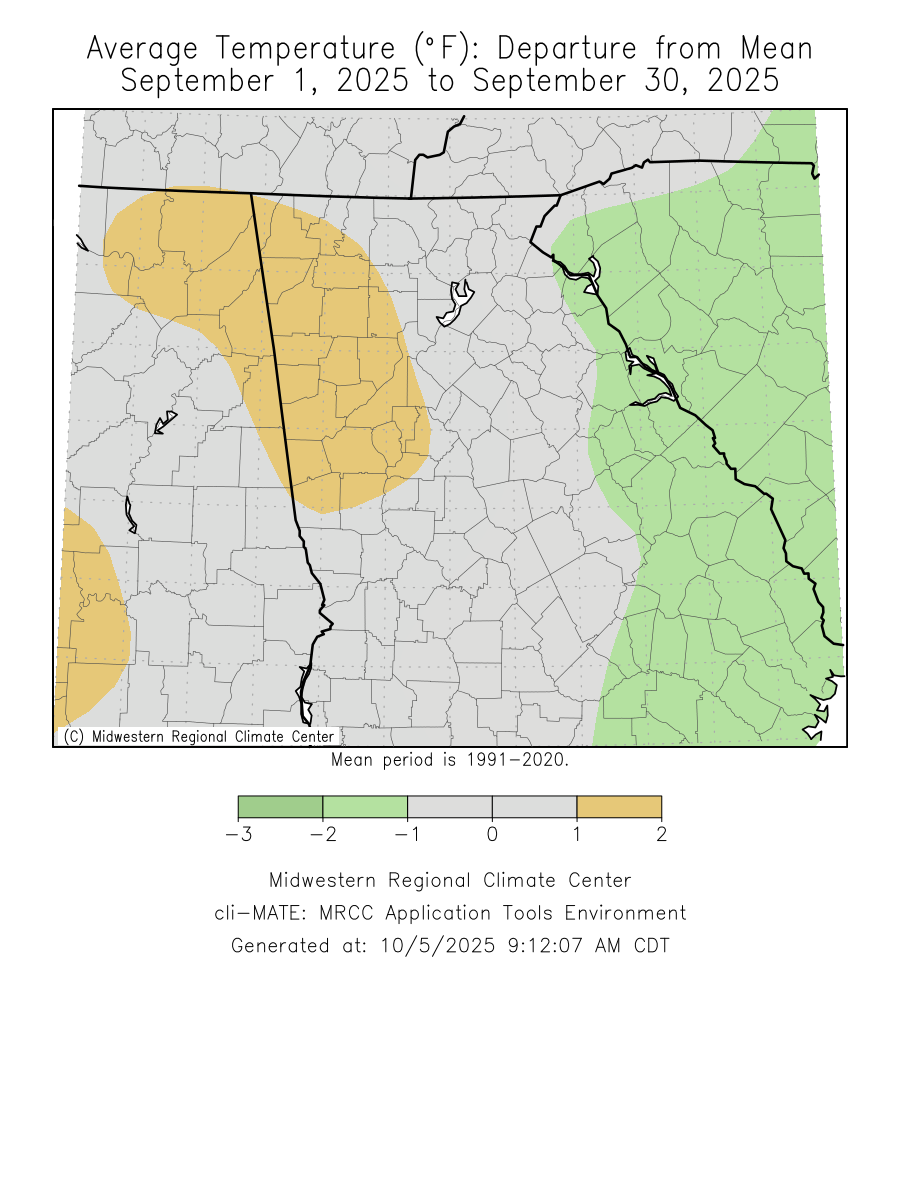
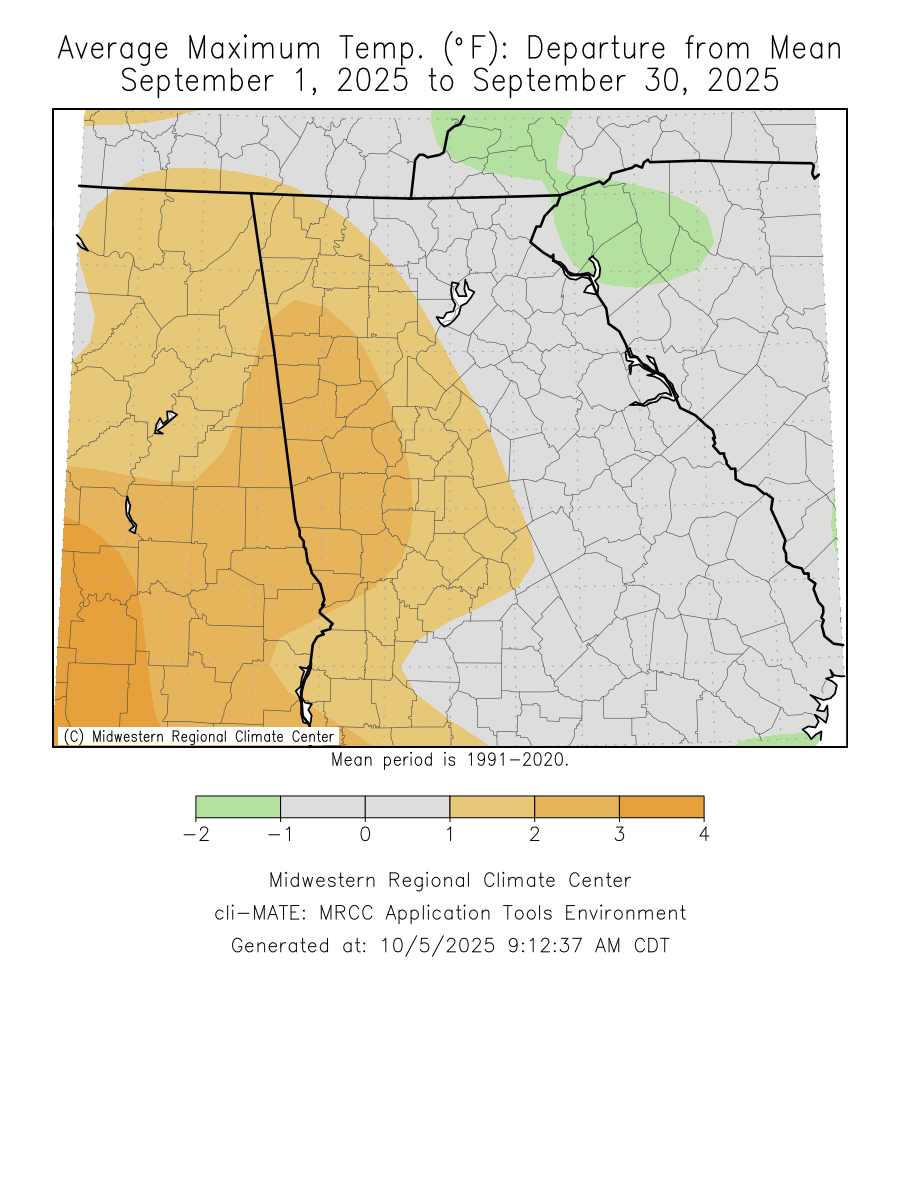
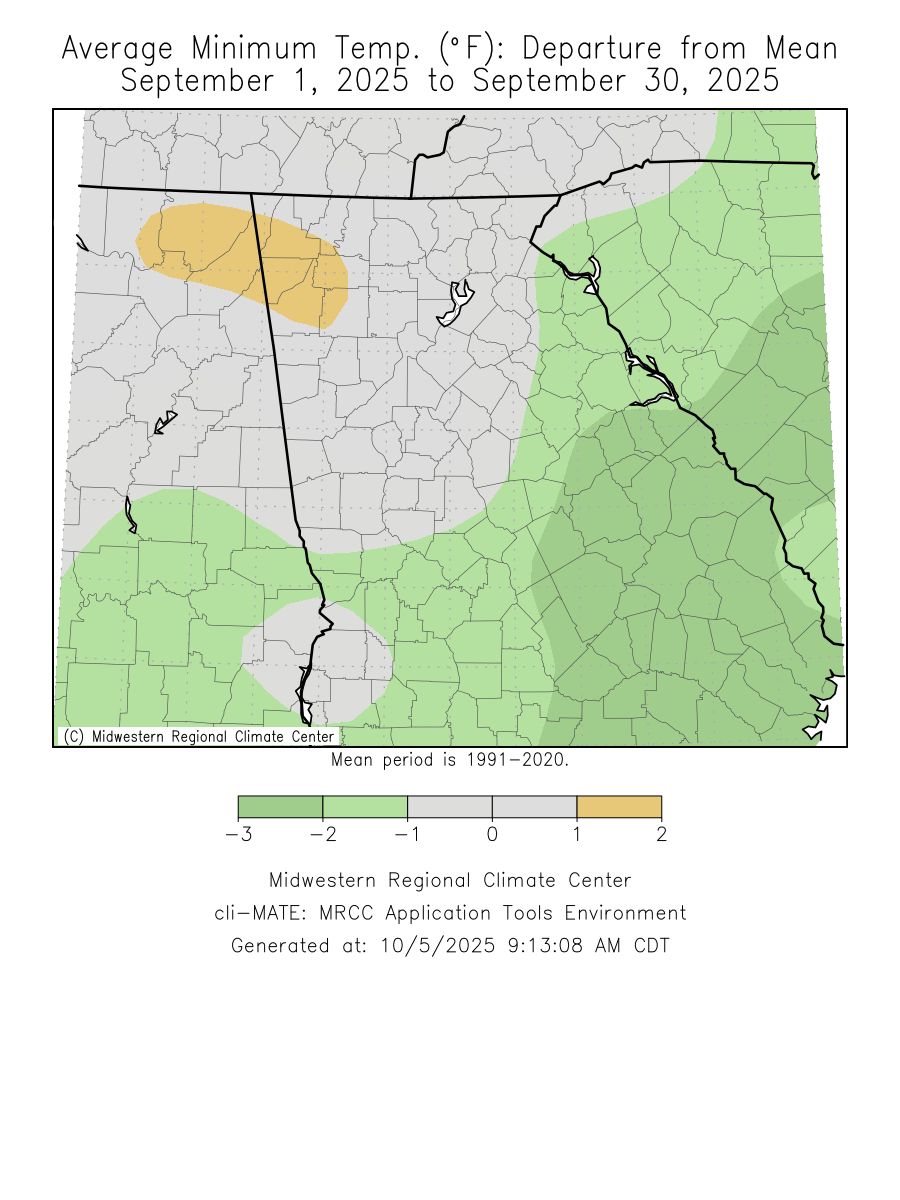
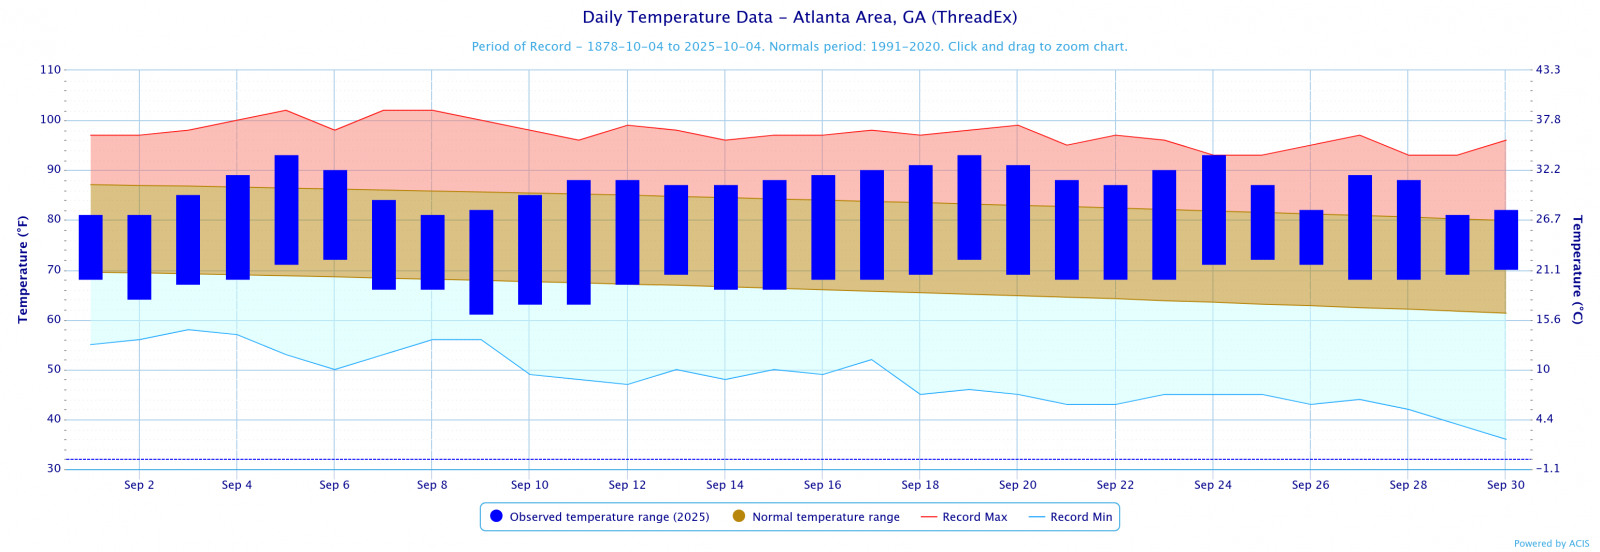
Temperatures through the month of September were within one degree of normal. Precipitation through the month of September was around two degrees below normal.
Climate Site Maximum Temperature Max T Date Climate Site Total Precipitation DFN (Departure Climate Site Maximum Daily Precip (in inches) Max P Date * indicates a daily record was broken Data prepared by NWS Peachtree City/Atlanta Based on the Climate Prediction Center's outlook for October, north and central Georgia has a 30-50% of above normal temperatures. North and central Georgia has equal chances to see above or below normal precipitation.
Overview
Climate Graphs
Records
Events
October Outlook
Below are the overview stats for September 2025 for our 9 climate sites.
Sep 2025 Climate Averages
Climate Site
Sep Temp (°F)
Average Temp
Departure from Normal
Athens
73.5
73.9
-0.5
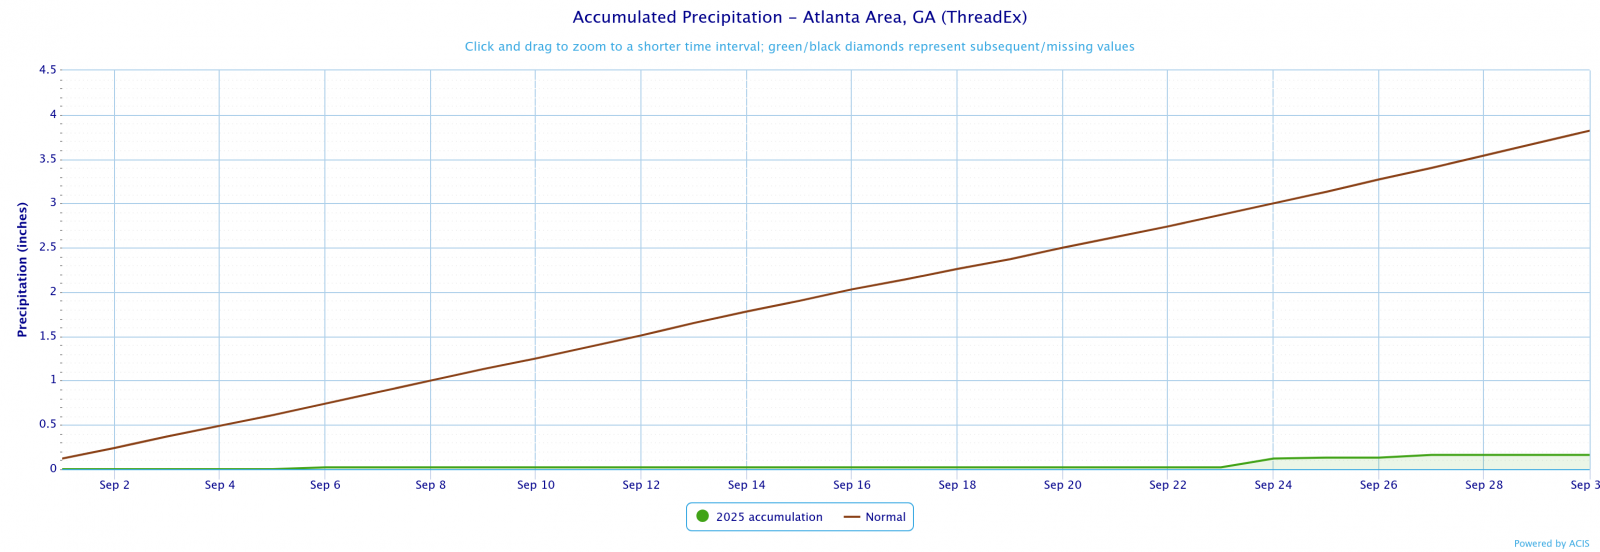
Atlanta
77.4
74.9
2.5
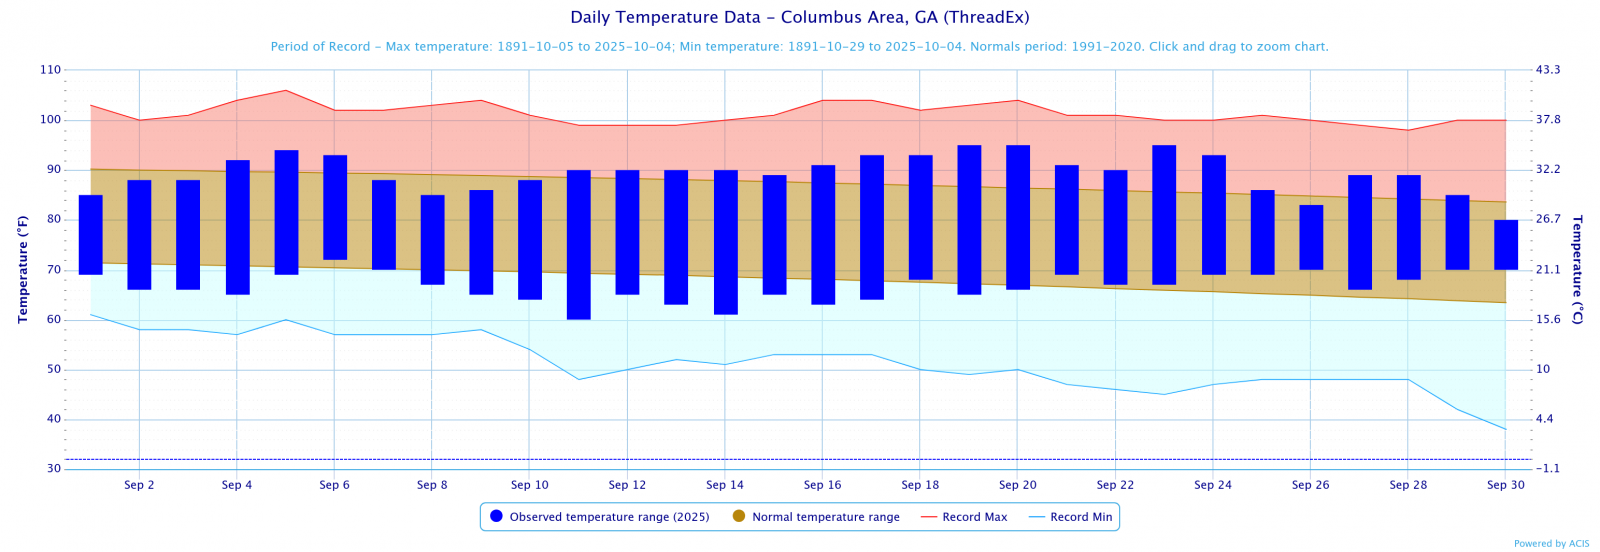
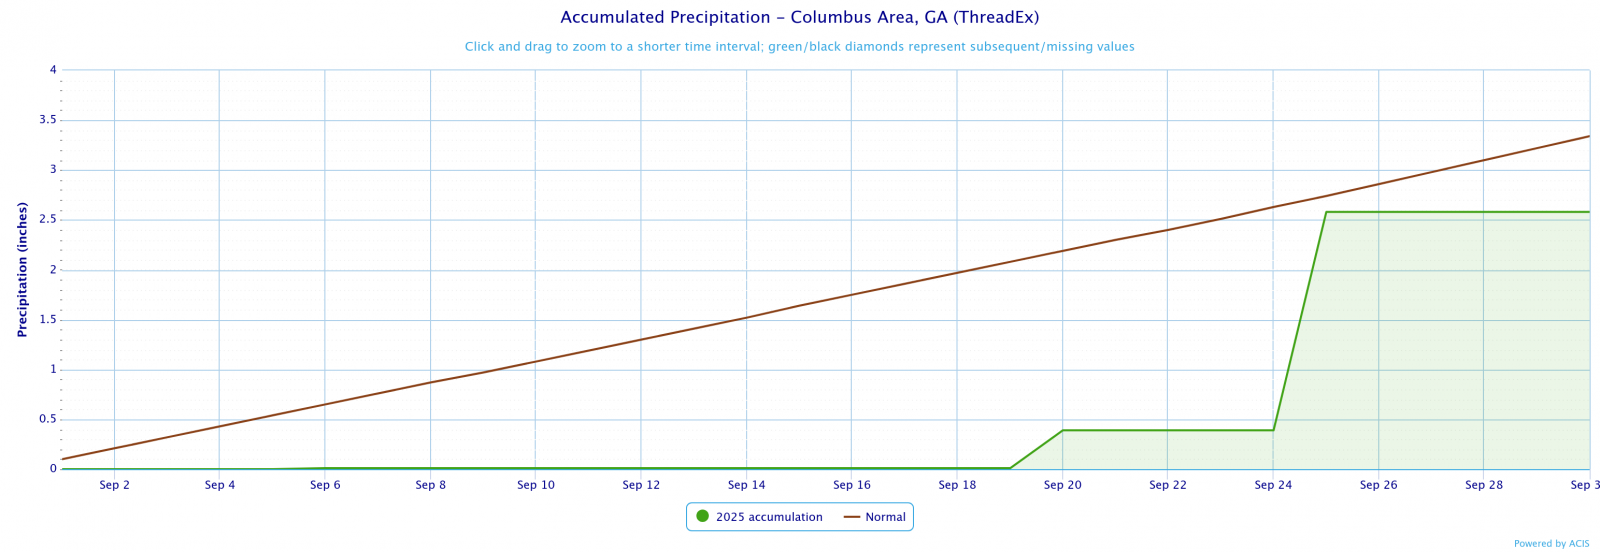
Columbus
78.0
77.6
0.4
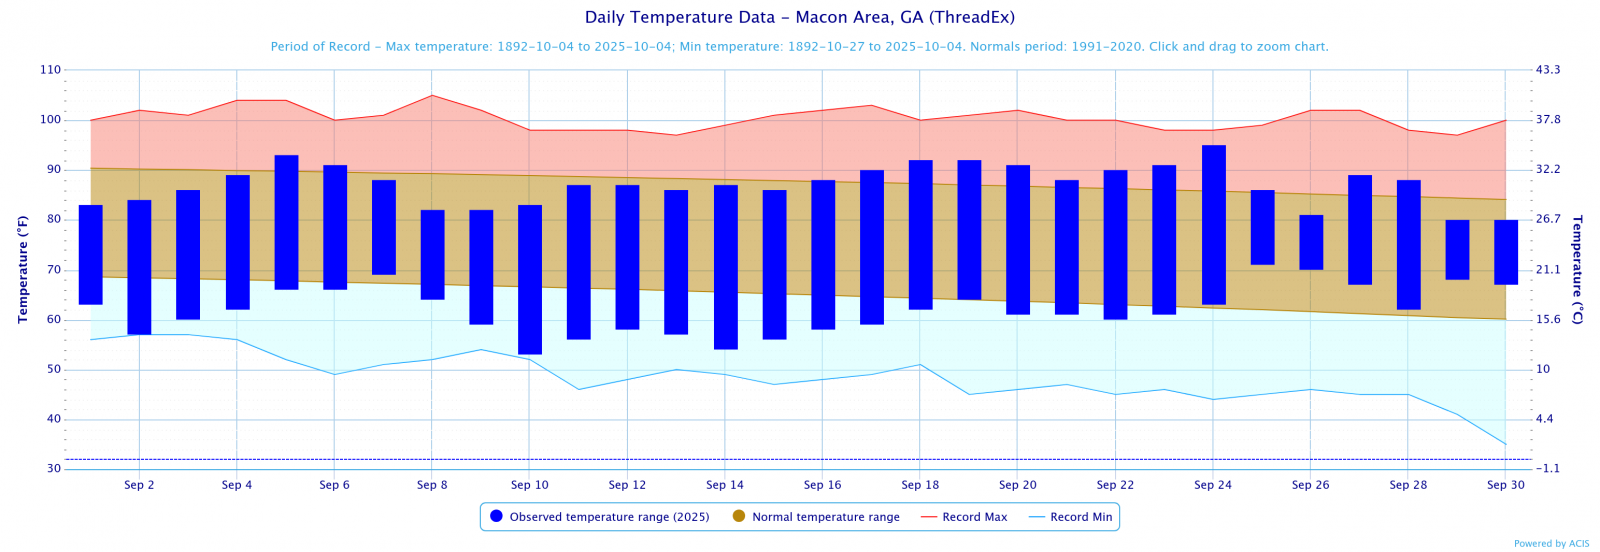
Macon
74.5
76.2
-1.7
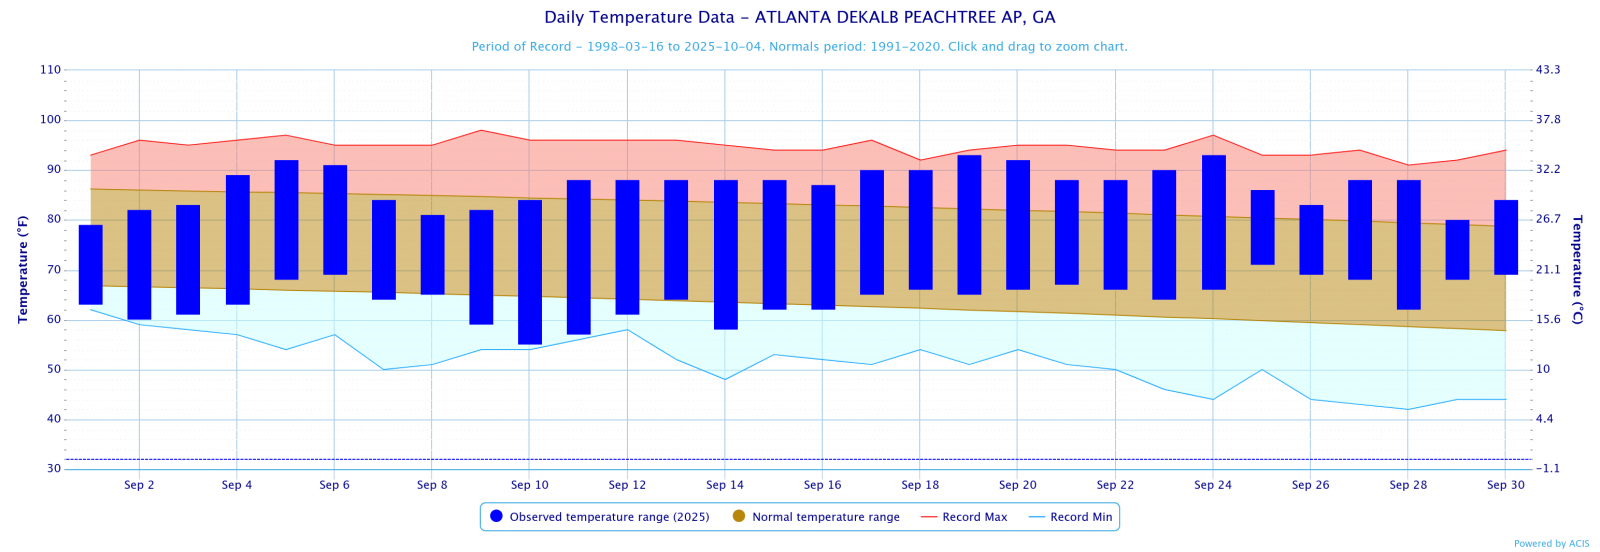
Dekalb Peachtree Arpt
72.5
72.9
-1.7
Fulton Co Arpt
74.3
73.5
1.2
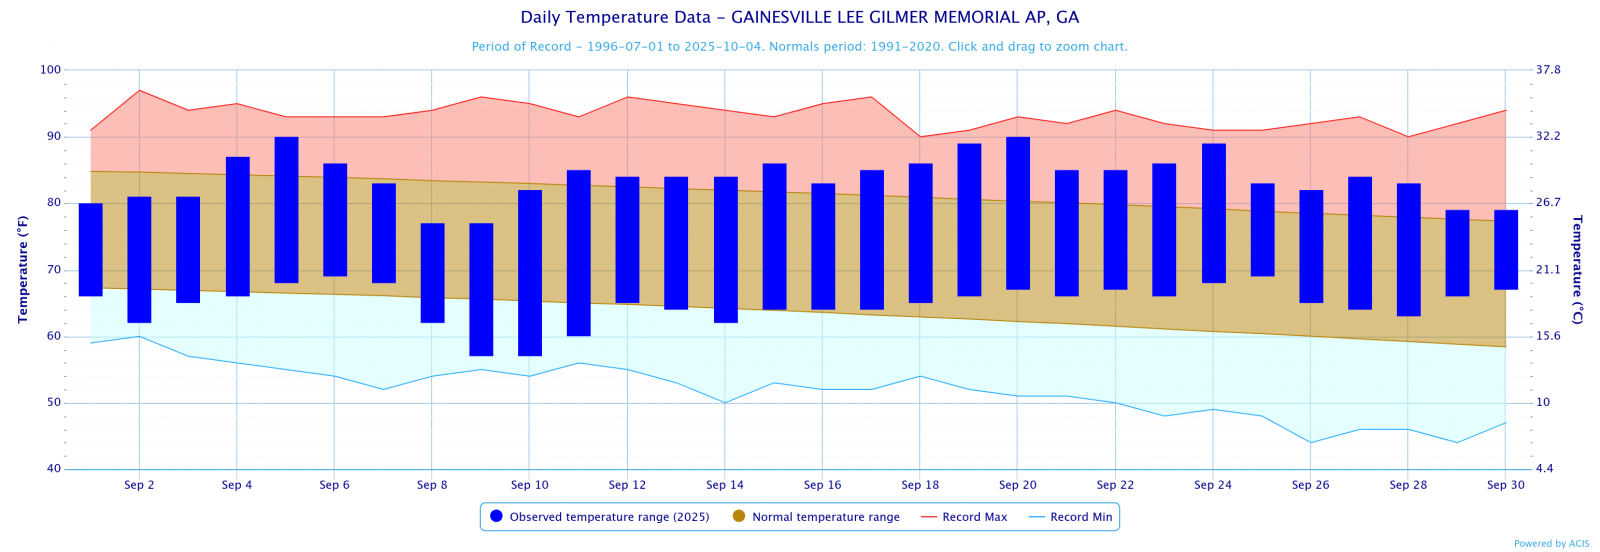
Gainesville
74.3
72.4
1.9
Peachtree City
74.0
74.2
-0.2
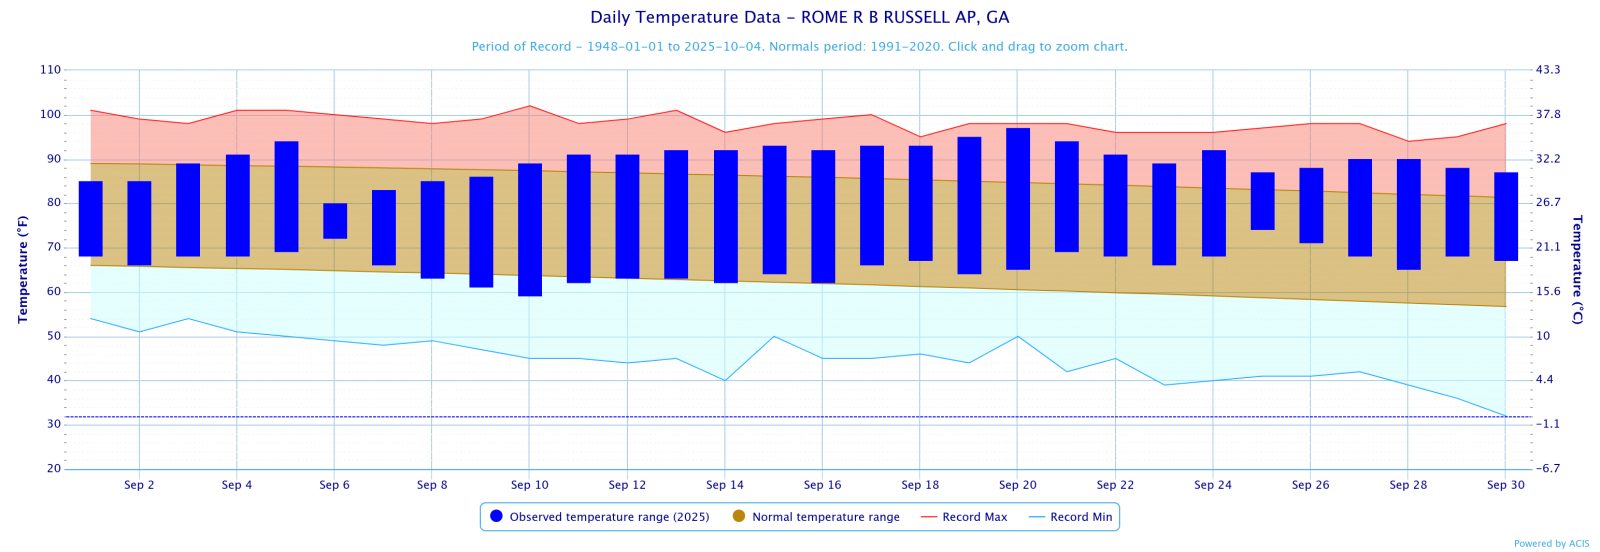
Rome
77.9
73.8
4.1
Sep 2025 Temperature Climate Statistics
Minimum Temperature
Min T Date
Athens
93
9/24
54*
9/10
Atlanta
93
9/19, 24
61
9/9
Columbus
95
9/20, 23
60
9/11
Macon
95
9/24
53
9/10
Dekalb Peachtree Arpt
93
9/19, 24
55
9/10
Fulton Co Arpt
92
9/20
54
9/10
Gainesville
90
9/15, 20
57
9/9, 10
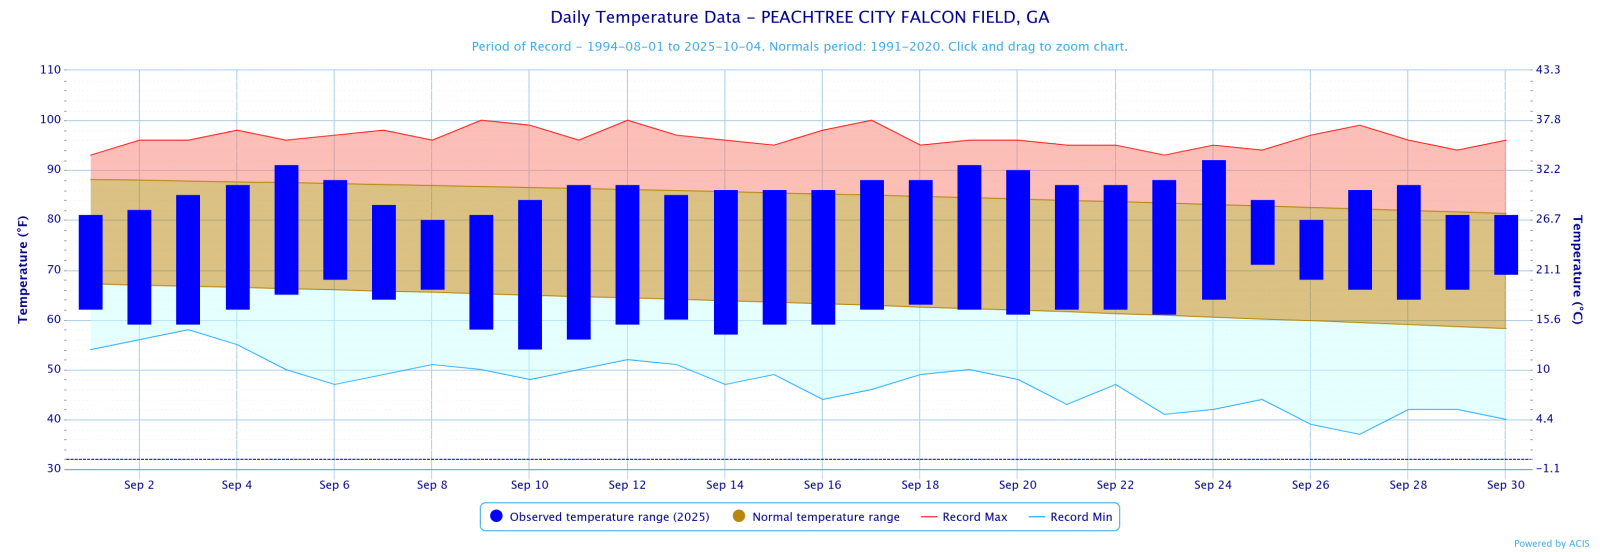
Peachtree City
92
9/24
54
9/10
Rome
97
9/10
59
9/10
Sep 2025 Precipitation Climate Statistics
Average Precipitation
From Normal)
Athens
3.43
3.89
-0.46
Atlanta
0.16
3.82
-3.66
Columbus
2.58
3.34
-0.76
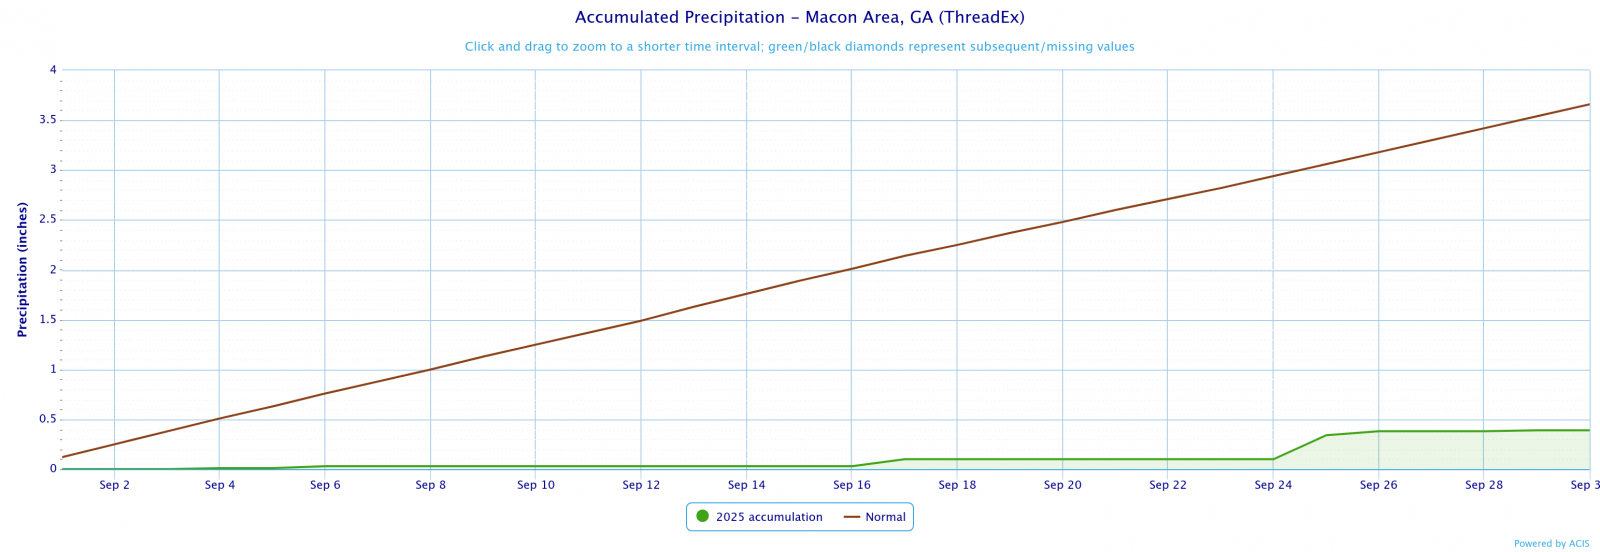
Macon
0.39
3.66
-3.27
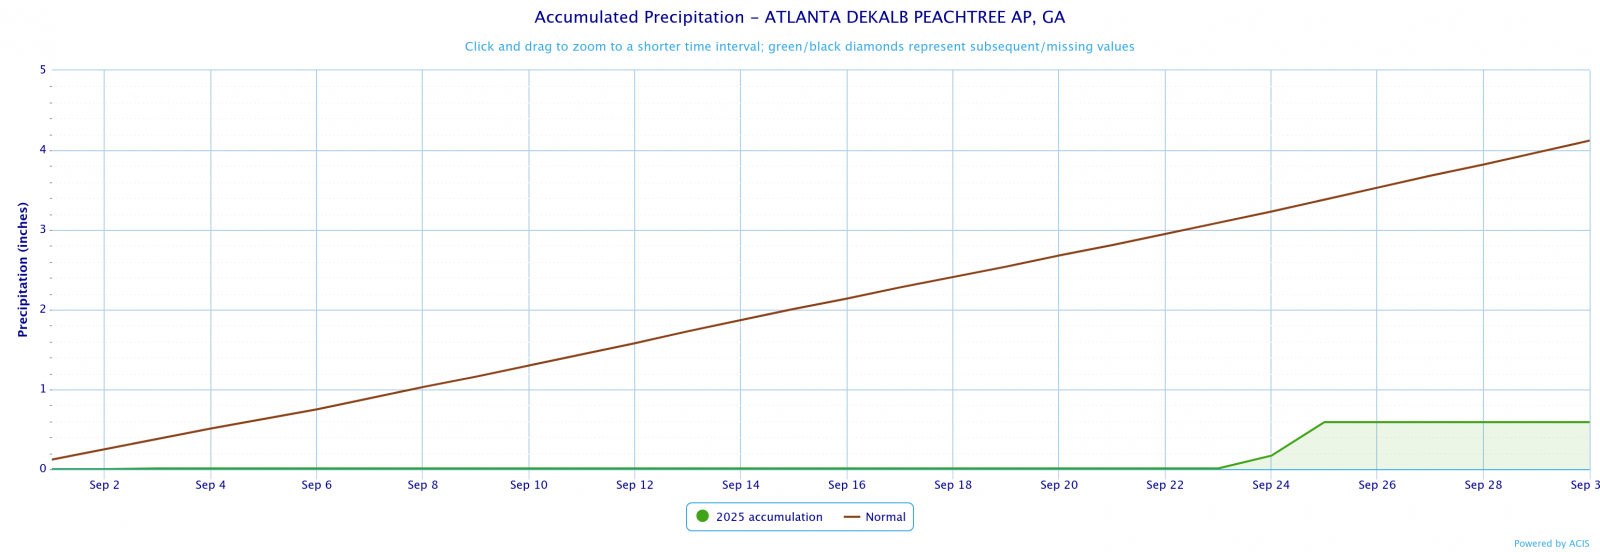
Dekalb Peachtree Arpt
0.59
4.12
-3.53
Fulton County Arpt
1.00
3.36
-2.36
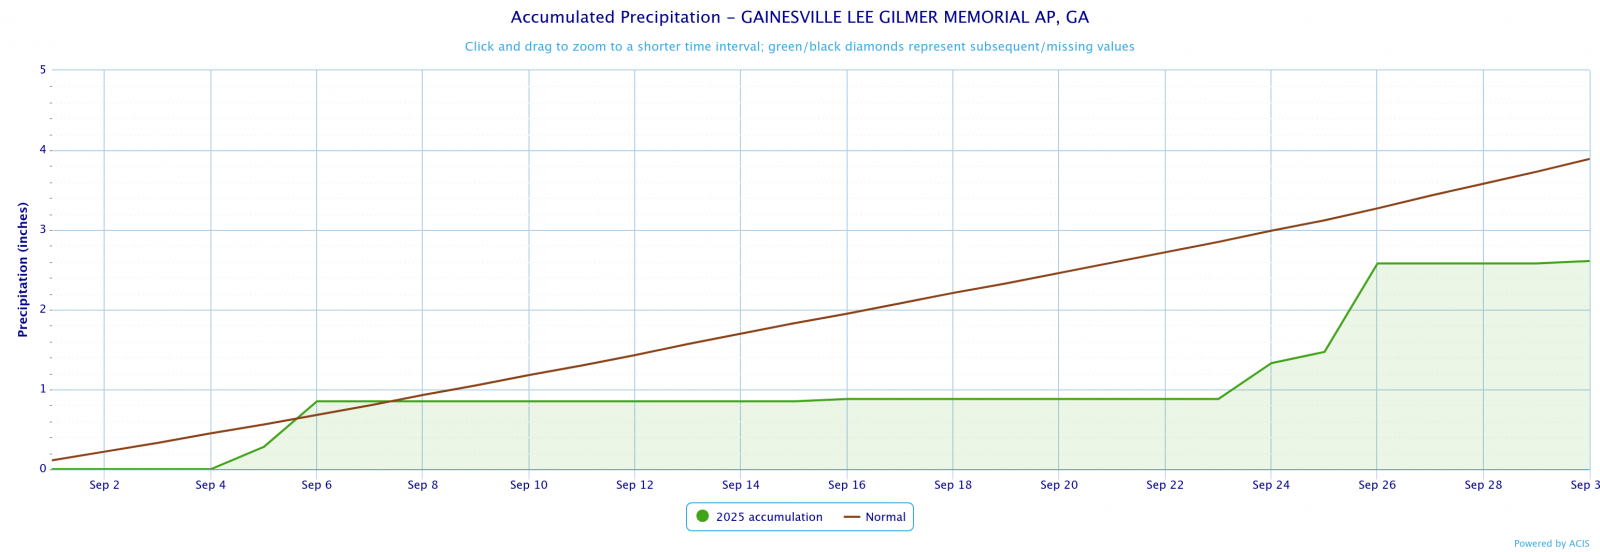
Gainesville
2.61
3.89
-1.28
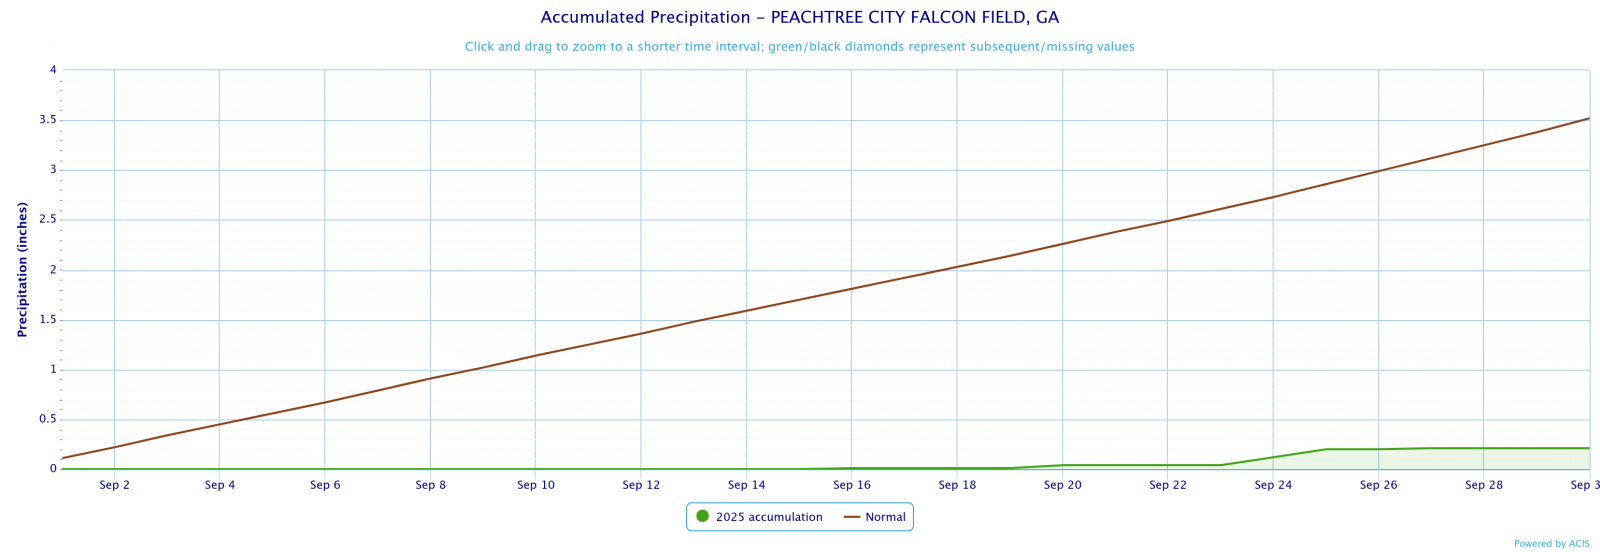
Peachtree City
0.21
3.52
-3.31
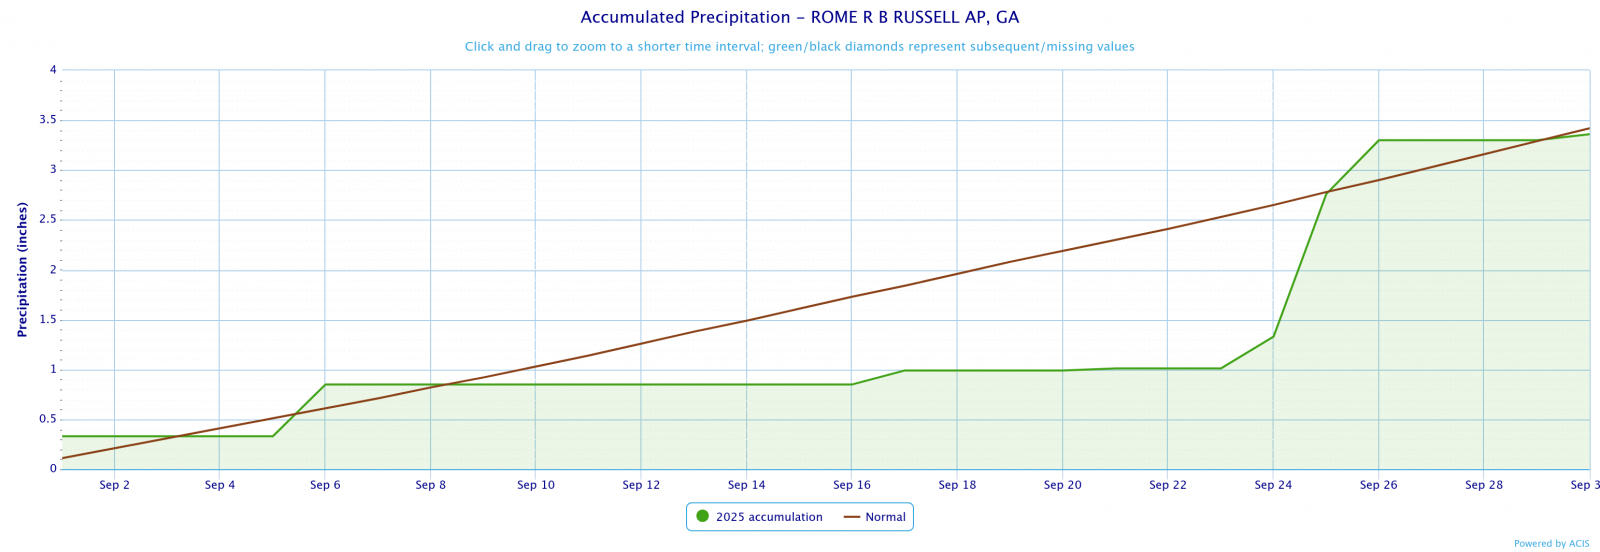
Rome
3.36
3.42
-0.06
Sep 2025 Precipitation Climate Statistics
Athens
2.37
9/4
Atlanta
0.11
9/24
Columbus
2.19
9/25
Macon
0.28
9/25
Dekalb Peachtree Arpt
0.58
9/24
Fulton Co Arpt
0.87
9/24
Gainesville
1.11
9/26
Peachtree City
0.16
9/24
Rome
1.89
9/25
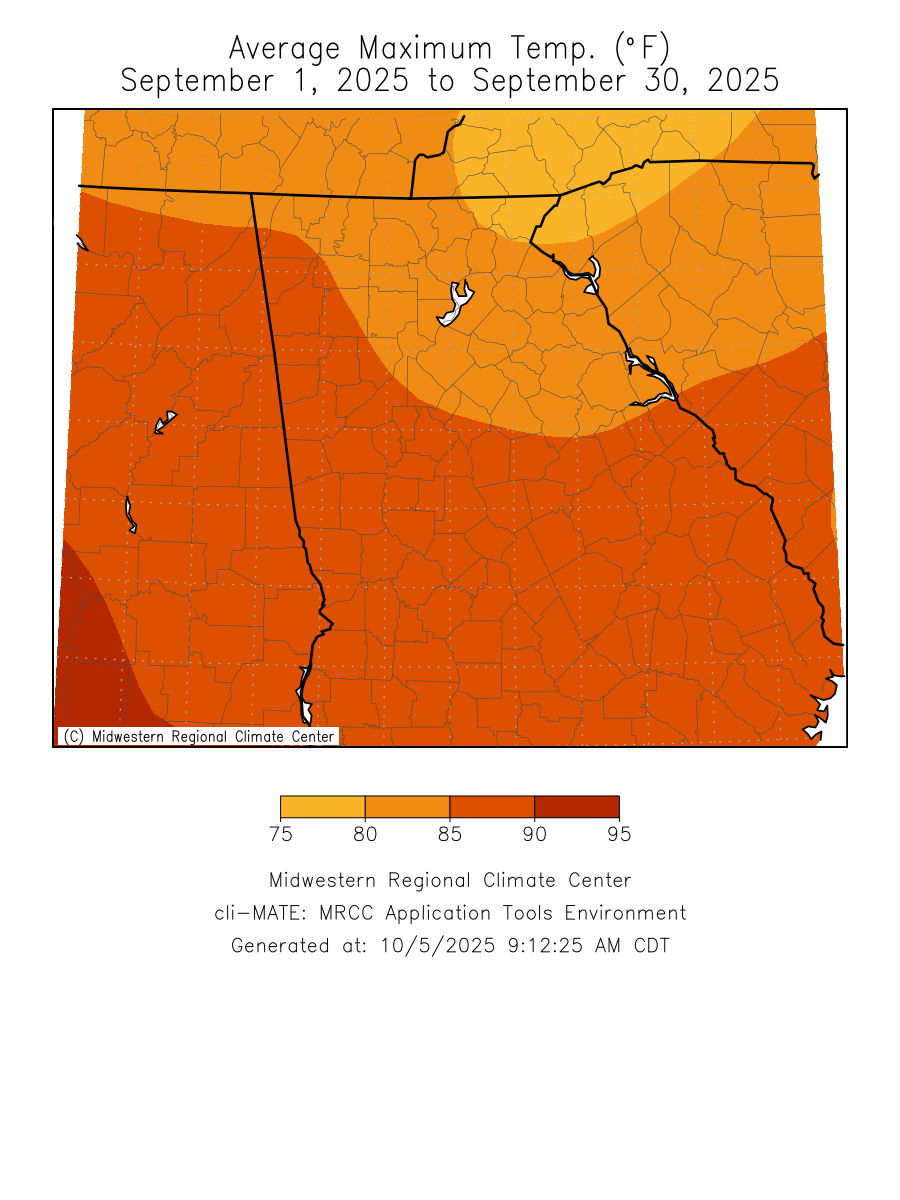
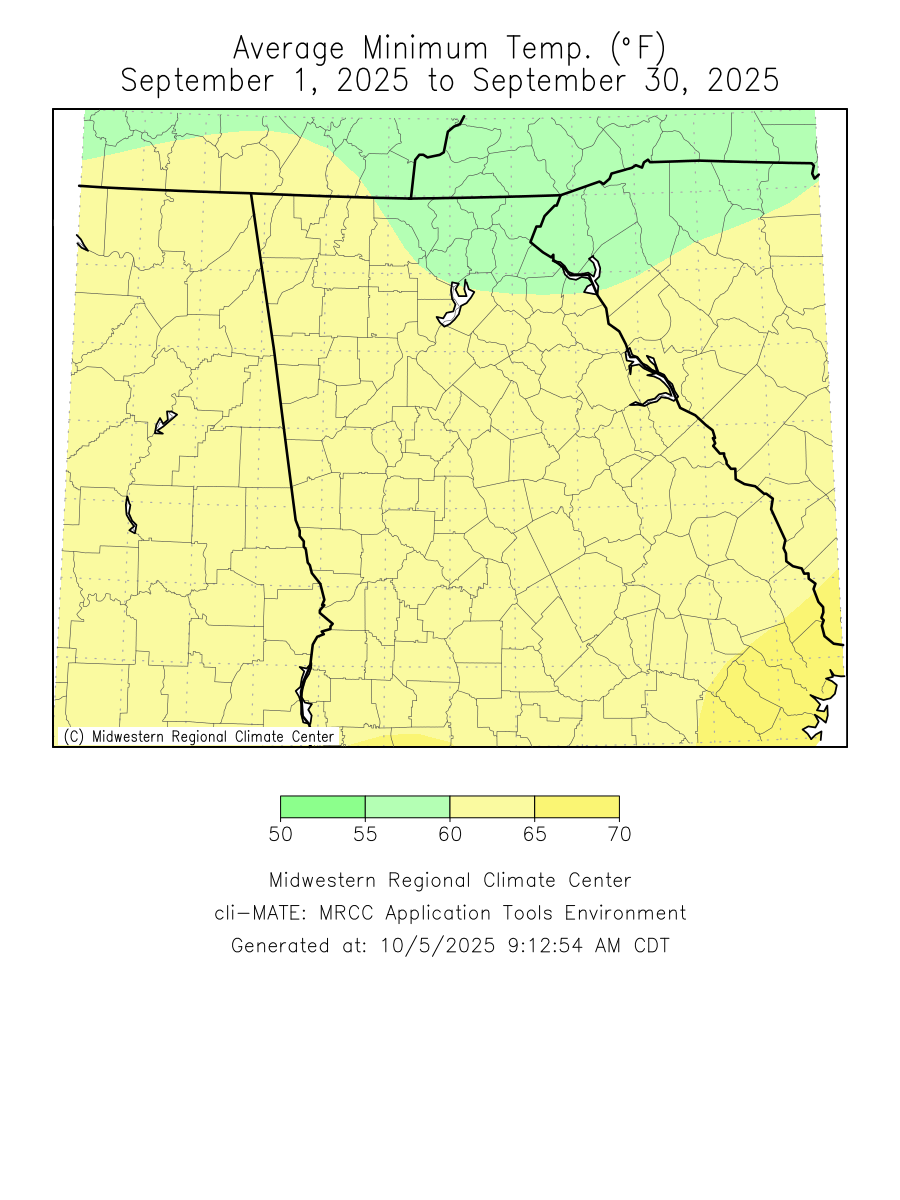
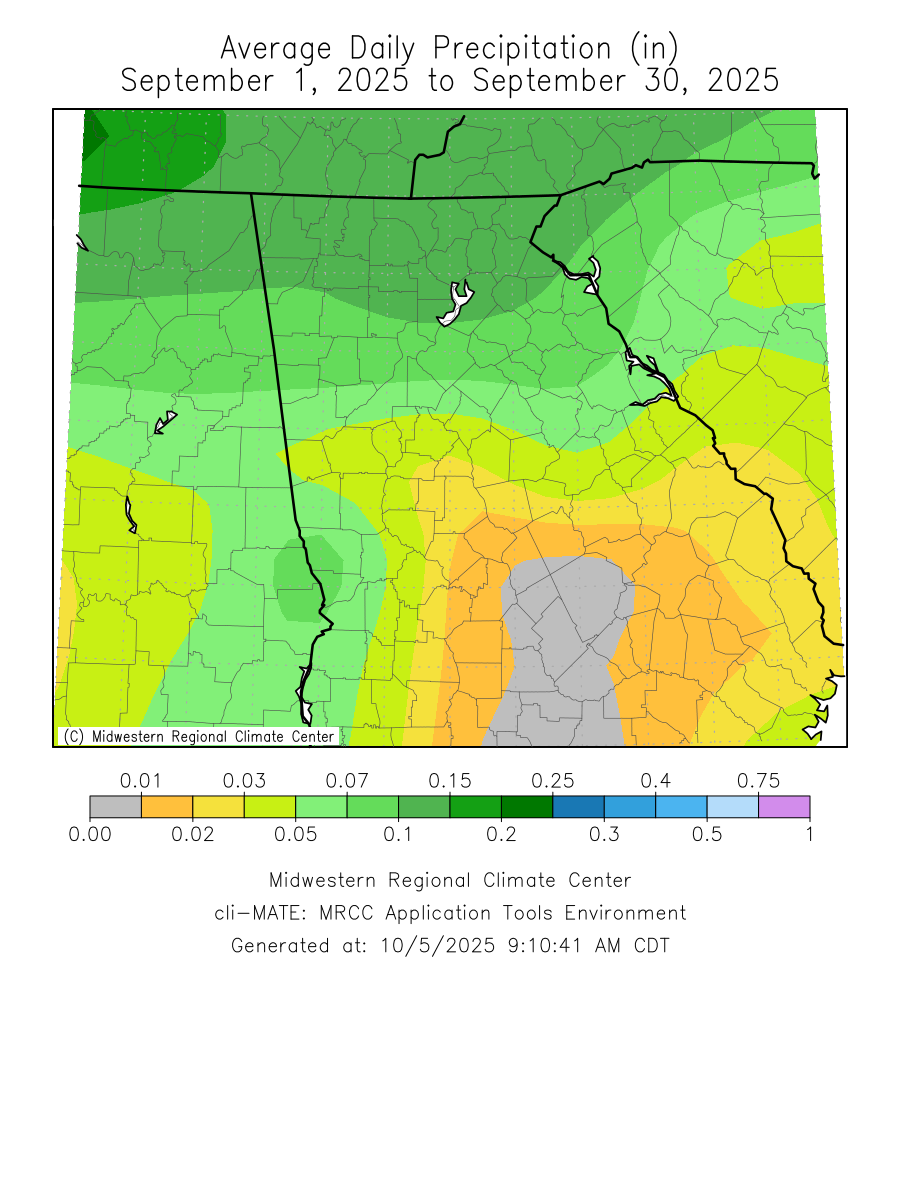
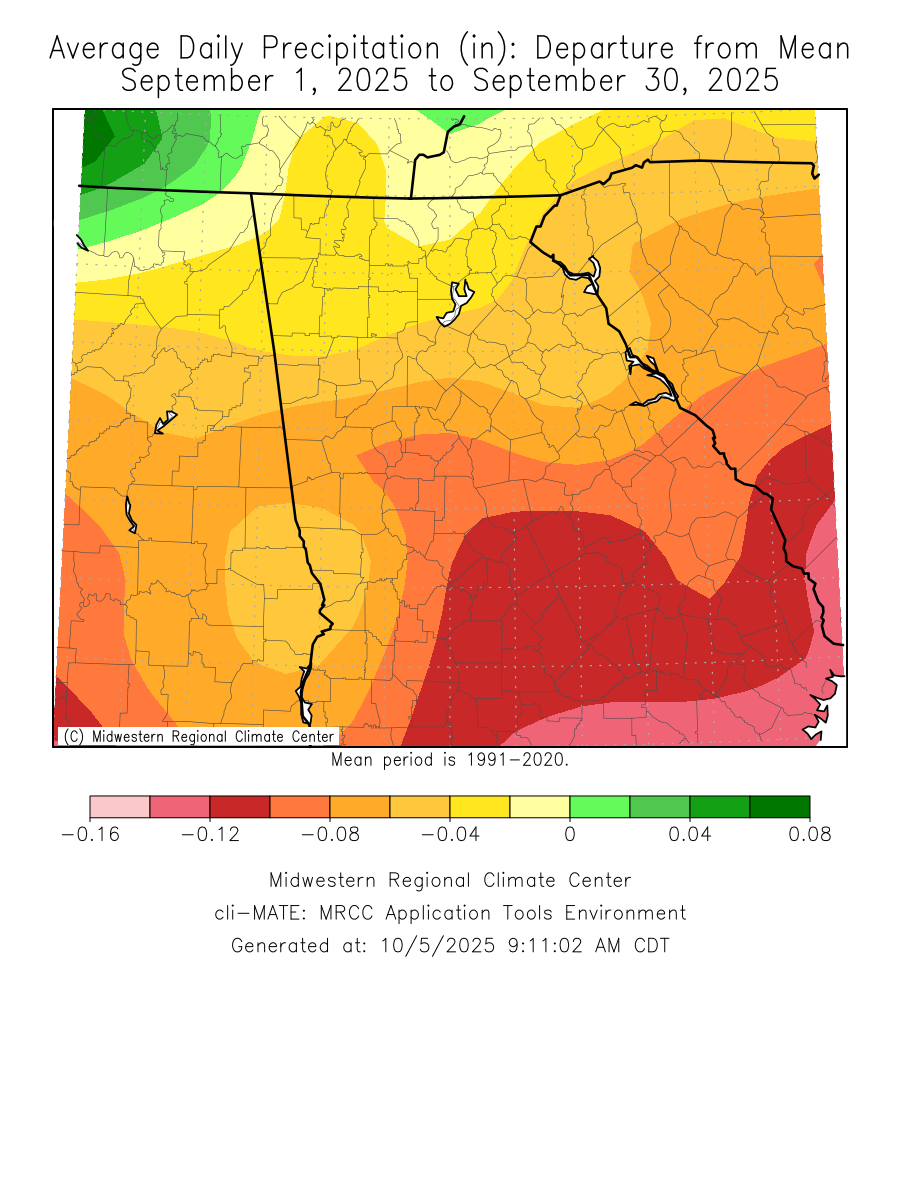
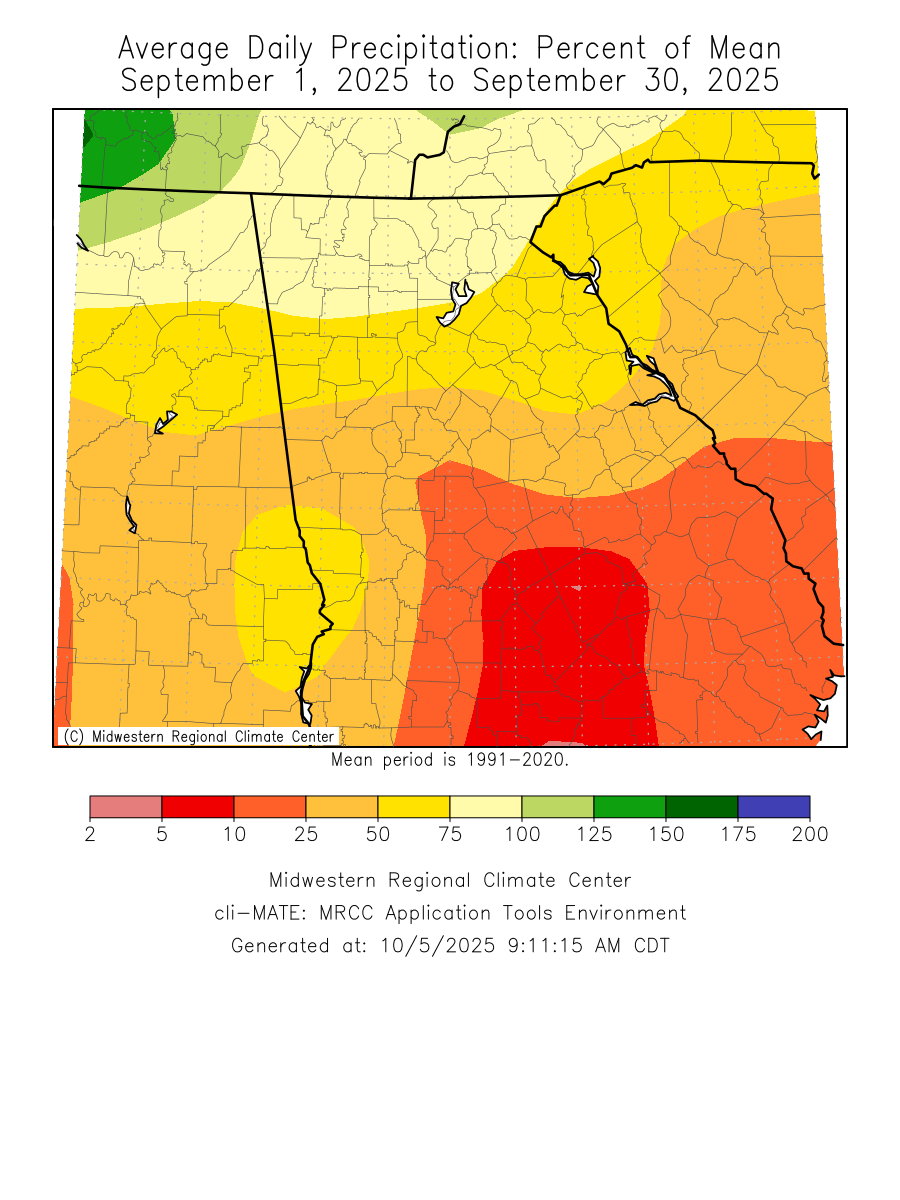
Click the links below to explore the temperature and precipitation data across north and central Georgia for the month of September 2025.
Temperature Maps
Precipitation Maps
Temperature Graphs
Precipitation Graphs


Temperature and precipitation records at our 4 main climate sites are located below.
September 2025 Climate Records
Date
Type
Location
Records set over a 24 hour period
8/9/9
MinTemp
Athens
A min temp of 54 occurred on 9/9 which breaks the old record of 55 from 1956.
No significant weather outbreaks occurred across north and central Georgia this past September.
The October climate outlook is below.
October Outlook