Summary of Tornado and Severe
Weather Event of January 30th, 2013
Event Summary
In the days leading up to this event, a strong ridge aloft developed, which along with surface winds from the south and southeast, led to near record warmth with temperatures on the 29th and 30th in the lower 70s to the north to near 80 for the southern tier of our forecast area. Meanwhile, a deep and sharp upper level trough transitioned from the Great Plains states to the mid Mississippi Valley late on the 29th and into the morning of the 30th. With it came much colder air for the Upper Plains with temperatures well below freezing and the freezing line itself making it as far south as Oklahoma. This clash of temperatures set the stage for a multi-state long-duration severe weather event that would produce widespread wind damage and several significant tornadoes across the local area. Here are some images of the setup for this event.
 |
 |
| Surface analysis shown on the morning of the 30th showing Low pressure developing along the front over Southern Mississippi. Note the warm air ahead of the front with temperatures in the 60s in Georgia at 7am | This is the satellite imagery for the same timeframe indicating the wide scope of influence this storm system would have with storms from the Gulf Coast through Canada and snow over the Northern Plains. |
Forecasting the Event
By most measures, this was a well forecast event by the computer models and well advertised with mention of the potential for severe storms up to a week in advance while the North Georgia ice storm was ongoing.
 |
 |
| Graphicast showing initial advertisement of severe potential 4 days out. | Graphicast the day of the event detailing the timing of the line as it progressed through the area. |
Like most significant events, this one was not without its set of unique challenges and this one included determining how soon line of thunderstorms emanating from the Mississippi Valley would decrease in intensity. Computer models were adamant about weakening the line as it progressed east but the question was would this result in less severe weather locally? Let's look at some images from the event.
 |
 |
| SREF computer model showing high severe thunderstorm probability over Mississippi. | SREF computer model showing much less probabilities as the line shifts east into Georgia. |
So how did the forecasts turn out? Well in actuality the models were right on target in depicting the decreasing intensity to the storms as they moved through the area. Look at these images showing the lightning in pink as the line moves through Mississippi.
Contrast this to the same map as the storms moved through Georgia and you can see the lightning did in fact decrease significantly around mid morning.
So where did all the severe weather come from if there was a weakening line of storms? Well for this event, there was one parameter that stood out as being extremely unusual in terms of strength. We call this an anomaly and the anomaly for low level winds created reason for concern early on. The 925mb winds were forecast to be between 55 and 65 mph for this event which means we were expecting very strong winds within a few thousand feet off the ground. Being so close to the ground, these winds would be able to reach the surface and were largely independent of the individual storm strength, meaning severe winds would be possible regardless of the storm intensity. In addition, despite the weakening trend, we still had healthy storms as the line moved into Western Georgia with sufficient lift to take advantage low level wind shear an produce the unfortunate Adairsville tornado.
Bartow and Gordon County Storm Summary and Survey Results
Three survey crews have been dispatched to investigate damage and we will pass along the latest information as it becomes available.
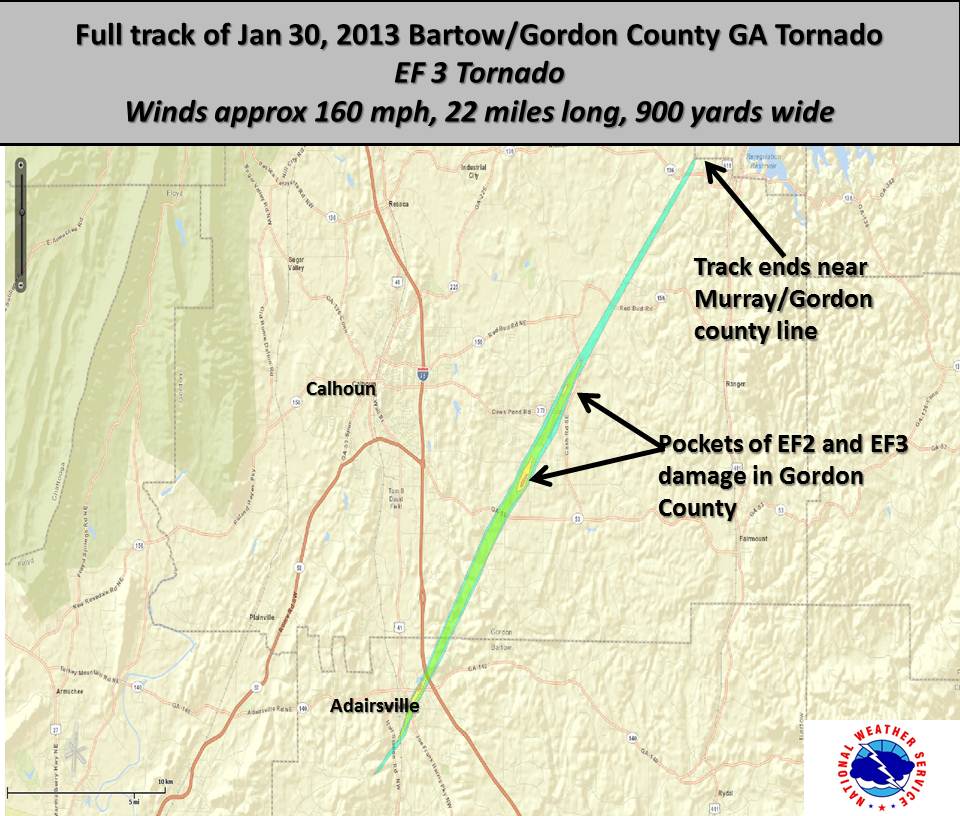
Graphic above shows the entire track from southwest of Adairsville northeastward through Gordon county to the Gordon/Murray County line.

Graphic above shows the starting point of the tornado which moved through Adairsville and how quickly it intensified as it moved into town.
A TEAM OF METEOROLOGISTS FROM THE NATIONAL WEATHER SERVICE IN
PEACHTREE CITY GEORGIA SURVEYED THE DAMAGE CAUSED BY A SUPERCELL
THUNDERSTORM THAT TRACKED ACROSS NORTHWEST BARTOW AND CENTRAL GORDON
COUNTIES FROM APPROXIMATELY 1115 AM TO 1155 AM ON WEDNESDAY...
JANUARY 30 2013. RESULTS FROM THE SURVEY INCLUDE THE FOLLOWING.
.ADAIRSVILLE TORNADO...
RATING: HIGH END EF-3
ESTIMATED PEAK WIND: 160 MPH
PATH LENGTH /STATUTE/: 21.8 MILES
PATH WIDTH /MAXIMUM/: 900 YARDS
FATALITIES: 1
INJURIES: 17 /9 IN BARTOW...8 IN GORDON/
START DATE: JAN 30 2013
START TIME: 1112 AM EST
START LOCATION: 2.4 MI SW ADAIRSVILLE/BARTOW COUNTY START
LAT/LON: 34.3411N/-84.9527W
END DATE: JAN 30 2013
END TIME: 1143 AM EST
END LOCATION: 14.3 MI NE CALHOUN OR NEAR OAKMAN/GORDON COUNTY
END LAT/LON: 34.5981N/-84.7313W
IN BARTOW COUNTY...AT LEAST 95 STRUCTURES WERE DAMAGED...WITH 31
DESTROYED... 17 SUSTAINING MAJOR DAMAGE...AND 47 WITH MINOR DAMAGE.
MOST OF THE DAMAGE WAS A RESULT OF TREES FALLING ON HOMES IN
DOWNTOWN ADAIRSVILLE. IN GORDON COUNTY...268 HOMES STRUCTURES WERE
IMPACTED. OF THESE...30 WERE COMPLETELY DESTROYED...110 HAD MAJOR
DAMAGE... AND ANOTHER 70 HAD MINOR DAMAGE. 202 OF THESE WERE SINGLE
FAMILY HOMES AND 66 WERE MOBILE HOMES.
EF SCALE: THE ENHANCED FUJITA SCALE CLASSIFIES TORNADOES INTO
THE FOLLOWING CATEGORIES.
EF0...WEAK......65 TO 85 MPH
EF1...WEAK......86 TO 110 MPH
EF2...STRONG....111 TO 135 MPH
EF3...STRONG....136 TO 165 MPH
EF4...VIOLENT...166 TO 200MPH
EF5...VIOLENT...>200MPH
Photos


Daiki Corporation facility destroyed by EF-3 tornado. Winds at this point were estimated at 160 mph.


This car near the Relax Inn in downtown Adairsville was rolled several times, then impaled by two large wooden beams.

Damage to homes east of Calhoun, GA. Ironically, two homes near Boone Ford Rd and Beason Rd, immediately adjacent to this neighborhood, were completely destroyed by an EF-3 tornado on December 22, 2011.
Gilmer and Fannin County Storm Summary and Survey Results

Graphic above shows the tornado path and intensity of the Gilmer and Fannin tornado.
RATING: EF-1
ESTIMATED PEAK WIND: 90 MPH
PATH LENGTH /STATUTE/: 11.9 MILES
PATH WIDTH /MAXIMUM/: 900 YARDS
INJURIES: 1 IN FANNIN
START DATE: JAN 30 2013
START TIME: 1205 PM EST
START LOCATION: 3.3 MILES NW CHERRY LOG
LAT/LON: 34.8171N/-84.4279W
END DATE: JAN 30 2013
END TIME: 1215 PM EST
END LOCATION: 2.3 MI NNW MINERAL BLUFF
END LAT/LON: 34.9452N/-84.2912W
IN GILMER COUNTY...THE TORNADO TOUCHED DOWN NEAR CHAPMAN DRIVE. HUNDREDS OF SOFTWOOD AND HARDWOOD TREES WERE EITHER SNAPPED OR UPROOTED. IN FANNIN COUNTY...30 STRUCTURES WERE DAMAGED MAINLY DUE TO FALLING TREES. HUNDREDS OF SOFTWOOD AND HARDWOOD TREES WERE EITHER SNAPPED OR UPROOTED. AROUND 100 POWER POLES WERE SNAPPED OR DAMAGED BY FALLING TREES.
Photos

Piney Rd at Humphry Mil

Ridge Top at Ada street

Bearden Road at Sugar Creek

Bearden Road at Sugar Creek

