|
August 2011 Review - Waco
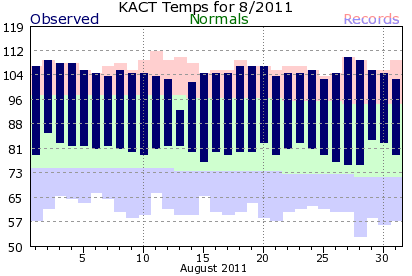 
August 2011 was the warmest month on record at Waco, besting the record set last month, July 2011.
Waco - August Temperatures
| Highest Maximum |
| Rank |
Temperature |
Year |
| 1 |
105.2 |
2011 |
| 2 |
101.7 |
1951 |
3
(tie) |
101.4 |
2010 |
| 101.4 |
1999 |
| 101.4 |
1988 |
| 6 |
101.1 |
2006 |
| 7 |
100.7 |
1952 |
| 8 |
100.6 |
1910 |
| 9 |
100.5 |
1985 |
| 10 |
100.2 |
2000 |
|
| Highest Average |
| Rank |
Temperature |
Year |
| 1 |
92.9 |
2011 |
| 2 |
89.9 |
1951 |
3
(tie) |
89.3 |
1924 |
| 89.3 |
1910 |
| 5 |
89.2 |
2010 |
| 6 |
88.9 |
1934 |
7
(tie) |
88.8 |
2006 |
| 88.8 |
1999 |
| 88.8 |
1952 |
10
(tie) |
88.2 |
1988 |
| 88.2 |
1982 |
| 88.2 |
1918 |
|
| Highest Minimum |
| Rank |
Temperature |
Year |
| 1 |
80.5 |
2011 |
| 2 |
79.7 |
1924 |
| 3 |
79.4 |
1934 |
| 4 |
78.1 |
1923 |
5
(tie) |
78.0 |
1951 |
| 78.0 |
1918 |
| 78.0 |
1910 |
| 8 |
77.3 |
1925 |
9
(tie) |
77.2 |
1932 |
| 77.2 |
1930 |
| 77.2 |
1922 |
|
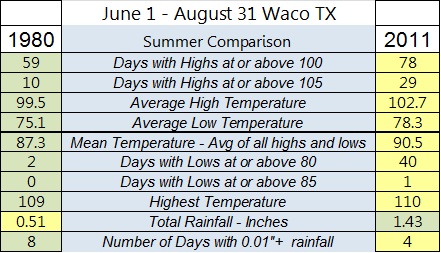
This was the warmest summer on record for Waco. The average minimum temperature was the warmest since the official observing site was moved from the city to the airport in 1940.
Waco - Summer Temperatures
| Highest Maximum |
| Rank |
Temperature |
Year |
| 1 |
102.7 |
2011 |
| 2 |
99.5 |
1980 |
| 3 |
99.4 |
1998 |
4
(tie) |
98.7 |
2009 |
| 98.7 |
1934 |
| 6 |
98.6 |
1925 |
7
(tie) |
98.5 |
1990 |
| 98.5 |
1969 |
| 98.5 |
1918 |
| 10 |
98.4 |
1977 |
|
| Highest Average |
| Rank |
Temperature |
Year |
| 1 |
90.5 |
2011 |
| 2 |
88.7 |
1925 |
| 3 |
88.6 |
1934 |
| 4 |
87.7 |
1918 |
| 5 |
87.6 |
1998 |
| 6 |
87.3 |
1980 |
7
(tie) |
87.2 |
1977 |
| 87.2 |
1969 |
9
(tie) |
87.0 |
2010 |
| 87.0 |
2009 |
| 87.0 |
1909 |
|
| Highest Minimum |
| Rank |
Temperature |
Year |
| 1 |
78.8 |
1925 |
| 2 |
78.4 |
1934 |
| 3 |
78.3 |
2011 |
4
(tie) |
77.0 |
1924 |
| 77.0 |
1923 |
| 6 |
76.9 |
1918 |
| 7 |
76.8 |
1914 |
| 8 |
76.6 |
2010 |
| 9 |
76.3 |
1932 |
| 10 |
76.1 |
1922 |
|
The 100° day total shattered the record from 1980. The streak of 44 days just topped 1980.
Waco - Greatest Annual and Consecutive 100° Days
|
| Greatest Annual |
| Rank |
# of Days |
Year |
| 1 |
79 |
2011* |
| 2 |
63 |
1980 |
| 3 |
61 |
1998 |
| 4 |
58 |
1969 |
| 5 |
55 |
2009 |
6
(tie) |
52 |
1990 |
| 52 |
1977 |
| 8 |
50 |
1925 |
9
(tie) |
46 |
2006 |
| 46 |
1978 |
* through August 31
|
| Greatest Consecutive |
| Rank |
# of Days |
Dates |
| 1 |
44 |
Jun 30 - Aug 12, 2011 |
| 2 |
42 |
Jun 23 - Aug 3, 1980 |
| 3 |
30 |
Jun 27 - Jul 26, 1969 |
| 4 |
29 |
Jul 6 - Aug 3, 1998 |
| 5 |
26 |
Jul 29 - Aug 23, 1987 |
| 6 |
25 |
Jul 31 - Aug 24, 2010 |
| 7 |
24 |
Jul 22 - Aug 14, 1910 |
| 8 |
23 |
Aug 3-25, 1952 |
9
(tie) |
20 |
Aug 8-27, 2006 |
| 20 |
Jul 2-21, 1978 |
|
Between June 30 and August 31, there was only one day during which the temperature failed to reach 100°.
Waco - Greatest 100° Days by Month
| June |
| Rank |
# of Days |
Year |
1
(tie) |
17 |
2011 |
| 17 |
1998 |
| 3 |
15 |
1925 |
4
(tie) |
14 |
2009 |
| 14 |
1902 |
6
(tie) |
13 |
1990 |
| 13 |
1918 |
| 13 |
1911 |
| 9 |
10 |
1980 |
10
(tie) |
9 |
1969 |
| 9 |
1905 |
|
| July |
| Rank |
# of Days |
Year |
1
(tie) |
31 |
2011 |
| 31 |
1980 |
| 3 |
29 |
1969 |
| 4 |
28 |
1998 |
| 5 |
24 |
1978 |
6
(tie) |
23 |
1925 |
| 23 |
1909 |
| 8 |
21 |
1954 |
| 9 |
20 |
2001 |
10
(tie) |
19 |
2009 |
| 19 |
1977 |
| 19 |
1912 |
|
| August |
| Rank |
# of Days |
Year |
| 1 |
30 |
2011 |
2
(tie) |
27 |
2010 |
| 27 |
2006 |
| 4 |
26 |
1951 |
5
(tie) |
25 |
1999 |
| 25 |
1988 |
| 25 |
1987 |
| 8 |
24 |
1952 |
9
(tie) |
22 |
1985 |
| 22 |
1982 |
| 22 |
1910 |
|
There were 24 days with record highs during the summer of 2011, 14 of which occurred in August. Excluding 2011, the summer with the most current record highs is 1969 with 9 days.
Waco - Annual and Consecutive Days of 105° or More
|
| Greatest Annual |
| Rank |
# of Days |
Year |
| 1 |
29 |
2011* |
| 2 |
12 |
1998 |
| 3 |
11 |
1969 |
| 4 |
10 |
1980 |
| 5 |
9 |
1951 |
* through August 31
|
| Greatest Consecutive |
| Rank |
# of Days |
Dates |
1
(tie) |
6 |
Aug 15-20, 2011 |
| 6 |
Aug 1-6, 2011 |
| 6 |
Aug 31 - Sep 5, 2000 |
| 6 |
Aug 9-14, 1969 |
3
(tie) |
5 |
Aug 26-30, 2011 |
| 5 |
Jul 30 - Aug 3, 1998 |
| 5 |
Jul 28 - Aug 1, 1986 |
|
The number of days with lows of 80° or more was the most at Waco since the observing site moved from the city to the airport in 1940.
Waco - Annual and Consecutive Days with Lows of 80° or More
|
| Greatest Annual |
| Rank |
# of Days |
Year |
| 1 |
50 |
1925 |
| 2 |
43 |
1934 |
| 3 |
40 |
2011* |
| 4 |
38 |
1924 |
| 5 |
27 |
1918 |
* through August 31
|
| Greatest Consecutive |
| Rank |
# of Days |
Dates |
1
(tie) |
15 |
Aug 12-26, 1934 |
| 15 |
Jul 16-30, 1925 |
| 3 |
14 |
Jul 28 - Aug 10, 1924 |
4
(tie) |
10 |
Jun 28 - Jul 7, 1933 |
| 10 |
Aug 15-24, 1924 |
| 10 |
Jul 12-21, 1924 |
|
August 2 set two all-time records, the highest minimum temperature (86°) and the highest mean temperature (97.5°). There were 7 days with low temperatures of 83° of higher. There had been no such days since 1967.
Waco - Daily Temperatures
| Highest Maximum |
| Rank |
Temperature |
Date |
| 1 |
112 |
Aug 11, 1969 |
2
(tie) |
111 |
Sep 4, 2000 |
| 111 |
Aug 11, 1936 |
4
(tie) |
110 |
Aug 27, 2011 |
| 110 |
Aug 13, 1969 |
6
(tie) |
109 |
Aug 28, 2011 |
| 109 |
Aug 2, 2011 |
| 109 |
July 12, 1998 |
| 109 |
Aug 31, 1990 |
| 109 |
Jun 27, 1980 |
| 109 |
Aug 12, 1969 |
| 109 |
Aug 10, 1969 |
| 109 |
Aug 18, 1909 |
|
| Highest Average |
| Rank |
Temperature |
Date |
| 1 |
97.5 |
Aug 2, 2011 |
| 2 |
96.5 |
Aug 11, 1969 |
| 3 |
96.0 |
Aug 13, 1969 |
4
(tie) |
95.5 |
Aug 3, 2011 |
| 95.5 |
Jul 12, 1933 |
| 95.5 |
Jul 18, 1925 |
7
(tie) |
95.0 |
Aug 29, 2011 |
| 95.0 |
Aug 20, 2011 |
| 95.0 |
Aug 4, 2011 |
| 95.0 |
Aug 10, 1969 |
|
| Highest Minimum |
| Rank |
Temperature |
Date |
| 1 |
86 |
Aug 2, 2011 |
| 2 |
85 |
Jul 18, 1925 |
3
(tie) |
84 |
Aug 29, 2011 |
| 84 |
Jul 12, 1933 |
| 84 |
Aug 20, 1930 |
| 84 |
Jul 28, 1925 |
5
(tie) |
83 |
Aug 30, 2011 |
| 83 |
Aug 23, 2011 |
| 83 |
Aug 20, 2011 |
| 83 |
Aug 3, 2011 |
| 83 |
Jul 26, 2011 |
| 83 |
Jul 31, 1967 |
| 83 |
Jul 31, 1966 |
| 83 |
Jul 22, 1966 |
| 83 |
Aug 6, 1951 |
|
Precipitation deficits continue to mount across Waco after the 5th driest summer on record. There were only two days during July and August with measurable rainfall at Waco Regional Airport.
Waco - Precipitation
|
| August - Driest |
| Rank |
Precipitation |
Year |
| 1 |
0.00 |
1902 |
2
(tie) |
T |
1999 |
| T |
1952 |
| T |
1929 |
| T |
1924 |
| T |
1910 |
| 7 |
0.01 |
2009 |
| 8 |
0.03 |
1936 |
| 9 |
0.05 |
2000 |
| 10 |
0.06 |
2006 |
| 11 |
0.08 |
2011 |
|
|
Summer - Driest
|
| Rank |
Precipitation |
Year |
| 1 |
0.51 |
1980 |
| 2 |
0.85 |
1956 |
| 3 |
0.93 |
1924 |
| 4 |
1.33 |
1954 |
| 5 |
1.43 |
2011 |
| 6 |
1.58 |
1965 |
7
(tie) |
1.87 |
1952 |
| 1.87 |
1918 |
| 9 |
1.96 |
1998 |
| 10 |
2.02 |
1917 |
|
| ASOS Precipitation |
| Location |
August |
Summer (June-August) |
October 2010 - August 2011 |
|
Precipitation
|
Departure
from Normal |
Precipitation |
Departure
from Normal |
Percent
of Normal |
Precipitation |
Departure
from Normal |
Percent
of Normal
|
| Waco |
0.08 |
-1.97 |
1.43 |
-5.84 |
20 |
13.92 |
-17.71 |
44 |
| DFW Airport |
0.96 |
-0.95 |
3.89 |
-3.97 |
49 |
21.60 |
-11.99 |
64 |
| Dallas Love Field |
0.93 |
-0.94 |
4.63 |
-3.56 |
57 |
22.86 |
-11.87 |
66 |
| Fort Worth Meacham |
0.92 |
-0.92 |
3.61 |
-5.78 |
38 |
16.86 |
-17.01 |
50 |
| Dallas Executive |
0.50 |
-3.07 |
2.67 |
-7.54 |
26 |
18.20 |
-19.49 |
48 |
| Fort Worth Alliance |
1.36 |
-1.15 |
3.36 |
-5.96 |
36 |
17.63 |
-16.85 |
51 |
| Arlington |
0.38 |
-1.59 |
1.30 |
-7.24 |
15 |
18.17 |
-16.37 |
53 |
| Denton |
1.75 |
-0.02 |
4.30 |
-4.35 |
50 |
20.81 |
-14.72 |
59 |
| McKinney |
0.32 |
-1.63 |
1.72 |
-6.47 |
21 |
20.00 |
-16.92 |
54 |
| Terrell |
0.25 |
-1.87 |
4.02 |
-4.90 |
45 |
25.57 |
-12.53 |
67 |
| Corsicana |
0.05 |
-2.06 |
4.53 |
-3.87 |
54 |
21.58 |
-15.96 |
57 |
| Mineral Wells |
2.00 |
-0.24 |
2.49 |
-5.90 |
30 |
11.20 |
-18.03 |
38 |
|


