|
August 2011 Review - DFW
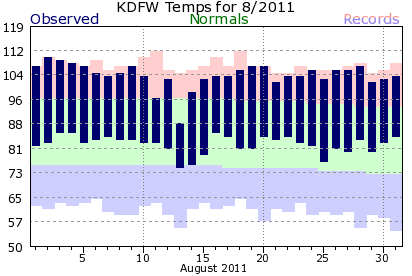 
August 2011 was the warmest month on record at Dallas/Fort Worth, besting July 1980 (92.0°) by 1.4°.
Dallas/Fort Worth - August Temperatures
| Highest Maximum |
| Rank |
Temperature |
Year |
| 1 |
104.3 |
2011 |
| 2 |
103.5 |
1952 |
| 3 |
102.9 |
1951 |
| 4 |
101.9 |
2000 |
| 5 |
101.7 |
1999 |
| 6 |
101.1 |
1943 |
| 7 |
100.7 |
2006 |
8
(tie) |
100.5 |
2010 |
| 100.5 |
1956 |
| 10 |
100.2 |
1954 |
|
| Highest Average |
| Rank |
Temperature |
Year |
| 1 |
93.4 |
2011 |
| 2 |
91.1 |
1952 |
| 3 |
90.3 |
1951 |
4
(tie) |
90.2 |
2000 |
| 90.2 |
1999 |
6
(tie) |
89.8 |
2010 |
| 89.8 |
2006 |
| 8 |
89.3 |
1943 |
| 9 |
88.8 |
1954 |
| 10 |
88.5 |
1980 |
|
| Highest Minimum |
| Rank |
Temperature |
Year |
| 1 |
82.5 |
2011 |
| 2 |
79.0 |
2010 |
| 3 |
78.8 |
2006 |
| 4 |
78.7 |
1952 |
| 5 |
78.6 |
1999 |
| 6 |
78.5 |
2000 |
| 7 |
78.1 |
1934 |
| 8 |
78.0 |
2007 |
| 9 |
77.6 |
1951 |
| 10 |
77.5 |
1943 |
|
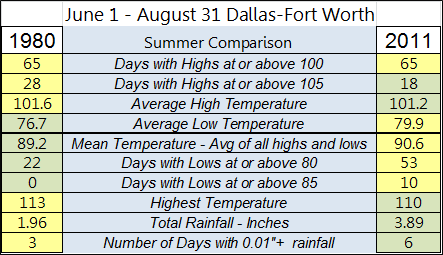
The summer of 2011 also topped 1980 although the average high from the summer of 1980 will remain the all-time record.
Dallas/Fort Worth - Summer Temperatures
| Highest Maximum |
| Rank |
Temperature |
Year |
| 1 |
101.6 |
1980 |
| 2 |
101.2 |
2011 |
3
(tie) |
99.1 |
1954 |
| 99.1 |
1952 |
| 5 |
98.8 |
1998 |
| 6 |
98.4 |
1956 |
| 7 |
98.1 |
2006 |
| 8 |
98.0 |
1934 |
| 9 |
97.7 |
2008 |
| 10 |
97.4 |
1977 |
|
| Highest Average |
| Rank |
Temperature |
Year |
| 1 |
90.6 |
2011 |
| 2 |
89.2 |
1980 |
| 3 |
88.3 |
1998 |
| 4 |
87.7 |
1954 |
| 5 |
87.6 |
1952 |
| 6 |
87.5 |
2010 |
7
(tie) |
87.4 |
2008 |
| 87.4 |
1934 |
| 9 |
87.1 |
2006 |
| 10 |
86.8 |
1956 |
|
| Highest Minimum |
| Rank |
Temperature |
Year |
| 1 |
79.9 |
2011 |
| 2 |
77.8 |
1998 |
| 3 |
77.6 |
2010 |
| 4 |
77.1 |
2008 |
| 5 |
76.8 |
1934 |
| 6 |
76.7 |
1980 |
| 7 |
76.3 |
1954 |
| 8 |
76.2 |
1925 |
| 9 |
76.1 |
2006 |
10
(tie) |
76.0 |
1999 |
| 76.0 |
1952 |
|
The annual 100° day total still trails the record, but 1980 also recorded its 65th triple-digit high on August 31. Only one year appears twice in the top 10 list of consecutive 100° days, 2011.
Dallas/Fort Worth - Greatest Annual and Consecutive 100° Days
|
| Greatest Annual |
| Rank |
# of Days |
Year |
| 1 |
69 |
1980 |
| 2 |
65 |
2011* |
| 3 |
56 |
1998 |
| 4 |
52 |
1954 |
| 5 |
48 |
1956 |
| 6 |
46 |
2000 |
| 7 |
44 |
1952 |
| 8 |
43 |
2006 |
| 9 |
40 |
1951 |
| 10 |
38 |
1963 |
* through August 31
|
| Greatest Consecutive |
| Rank |
# of Days |
Dates |
| 1 |
42 |
Jun 23 - Aug 3, 1980 |
| 2 |
40 |
Jul 2 - Aug 10, 2011 |
| 3 |
29 |
Jul 6 - Aug 3, 1998 |
| 4 |
25 |
Aug 2-26, 1952 |
| 5 |
24 |
Jul 28 - Aug 20, 1999 |
| 6 |
20 |
Jul 9-28, 1954 |
| 7 |
19 |
Aug 8-26, 2006 |
8
(tie) |
18 |
Jul 31 - Aug 17, 2010 |
| 18 |
Jul 2-19, 1978 |
10
(tie) |
17 |
Aug 15-31, 2011 * |
| 17 |
Aug 2-18, 1956 |
* still active at end of August
|
Between July 2 and August 31, there were only three days at DFW Airport during which the temperature failed to reach 100°.
Dallas/Fort Worth - Greatest 100° Days by Month
| June |
| Rank |
# of Days |
Year |
1
(tie) |
13 |
1980 |
| 13 |
1911 |
| 3 |
11 |
1953 |
4
(tie) |
8 |
1998 |
| 8 |
1918 |
6
(tie) |
7 |
2011 |
| 7 |
1934 |
8
(tie) |
6 |
1956 |
| 6 |
1948 |
10
(tie) |
5 |
2009 |
| 5 |
2008 |
| 5 |
1924 |
| 5 |
1902 |
|
| July |
| Rank |
# of Days |
Year |
| 1 |
31 |
1980 |
| 2 |
30 |
2011 |
| 3 |
28 |
1998 |
| 4 |
25 |
1954 |
| 5 |
23 |
1978 |
| 6 |
20 |
1956 |
| 7 |
19 |
1969 |
8
(tie) |
16 |
2008 |
| 16 |
1977 |
| 16 |
1964 |
| 16 |
1925 |
|
| August |
| Rank |
# of Days |
Year |
| 1 |
28 |
2011 |
2
(tie) |
27 |
2000 |
| 27 |
1952 |
| 4 |
26 |
1999 |
5
(tie) |
25 |
2006 |
| 25 |
1951 |
| 7 |
22 |
2010 |
8
(tie) |
21 |
1980 |
| 21 |
1956 |
| 21 |
1943 |
|
There were 11 days with record highs this summer. A total of 26 daily record highs remain from the summer of 1980.
Dallas/Fort Worth - Annual and Consecutive Days of 105° or More
|
| Greatest Annual |
| Rank |
# of Days |
Year |
| 1 |
28 |
1980 |
| 2 |
18 |
2011* |
| 3 |
17 |
1951 |
| 4 |
14 |
1952 |
| 5 |
12 |
1954 |
* through August 31
|
| Greatest Consecutive |
| Rank |
# of Days |
Dates |
| 1 |
11 |
Jul 8-18, 1980 |
| 2 |
10 |
Jun 24 - Jul 3, 1980 |
3
(tie) |
6 |
Aug 1-6, 2011 |
| 6 |
Aug 30 - Sep 4, 2000 |
| 6 |
Aug 14-19, 1952 |
| 6 |
Aug 13-18, 1951 |
|
There were 33 record daily high minimums June-August 2011. From 1980, only 7 remain. There are a dozen days June-August that have record high minimums from 1998.
Dallas/Fort Worth - Annual and Consecutive Days with Lows of 80° or More
|
| Greatest Annual |
| Rank |
# of Days |
Year |
| 1 |
53 |
2011* |
| 2 |
39 |
1998 |
| 3 |
27 |
2008 |
| 4 |
24 |
2010 |
| 5 |
23 |
2006 |
* through August 31
|
| Greatest Consecutive |
| Rank |
# of Days |
Dates |
| 1 |
14 |
Jul 19 - Aug 1, 1998 |
2
(tie) |
13 |
Jul 31 - Aug 12, 2011 |
| 13 |
Jul 7-19, 2011 |
| 4 |
11 |
Aug 12-22, 1952 |
5
(tie) |
9 |
Aug 16-24, 2011 |
| 9 |
Jul 21-29, 2011 |
| 9 |
Jul 6-14, 1998 |
| 9 |
Jul 19-27, 1954 |
|
The all-time record high of 113° was reached twice in 1980. But low temperatures of 86° had never occurred in the DFW climate record prior to 2011. There were 10 days with low temperatures of 85° of higher. Only once before had there been a low of 85°, the last summer that the official thermometer was in downtown Fort Worth (1939).
On August 3, the high temperature was 109° after a morning low of 86°. This became the highest mean temperature ever recorded for Dallas/Fort Worth, breaking the previous record from June 28, 1980.
Dallas/Fort Worth - Daily Temperatures
| Highest Maximum |
| Rank |
Temperature |
Date |
1
(tie) |
113 |
Jun 27, 1980 |
| 113 |
Jun 26, 1980 |
3
(tie) |
112 |
Jun 28, 1980 |
| 112 |
Aug 11, 1936 |
| 112 |
Aug 18, 1909 |
| 6 |
111 |
Sep 4, 2000 |
7
(tie) |
110 |
Aug 2, 2011 |
| 110 |
Jul 12, 1998 |
| 110 |
Jul 18, 1980 |
| 110 |
Jul 2, 1980 |
| 110 |
Aug 16, 1943 |
| 110 |
Aug 10, 1936 |
|
| Highest Average |
| Rank |
Temperature |
Date |
| 1 |
97.5 |
Aug 3, 2011 |
2
(tie) |
97.0 |
Aug 4, 2011 |
| 97.0 |
Jun 28, 1980 |
4
(tie) |
96.5 |
Aug 2, 2011 |
| 96.5 |
Sep 1, 2000 |
| 96.5 |
Jul 12, 1998 |
| 96.5 |
Jun 27, 1980 |
| 96.5 |
Aug 11, 1936 |
| 96.5 |
Aug 10, 1936 |
| 10 |
96.0 |
Aug 20, 2011 |
|
| Highest Minimum |
| Rank |
Temperature |
Date |
1
(tie) |
86 |
Aug 16, 2011 |
| 86 |
Aug 4, 2011 |
| 86 |
Aug 3, 2011 |
| 86 |
Jul 26, 2011 |
5
(tie) |
85 |
Aug 31, 2011 |
| 85 |
Aug 22, 2011 |
| 85 |
Aug 20, 2011 |
| 85 |
Aug 17, 2011 |
| 85 |
Aug 7, 2011 |
| 85 |
Jul 25, 2011 |
| 85 |
Sep 1, 1939 |
|
Precipitation deficits continue to mount across North Texas. Arlington recorded only 15% of its normal rainfall this summer. At Mineral Wells, only 38% of normal precipitation has fallen since October 1, 2010, a deficit of over 8 inches.
| ASOS Precipitation |
| Location |
August |
Summer (June-August) |
October 2010 - August 2011 |
|
Precipitation
|
Departure
from Normal |
Precipitation |
Departure
from Normal |
Percent
of Normal |
Precipitation |
Departure
from Normal |
Percent
of Normal
|
| DFW Airport |
0.96 |
-0.95 |
3.89 |
-3.97 |
49 |
21.60 |
-11.99 |
64 |
| Waco |
0.08 |
-1.97 |
1.43 |
-5.84 |
20 |
13.92 |
-17.71 |
44 |
| Dallas Love Field |
0.93 |
-0.94 |
4.63 |
-3.56 |
57 |
22.86 |
-11.87 |
66 |
| Fort Worth Meacham |
0.92 |
-0.92 |
3.61 |
-5.78 |
38 |
16.86 |
-17.01 |
50 |
| Dallas Executive |
0.50 |
-3.07 |
2.67 |
-7.54 |
26 |
18.20 |
-19.49 |
48 |
| Fort Worth Alliance |
1.36 |
-1.15 |
3.36 |
-5.96 |
36 |
17.63 |
-16.85 |
51 |
| Arlington |
0.38 |
-1.59 |
1.30 |
-7.24 |
15 |
18.17 |
-16.37 |
53 |
| Denton |
1.75 |
-0.02 |
4.30 |
-4.35 |
50 |
20.81 |
-14.72 |
59 |
| McKinney |
0.32 |
-1.63 |
1.72 |
-6.47 |
21 |
20.00 |
-16.92 |
54 |
| Terrell |
0.25 |
-1.87 |
4.02 |
-4.90 |
45 |
25.57 |
-12.53 |
67 |
| Corsicana |
0.05 |
-2.06 |
4.53 |
-3.87 |
54 |
21.58 |
-15.96 |
57 |
| Mineral Wells |
2.00 |
-0.24 |
2.49 |
-5.90 |
30 |
11.20 |
-18.03 |
38 |
|


