|
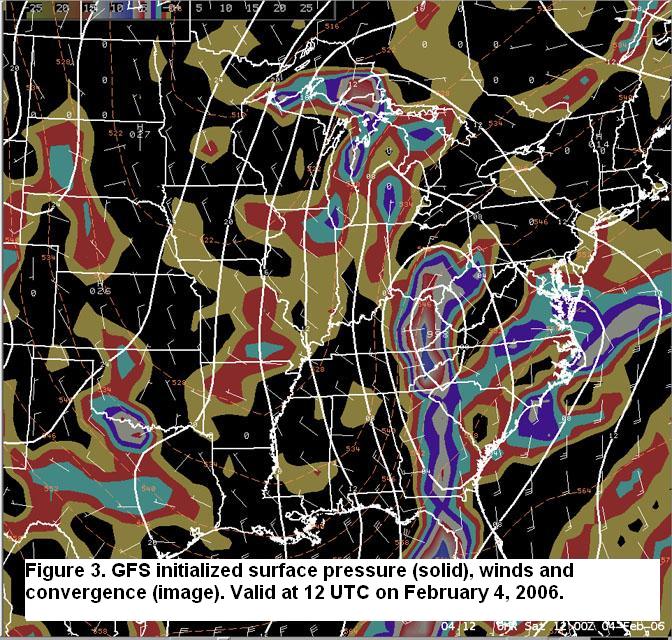
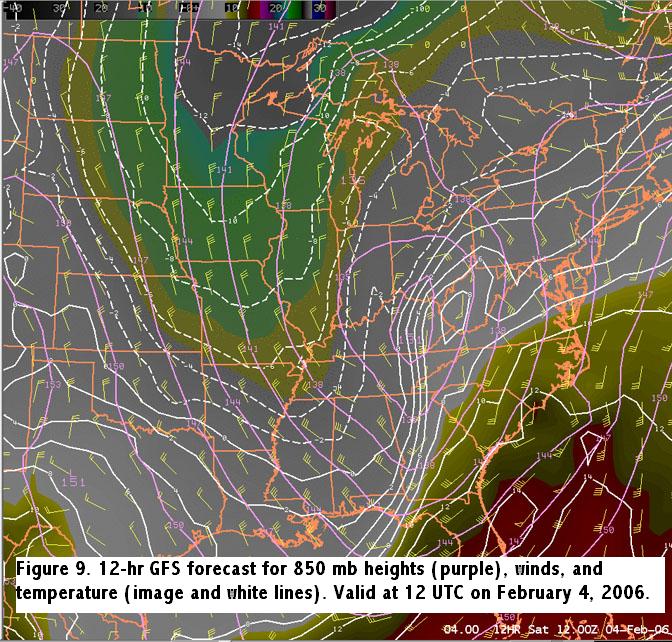
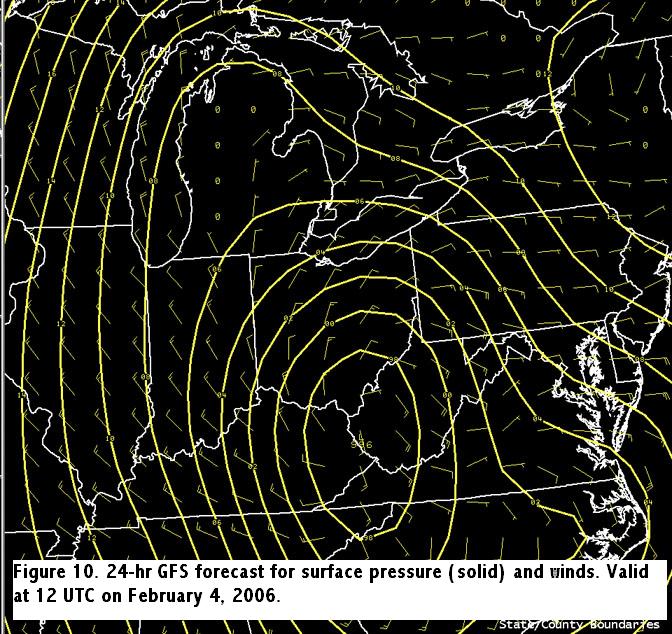
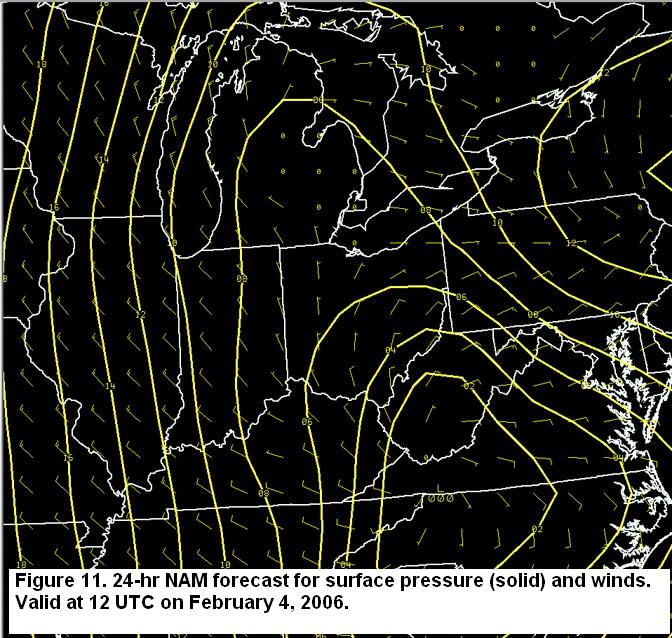
Winter Weather Event Review Section 3: Model Trends Section 1 -- Section 2 -- Section 3 -- Section 4 -- Section 5 -- Section 6 On February 3, 2006, the 12 UTC model solutions were showing consistent signs of trending west with the surface wave. The GFS 24 hour forecast valid at 12 UTC on the 4th, depicted the low over Southwest West Virginia (Fig. 10). The NAM solution for this time, showed the low position over Western Virginia (Fig. 11). The model trends continued to trend west with the 00 UTC February 4 model runs. The GFS showed superior run to run continuity over the NAM solution, with the NAM playing catch up. The analyzed surface low position at 12 UTC was over Eastern Kentucky as illustrated in Figure 3. By the 00 UTC model run both the NAM and GFS had a good handle on this position. This westward shift to the surface wave also translated to a west shift of the favorable thermal temperatures for snow. The favored -3 to -5 degree band at 850 mb which supports dendritic growth was observed over far Western Ohio and Eastern Indiana with the 12 UTC analysis (Fig. 9). Although the model solutions offered a definitive warmer and westward trend with the gross features, the Canadian precipitation type technique applied to the forecast soundings trended later and eventually trended too late with the change-over to snow. Also, pure model QPF in the cold air was a bit up and down but generally trended higher as the event got closer. This was particularly problematic to the forecaster with the boundary layer temperatures and precipitation type being crucial to whether or not a 4 inch snow accumulation would be observed.
|