
A significant heat wave is underway for the Intermountain West, Northern Plains, and Upper Great Lakes, peaking in intensity through midweek and lingering across parts of the Northern Plains and Midwest until this weekend. In southwest Texas, excessive rainfall may bring a risk for potentially life-threatening flash and arroyo flooding through Thursday. Read More >
2017 Yearly Climate Information
Yearly Climate Graphics
|
|
|
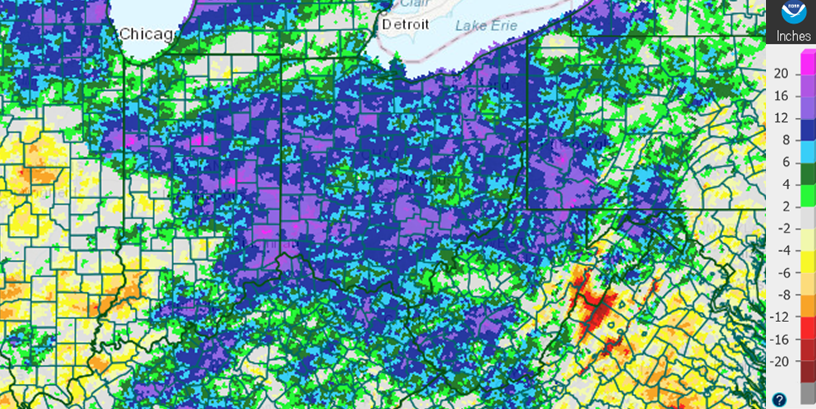
Yearly Observed Rainfall (Compared To Normal)
|
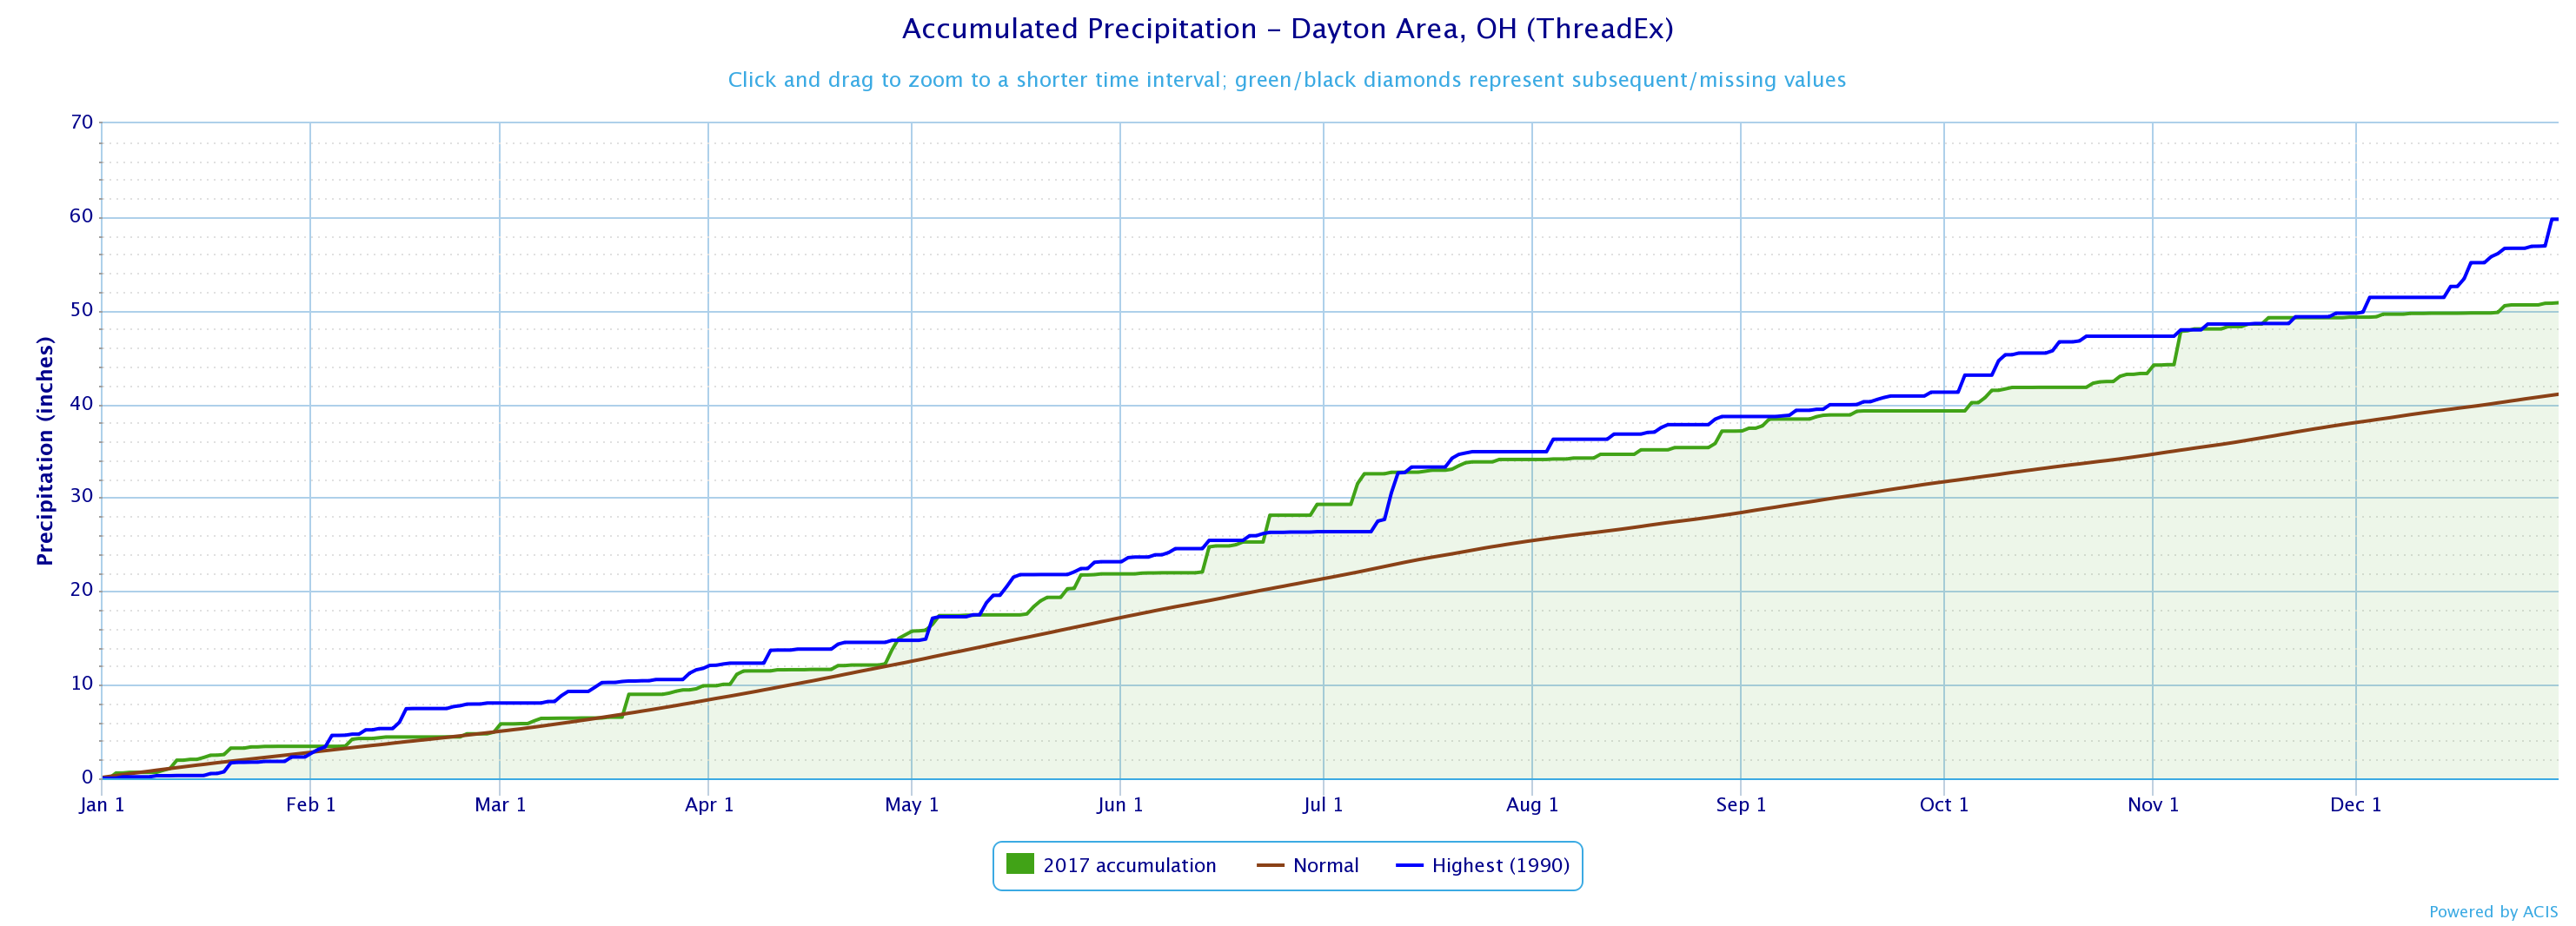
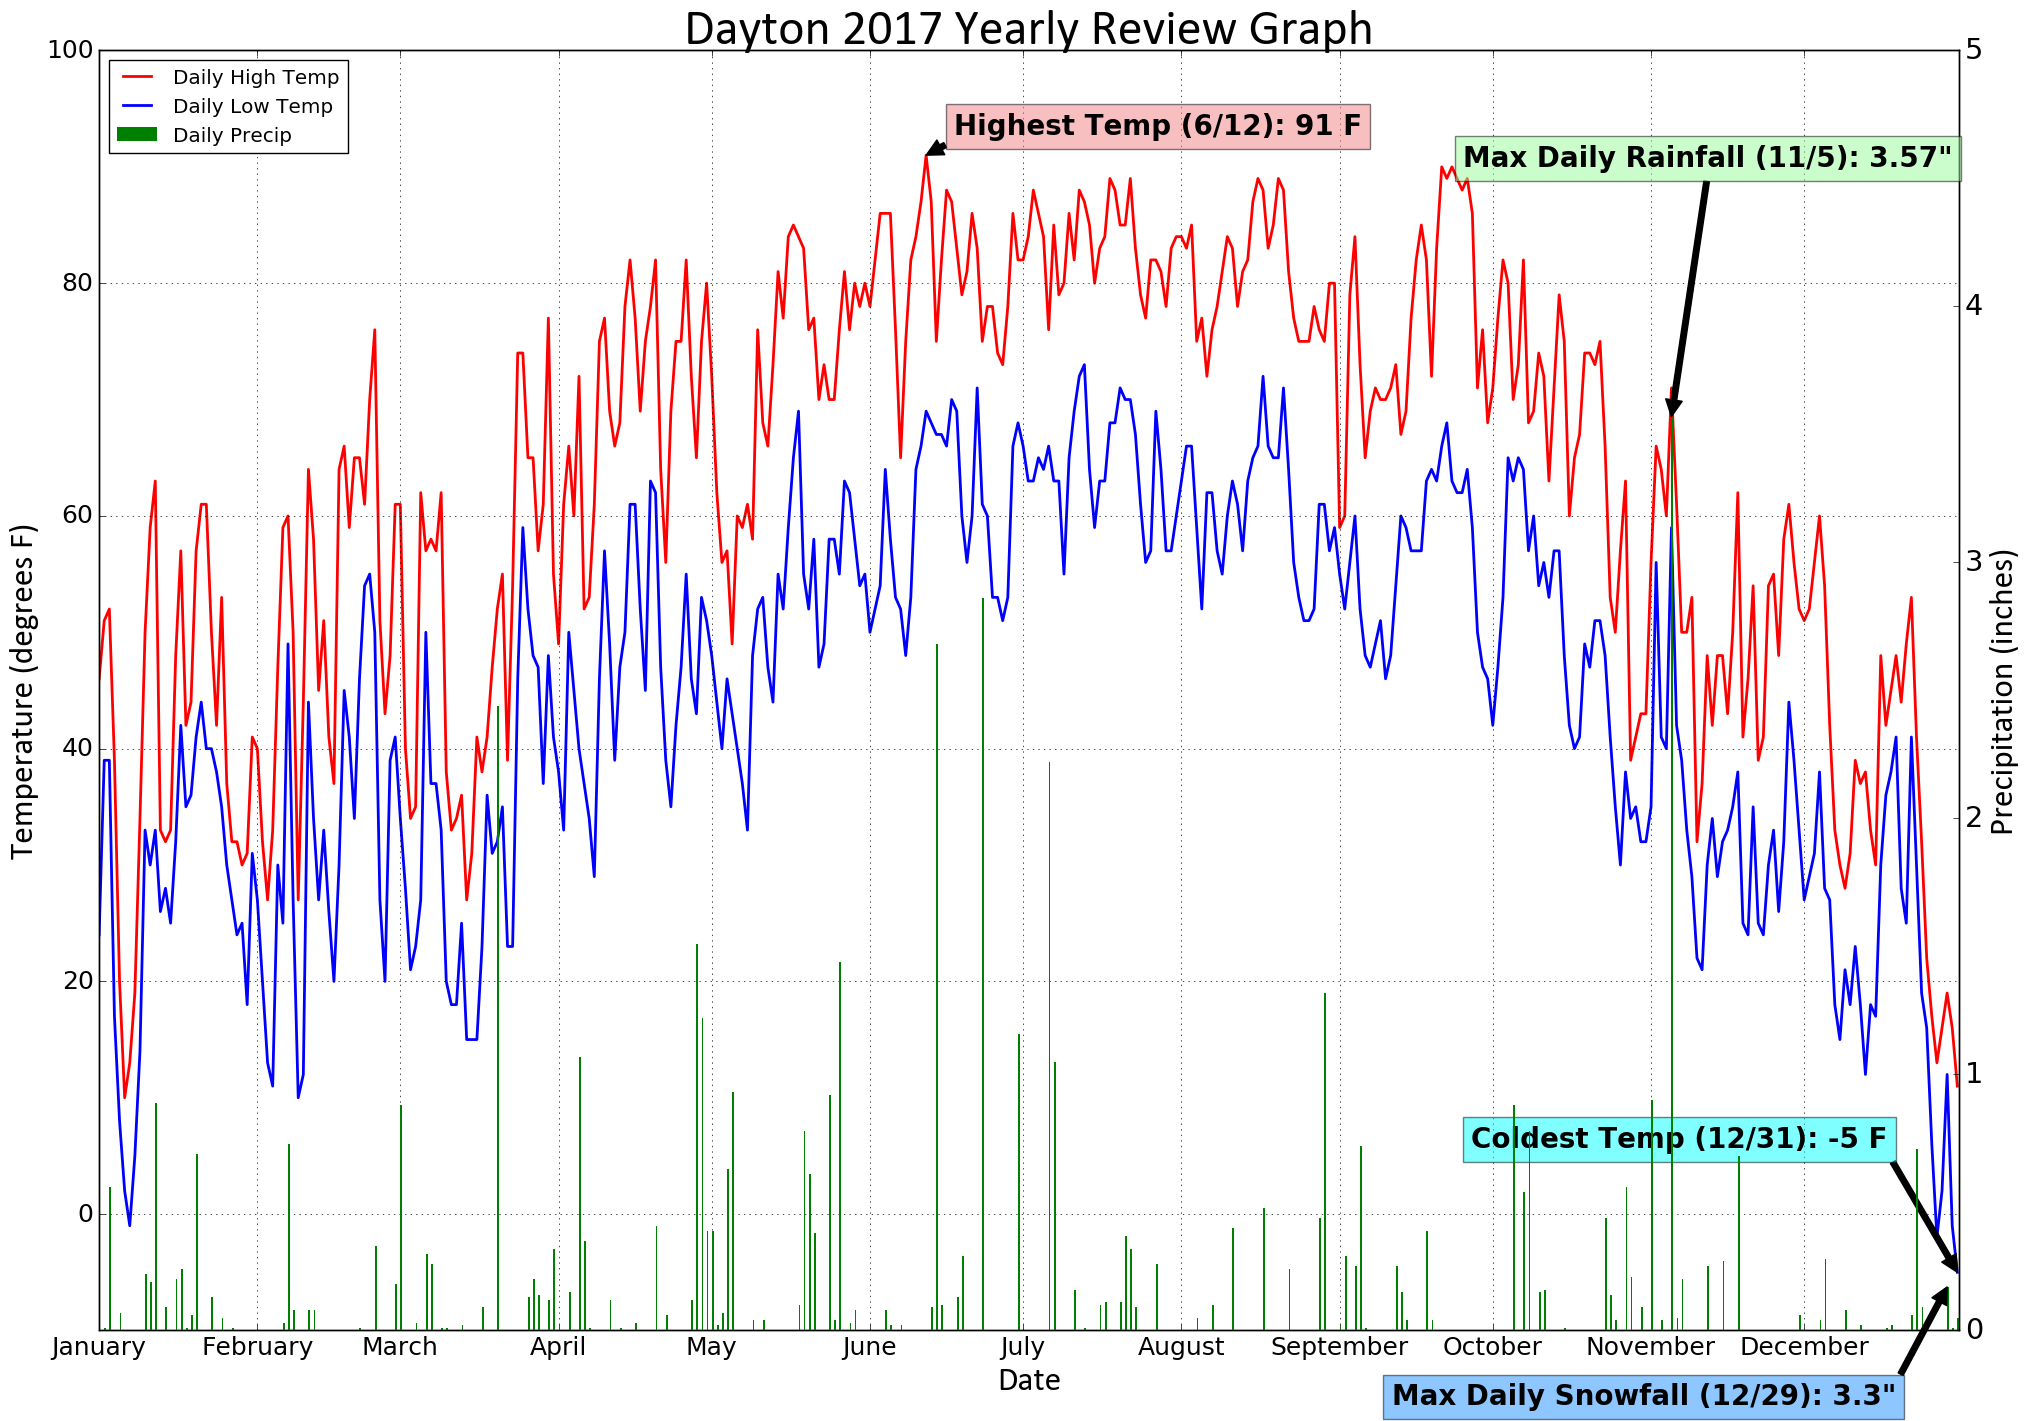
Dayton's observed precipitation for the year was 50.83" or 6th highest on record (1894 - Present). The record wettest year on record was 1990 and can be seen in blue on the graph above. |
Yearly Observed Snowfall (Compared To Normal)
|
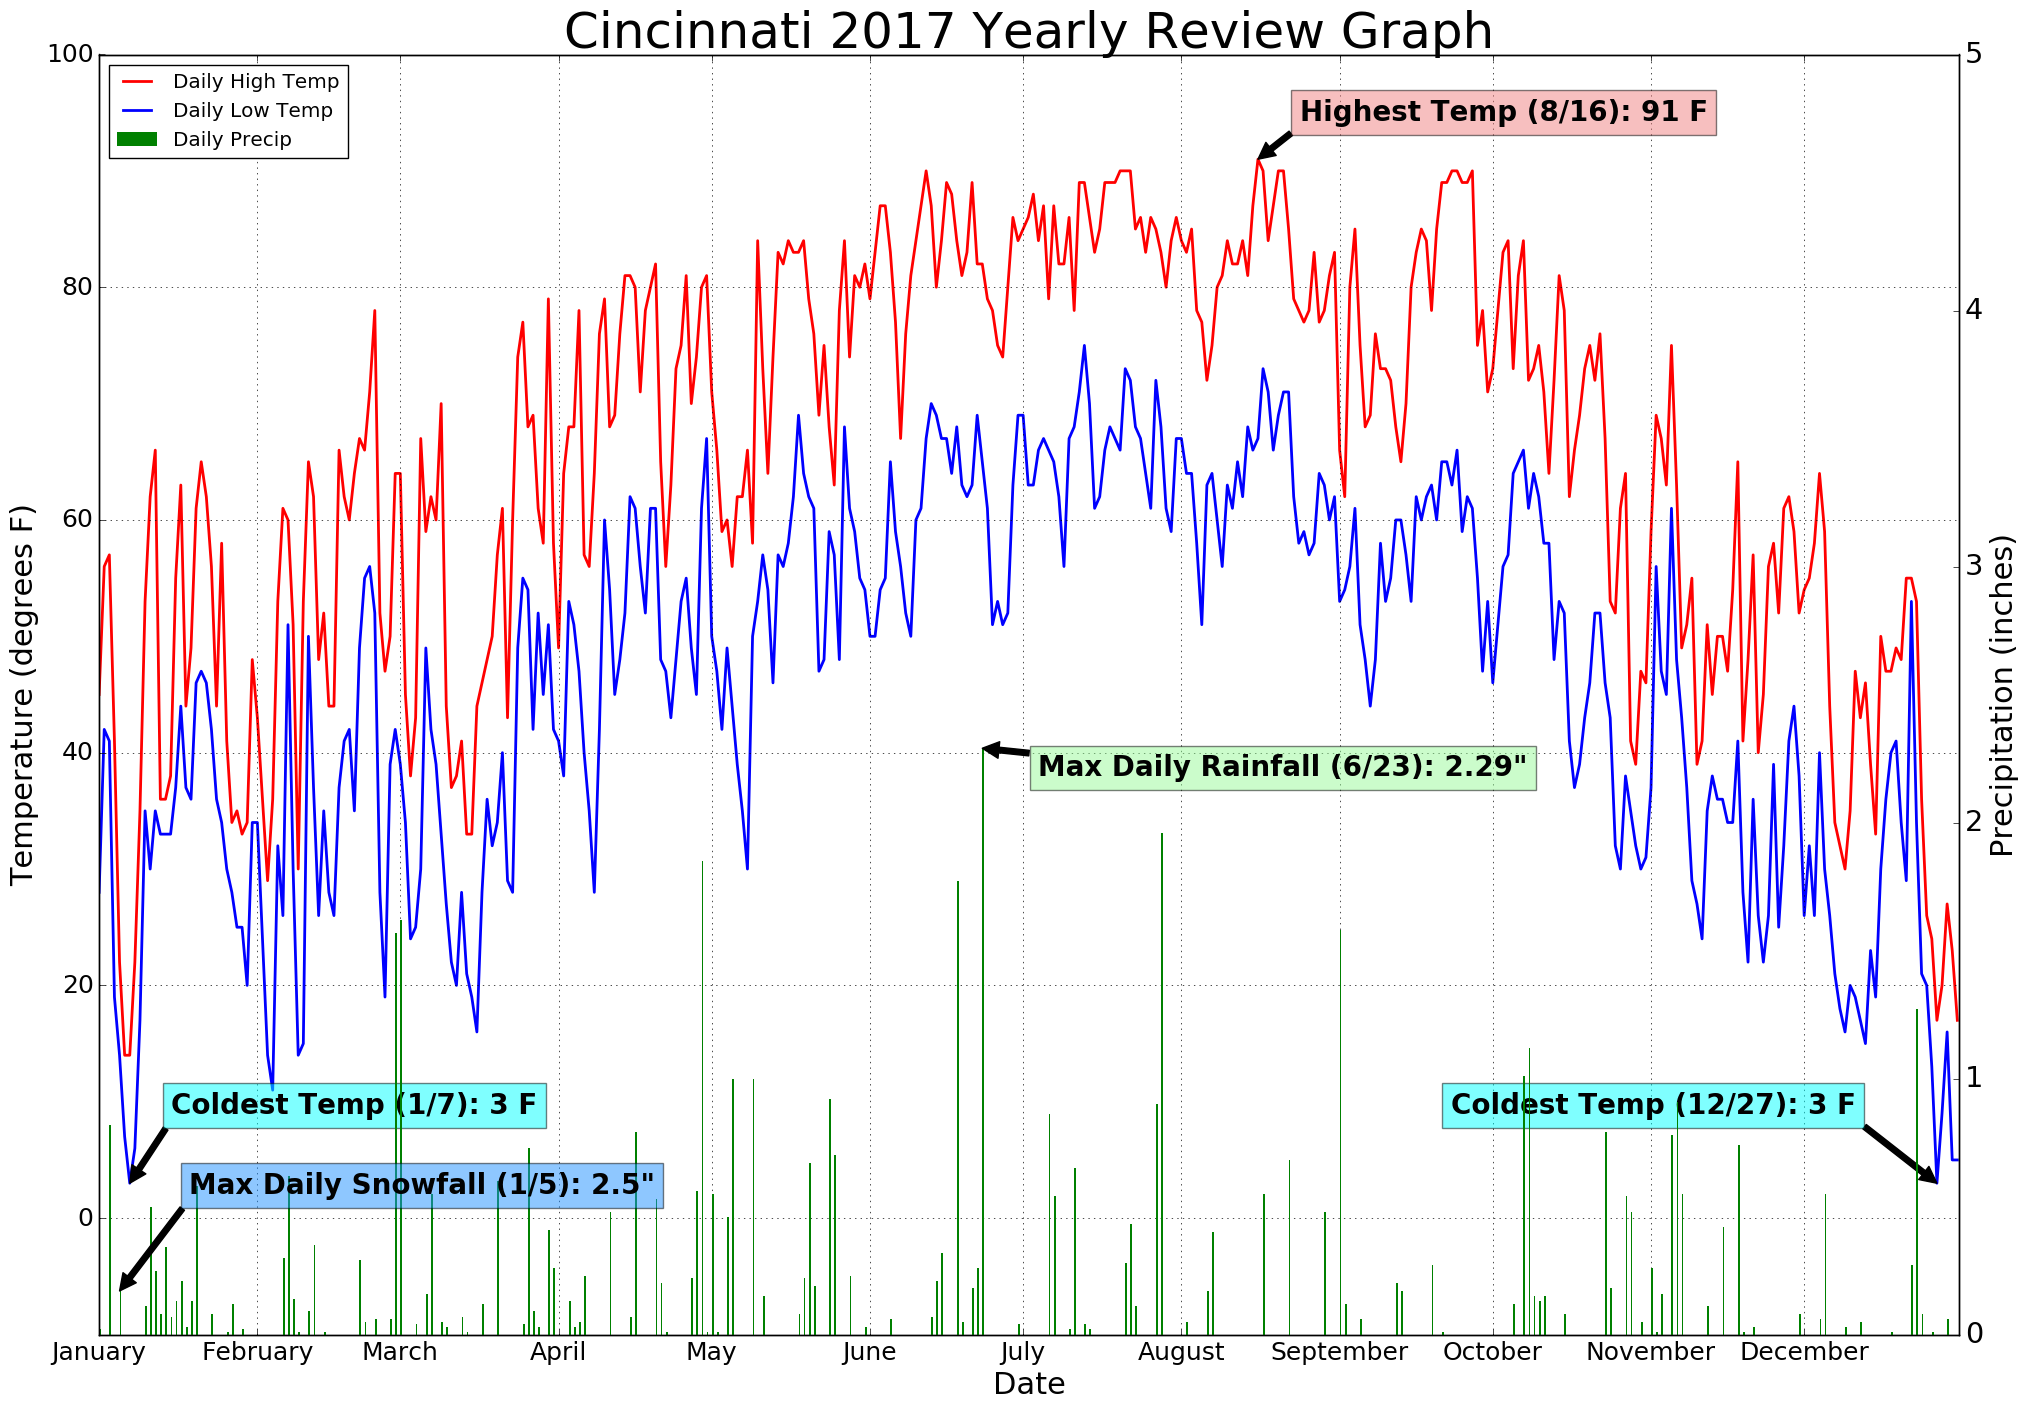
Cincinnati: 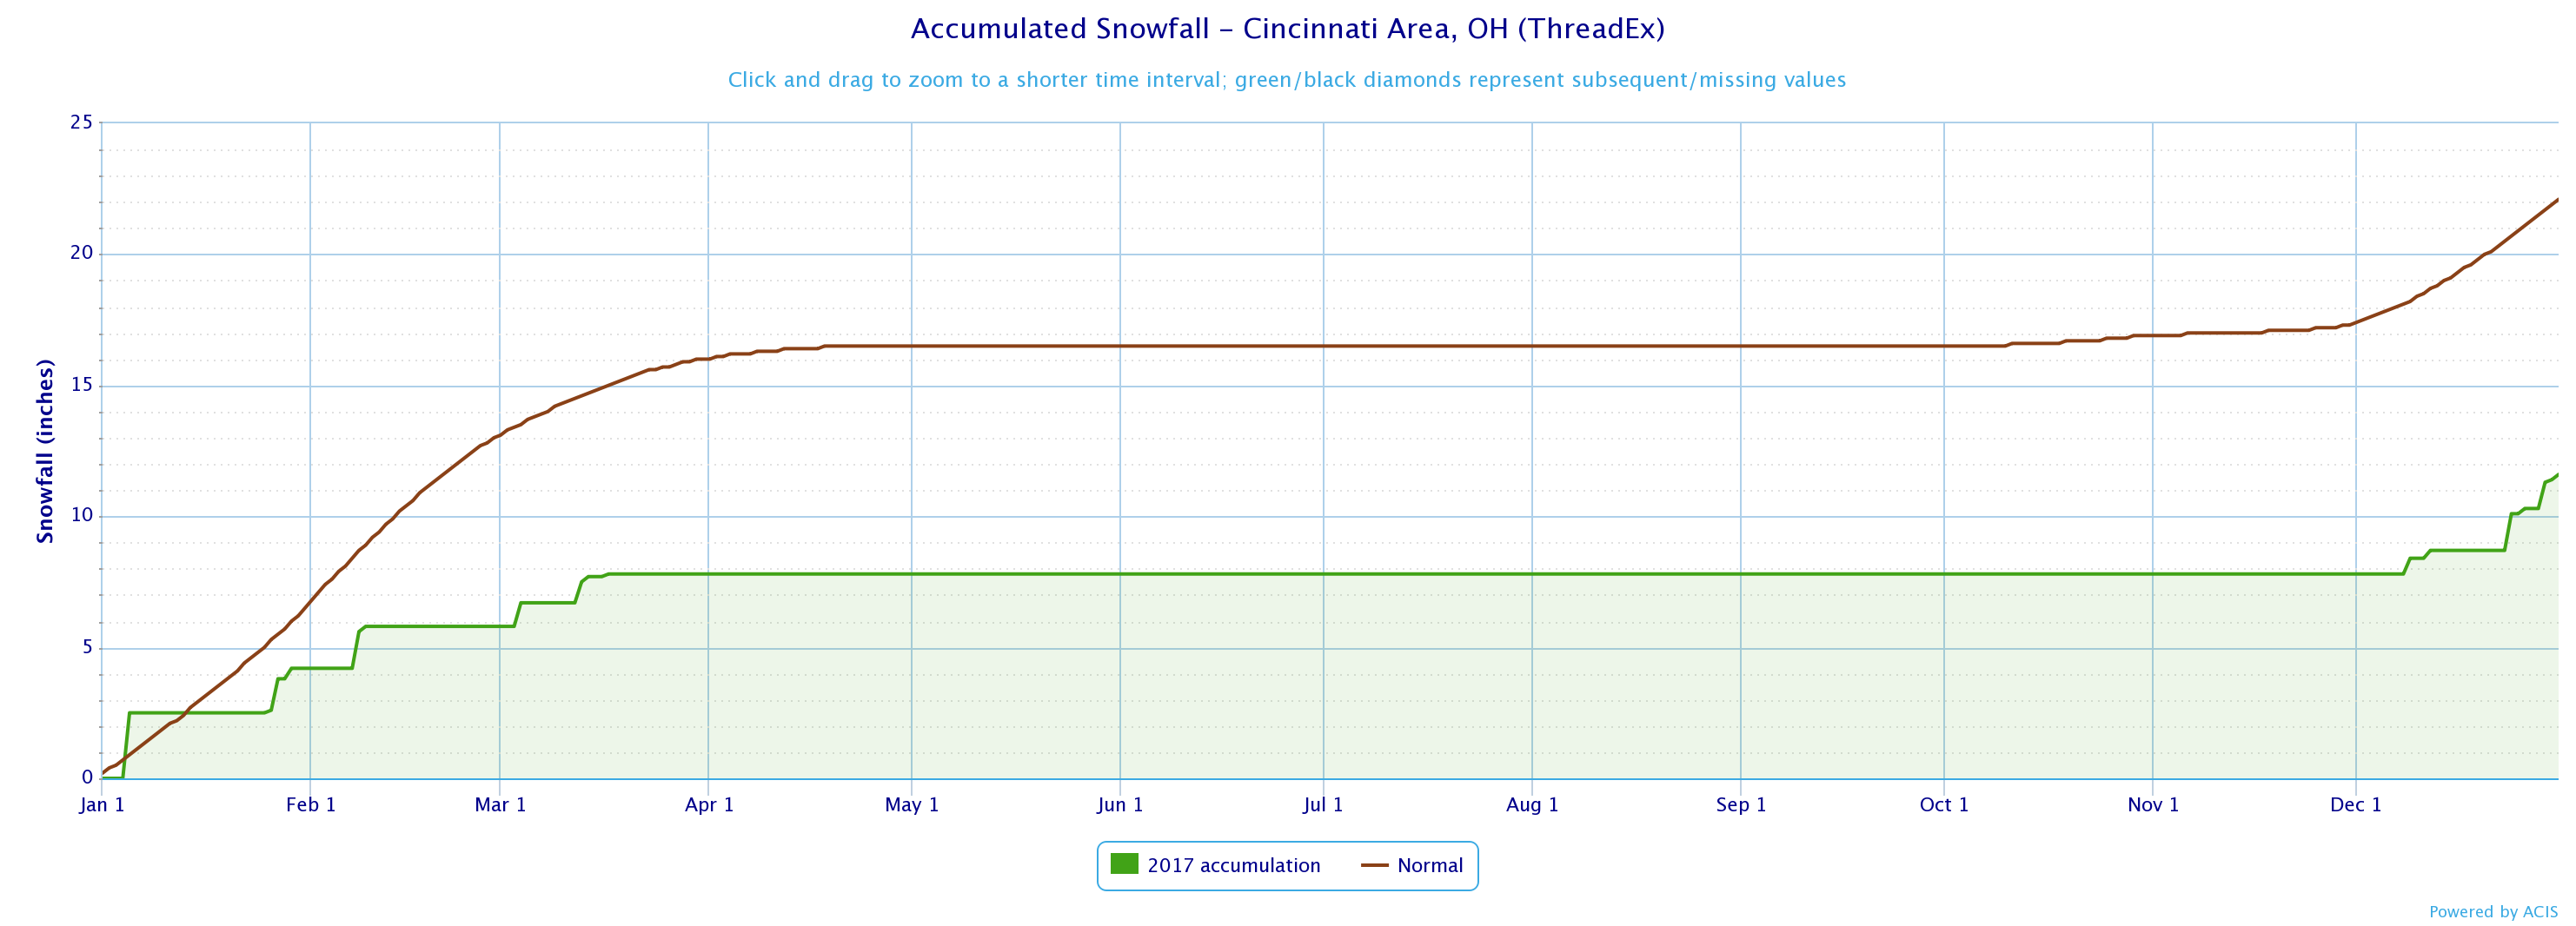
|
|
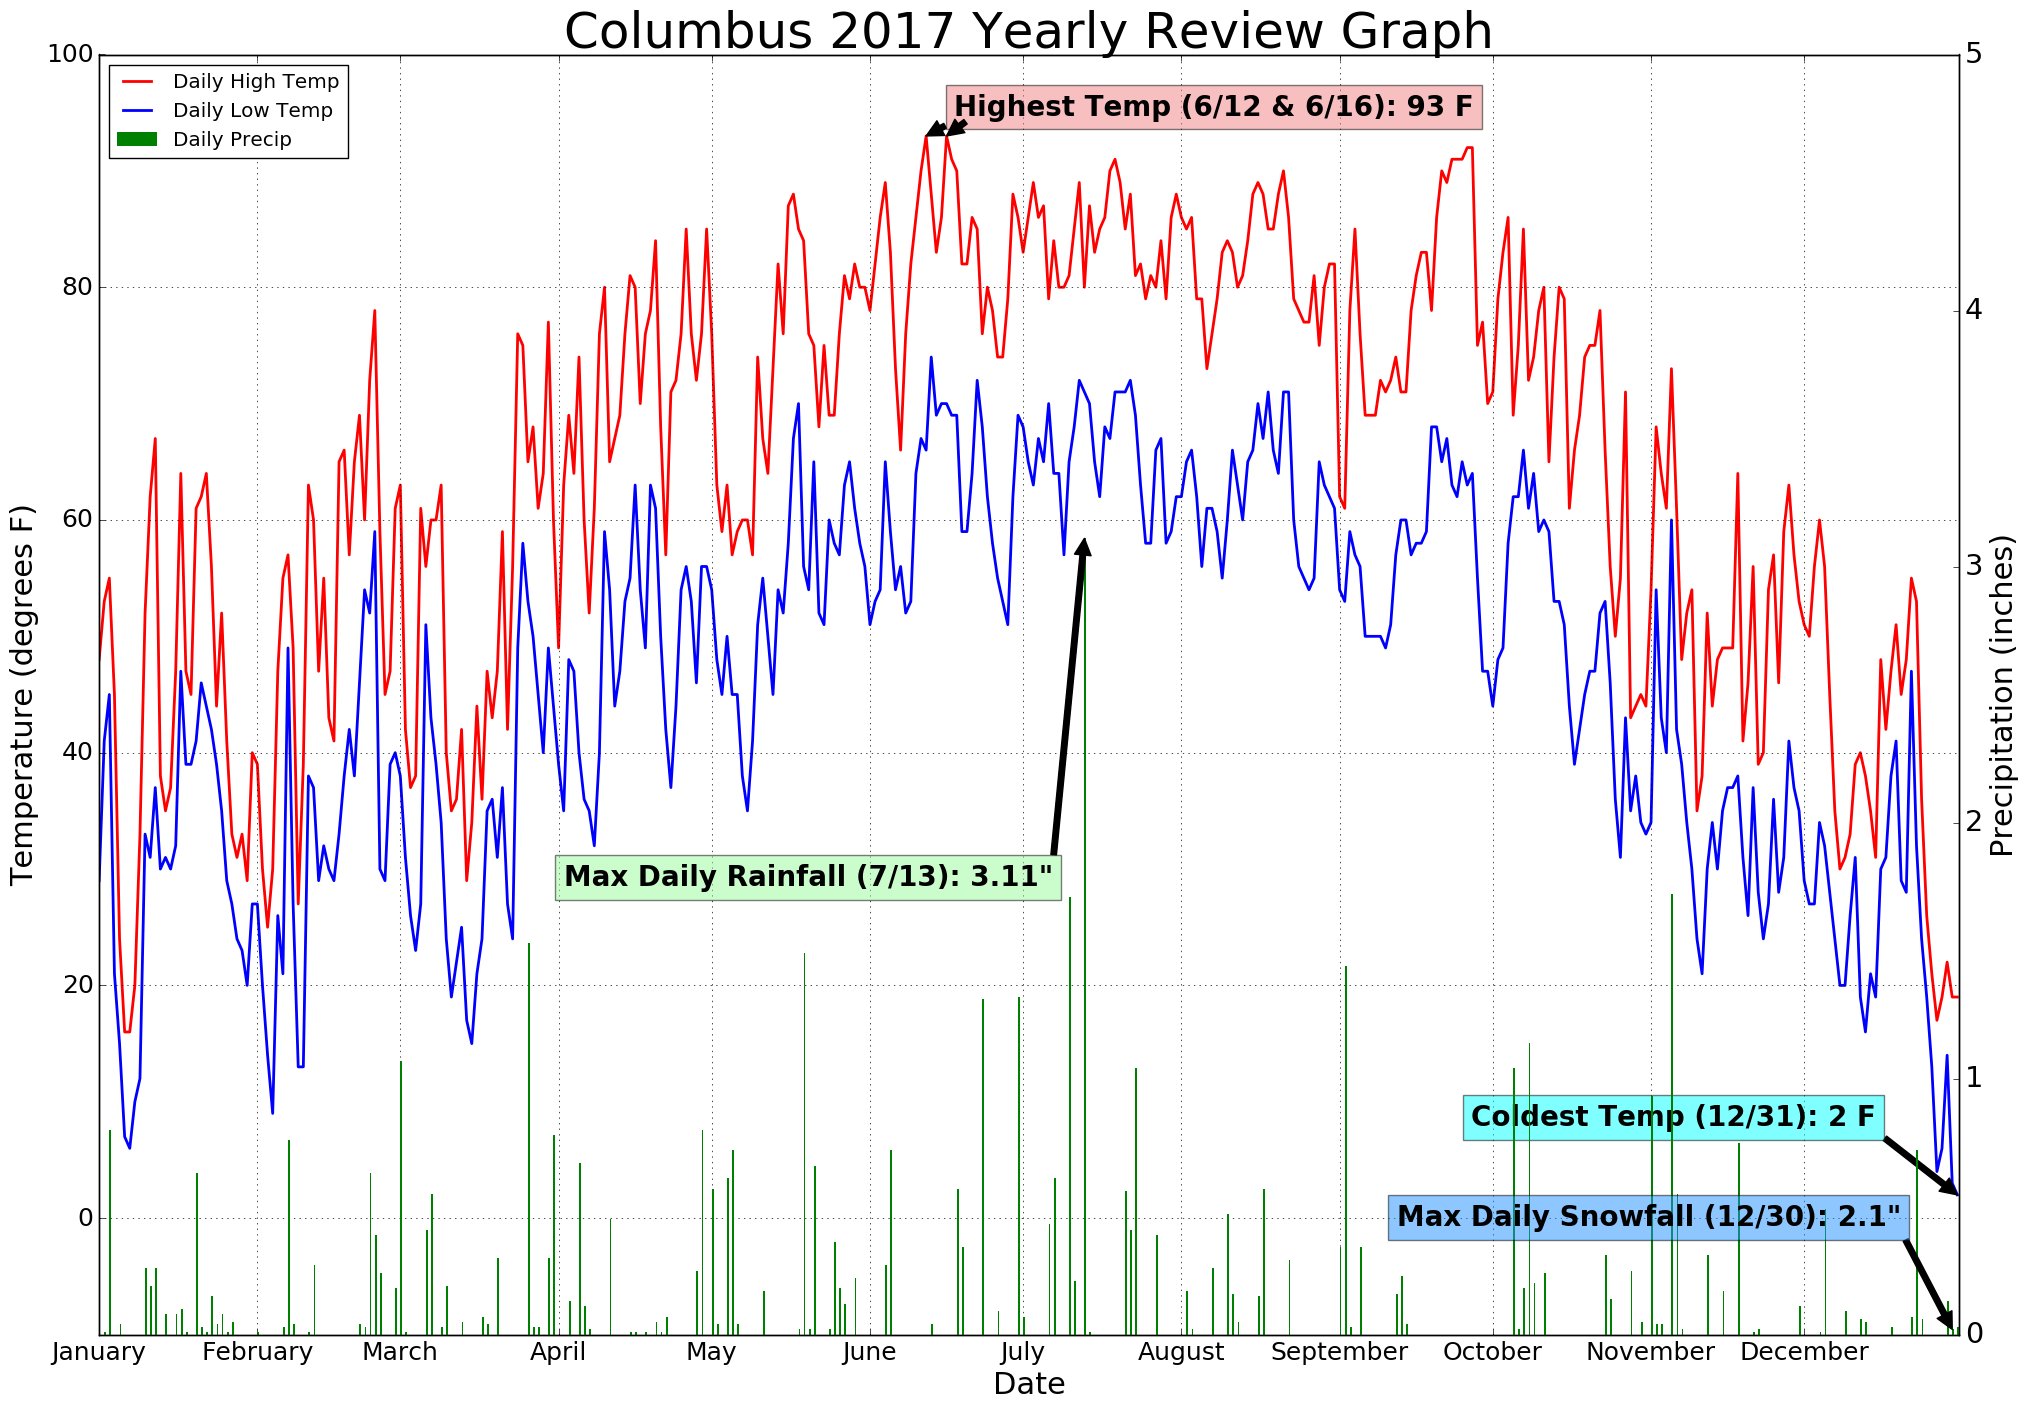
Columbus: 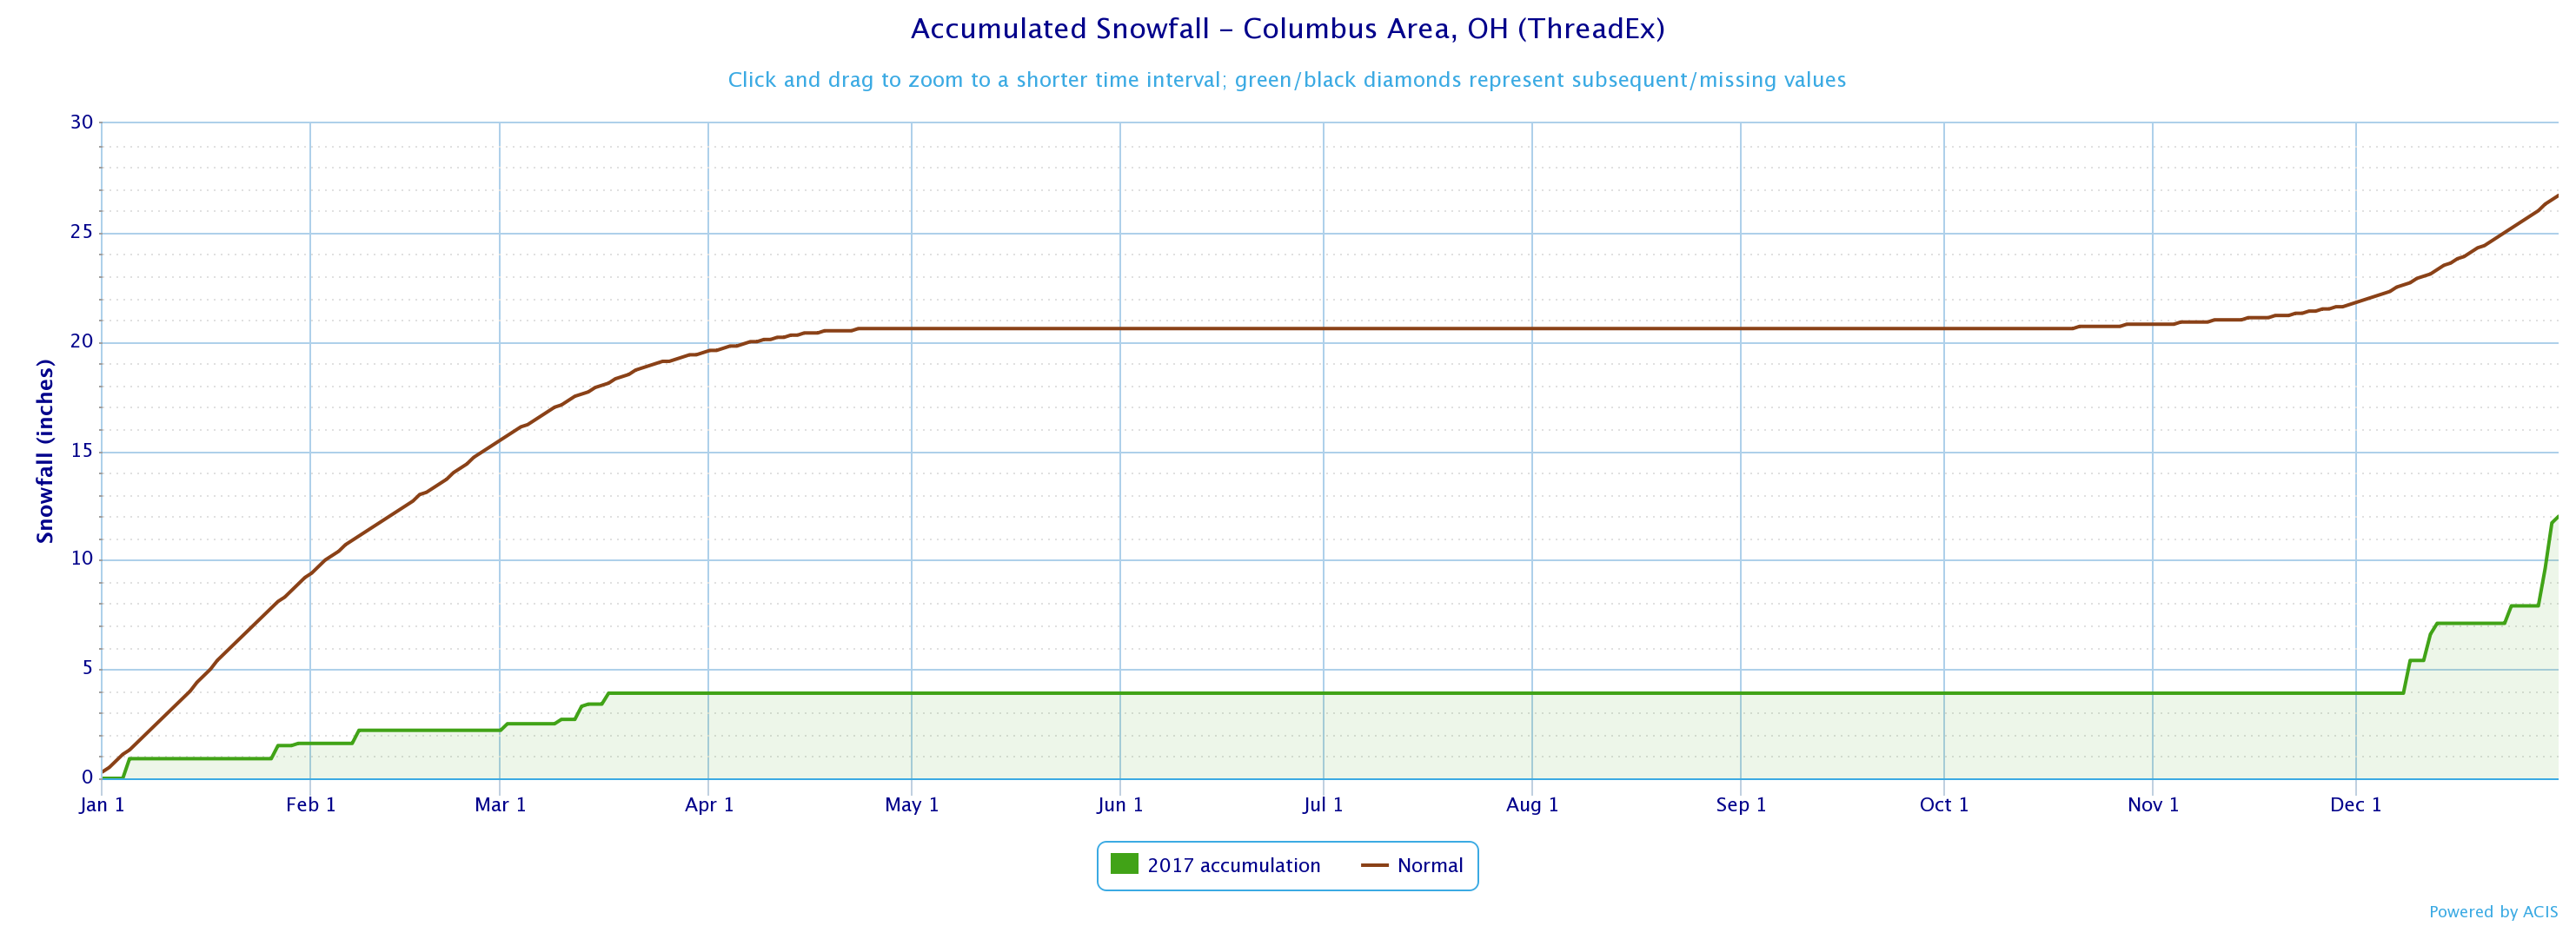
|
|
Dayton: 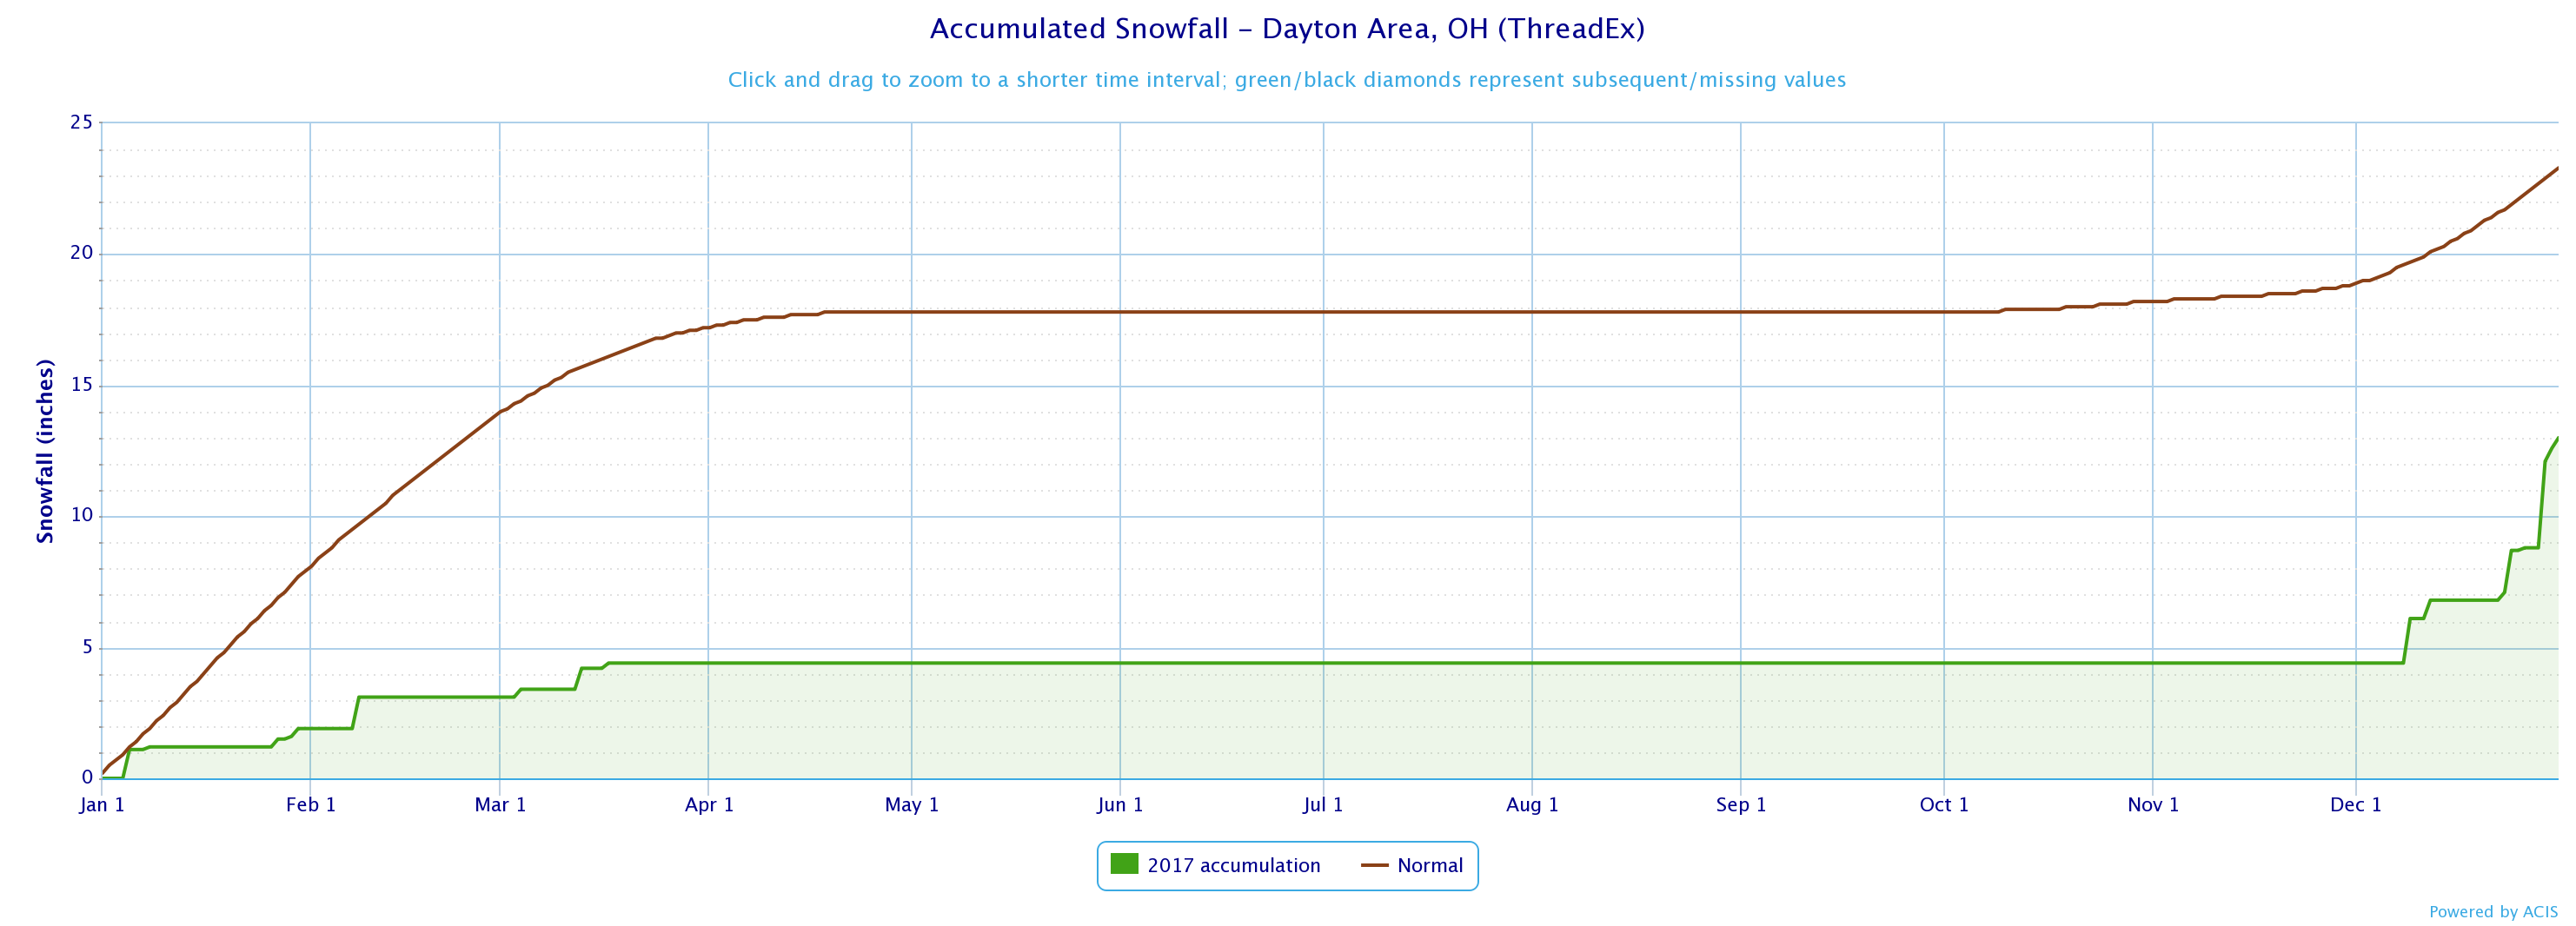
|
LOCAL CITY CLIMATE SUMMARIES FOR 2017
*** Cincinnati, OH (KCVG) 2017 Climate Data - *** Preliminary ***
Precip/Dep Avg T/Dep
JAN 3.67"/+0.67" 37.5/+6.7
FEB 3.55"/+0.74" 44.0/+9.5
MAR 4.81"/+0.85" 44.7/+1.1
APR 5.16"/+1.27" 60.8/+6.6
MAY 6.21"/+1.28" 63.0/-0.5
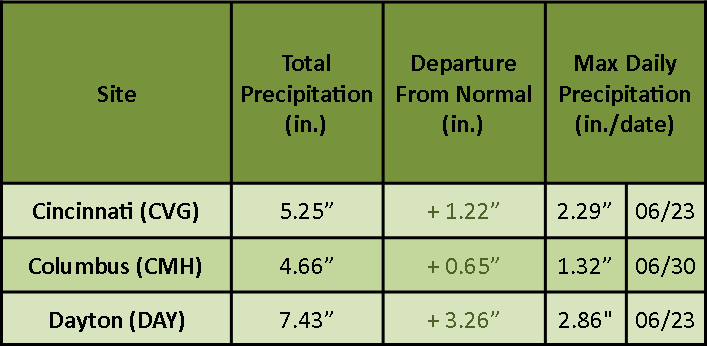
JUN 5.25"/+1.22" 71.2/-0.9
JUL 5.81"/+2.05" 75.8/-0.1
AUG 2.33"/-1.08" 72.7/-2.1
SEP 2.41"/-0.22" 67.7/+0.1
OCT 4.80"/+1.50" 58.0/+2.1
NOV 4.06"/+0.63" 45.2/+0.1
DEC 2.39"/-0.98" 32.3/-1.8
--------------------------------------------------
ANN 50.45"(12th wettest) 56.1(22rd Warmest- Tie)
*** Columbus, OH (KCMH) 2017 Climate Data - *** Preliminary ***
Precip/Dep Avg T/Dep
JAN 2.83"/+0.10" 36.8/+7.2
FEB 2.63"/+0.38" 42.2/+9.4
MAR 5.39"/+2.37" 43.1/+1.2
APR 2.59"/-0.81" 59.7/+6.6
MAY 5.24"/+1.07" 63.0/+0.5
JUN 4.66"/+0.65" 72.2/+0.7
JUL 8.55"/+3.76" 75.0/-0.2
AUG 2.14"/-1.18" 72.4/-1.5
SEP 2.58"/-0.26" 67.8/+1.0
OCT 3.57"/+0.96" 58.6/+3.6
NOV 4.67"/+1.47" 43.6/-0.8
DEC 1.76"/-1.21" 31.2/-2.3
---------------------------------------------------------------------
ANN 46.61"(10th wettest) 55.5(3rd Warmest)
*** Dayton, OH (KDAY) 2017 Climate Data - *** Preliminary ***
Precip/Dep Avg T/Dep
JAN 3.42"/+0.71" 34.4/+6.9
FEB 1.52"/-0.72" 41.7/+10.7
MAR 4.95"/+1.61" 41.2/+0.8
APR 5.46"/+1.37" 58.0/+6.4
MAY 6.50"/+1.84" 61.6/+0.2
JUN 7.43"/+3.26" 70.6/ 0.0
JUL 4.80"/+0.69" 73.8/-0.3
AUG 3.03"/+0.04" 70.7/-2.0
SEP 2.16"/-1.14" 66.4/+1.0
OCT 4.00"/+1.07" 57.0/+3.1
NOV 6.02"/+2.63" 42.7/-0.1
DEC 1.54"/-1.58" 28.8/-2.4
---------------------------------------------------------------------
ANN 50.83" (6th wettest) 53.9(24th Warmest- Tie)
January 2017:
Most of January proved to be a warm month minus one cold outbreak that occurred in the first week of the month. All first order climate sites also had above normal precipitation for the month but with warmer temperatures snowfall proved difficult to come by. The highest snowfall total in Cincinnati, Columbus, and Dayton for the month of January occurred on the 5th.
|

|
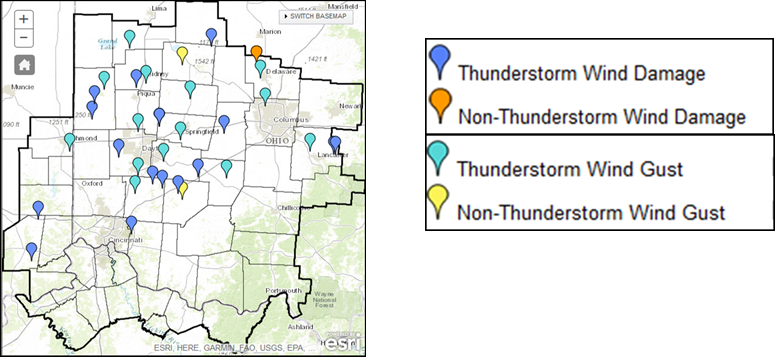
Severe weather also occurred on one day during the month on the the 10th of January. With this event a surface low moved northeast through the Great Lakes and a cold front moved into the Ohio Valley south of the surface low. Deep and strong southerly flow ahead of the front caused wind advisory level winds. Convection developed over Indiana and moved eastward. In the vicinity of the convection even stronger wind gusts began to occur. Several reports of wind damage were reported. The storms weakened as they moved southeast of I-71.
|
| January Climate Summary |
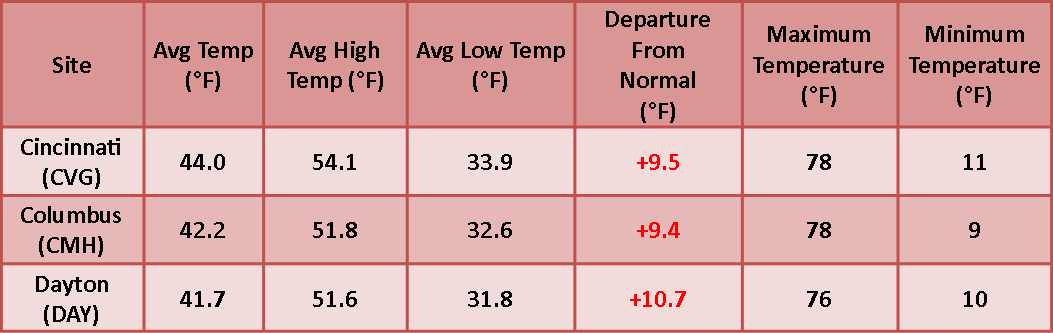
February 2017:
February 2017 will largely be remembered for a historic stretch of unseasonable warmth that persisted in the region for most of the month. With the spring-like temperatures, snowfall values were very low. Dayton and Columbus had measurable snow on only one day, while Cincinnati had measurable snow on only two days. February 8th was a day where persistent banding that evening allowed for 4-6â€+ to accumulate in some spots north of I-70.
The primary climate sites all recorded numerous days of 60°F+ warmth (Cincinnati 13, Columbus 10, and Dayton 10). For Cincinnati, this was the 2nd most days of high temperatures reaching at least 60°F+ on record in the month of February. Columbus and Dayton finished with the most 60°F+ temperatures on record in February. In addition to the historic number of 60+ degree days, Columbus had the highest mean average temperature on record, Cincinnati was 2nd warmest, and Dayton was tied for warmest February on record. Numerous temperature records were broken throughout the Month of February.
|
The warm temperatures also allowed for severe weather to occur. A strong cold front moved through late on the the 24th, bringing widespread precipitation, some damaging winds, and large hail to the area.
| February Climate Summary |
March 2017:
While the first 2/3 of the month featured mainly near or below normal temperatures, a significant warming trend developed for the final 10 days or so, with numerous days of highs in the 60s and even 70s. Although pockets of heavy rain occurred in southern parts of the region during the early morning hours of the 1st, the remainder of the month featured near normal precipitation. A series of storms resulted in a bit of a wet period from the 25th through the 27th, with many locations in the area receiving over an inch of rain in this 3-day span. The month also ended on a wet note as a low pressure system moved through the Ohio Valley during the final 2 days of the month.
March featured everything from snow to severe weather. Here are the snowfall accumulations from an event on the 13th of the Month.
Two notable severe events occurred during March including on the 1st and on the 26th. Multiple rounds of severe weather moved through the region during the early to mid morning hours on March 1, 2017. These storms produced all types of severe weather -- tornadoes, damaging winds, large hail, and flash flooding. Six tornadoes occurred including near Leesburg (EF0), Greenfield (EF0), Amelia (EF1), Anderson Township (EF0), New market (EF1), and Waverly (EF1), Ohio.

|
On March 26th, an EF1 tornado occurred in Williamsburg, Ohio. In addition large hail>1†in diameter also occurred with this day. Here are some images from the damage left behind from the Williamsburg tornado in Clermont County, Ohio.

|
| March Climate Summary |
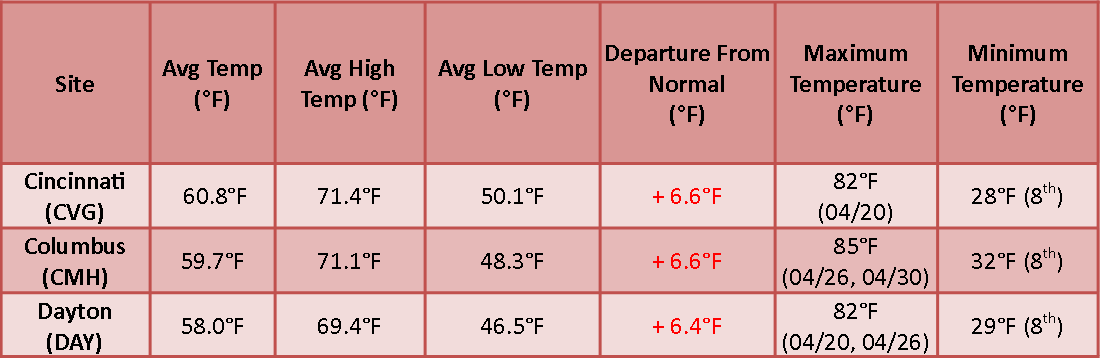
April 2017:
April 2017 was a month characterized by extended stretches of summer-like weather – both in terms of warmth and storminess. The region experienced numerous days with high temperatures in the 70s and 80s and finished the month with a week straight of above normal temperatures. Several active periods of storminess led to some significant rainfall totals through the month, particularly near and south of the Ohio River. In addition, there were numerous instances of flash flooding. Further north, towards Central Ohio, the weather pattern resulted in a bit of a drier month. Nevertheless, the month will largely be remembered for being one of the warmest Aprils on record at each of the three climate sites in the area. Columbus recorded its warmest April on record (average temperature of 59.7°F). Meanwhile, both Cincinnati and Dayton recorded their respective 2nd warmest month of April on record.
|
Although there were numerous rounds of showers and storms in the area during the month, there were two notable severe weather events that impacted the area including one on April 5th and another spanning from April 28th into the 29th. On April 5th, a round of storms moved from southwest to northeast through the area during the evening hours, producing instances of large hail and damaging winds. Additionally, two EF0s tornadoes were confirmed in Clark County, OH from this activity.
The 2nd major event occurred from the evening of the 28th through the morning hours on the 29th. A frontal boundary served as a focus for repeated rounds of storms, which produced instances of large hail, damaging winds, and numerous reports of flash flooding.
| April Climate Summary |
May 2017:
An unsettled and cool weather pattern started out the month. In fact, for example, Cincinnati (CVG) only recorded 2 completely dry days in the first 12 of the month (with DAY at 3 and CMH at 4). Moreover, Dayton (DAY) received measurable rain on each of the first 5 days of the month. The area transitioned to a drier and warmer pattern for the middle of the month. Temperatures fluctuated above and below normal for the remainder of the month as an unsettled and variable weather pattern returned to the region.
With the unsettled weather pattern multiple days of severe weather occurred including events on the 19th and the 24th of the month. On the 19th, a stalled front stretched from west to east across the middle part of the area provided a focus for shower and thunderstorm development during the afternoon and early evening hours. As a decaying MCV across Indiana tracked east during the early afternoon hours, increasing low-level instability allowed for thunderstorms to develop in east-central Indiana. These storms, aided by ample instability, tracked along and south of the stalled front, producing numerous reports of wind damage and even some hail. Although the storms were generally moving fairly quickly, intense rainfall rates lead to some high rainfall totals between 1-2 inches across parts of northern Kentucky.
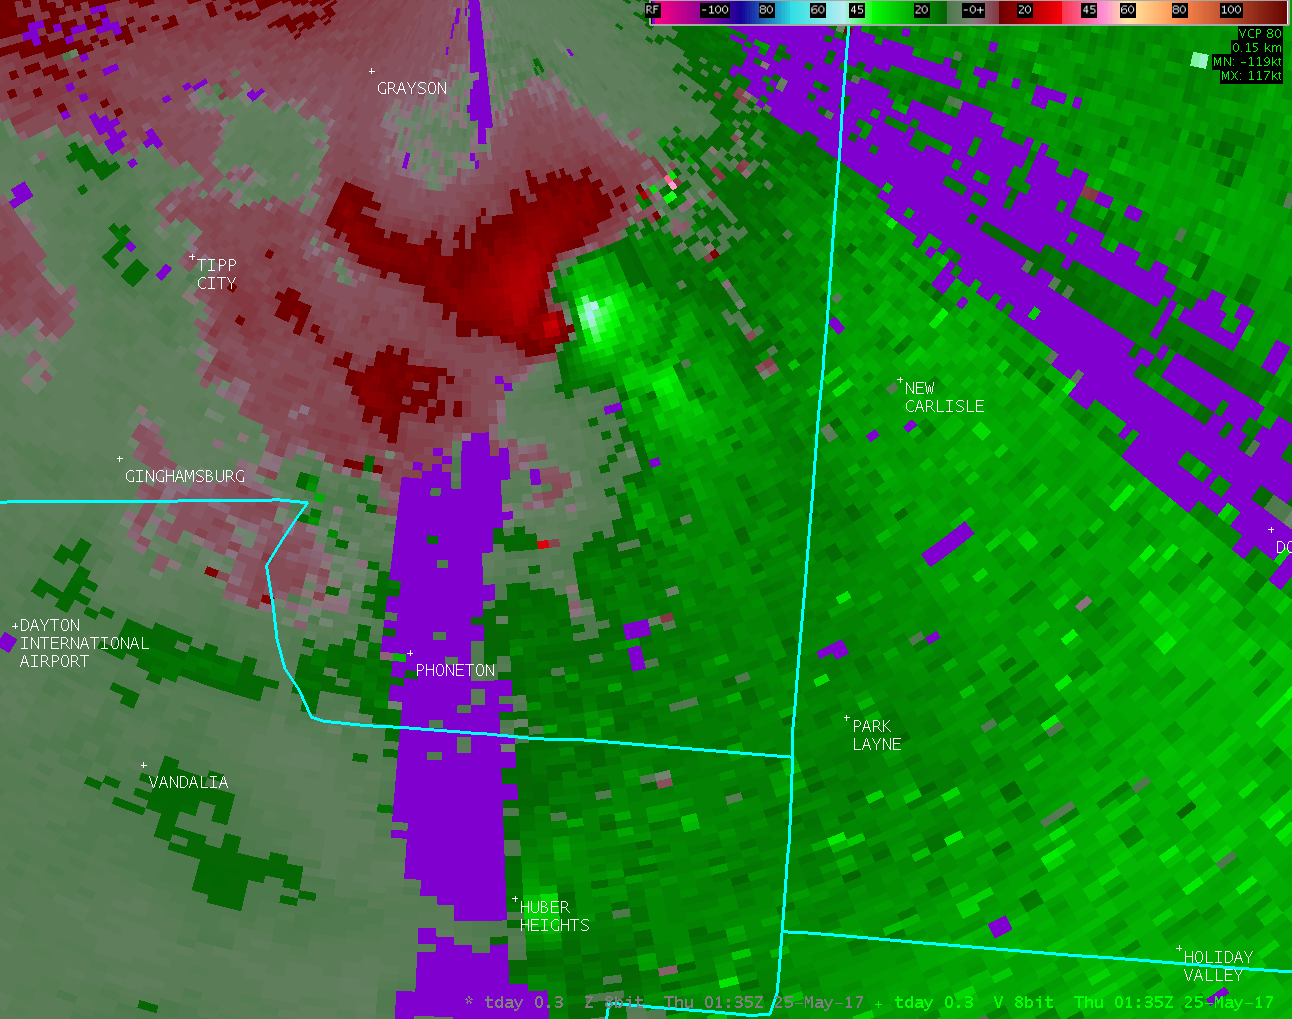
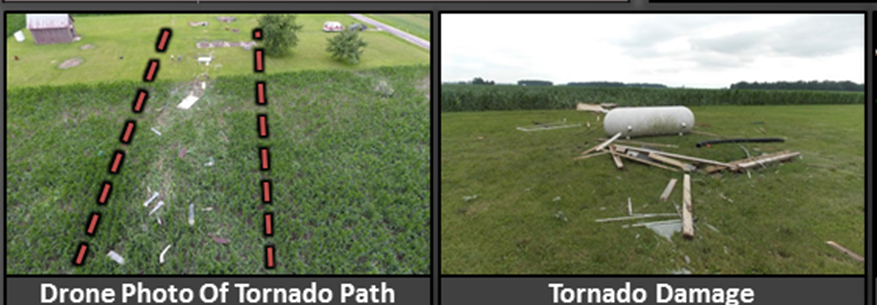
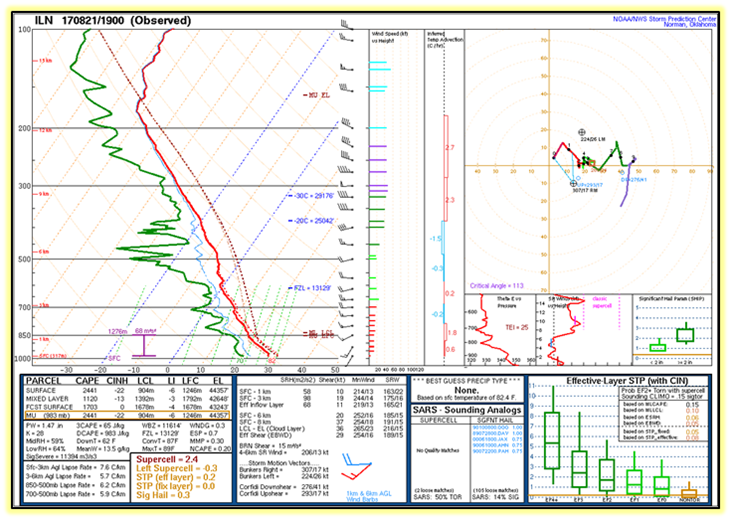
A potent area of low pressure developed in the region during the afternoon and evening hours of May 24, 2017. This surface low, aided by a dynamic and digging upper-level low pressure system across the mid-Mississippi River Valley, helped produce and enhance an environment in which low-level turning of the winds (wind shear) was quite significant. Of the few storms that did develop, many of them began to rotate almost immediately, spawning numerous wall clouds, funnels, and even a handful of tornadoes. One storm in particular, which moved north-northwest through the lower Miami Valley, had consistent rotation through its life (including many “cyclesâ€). This single storm is believed to be responsible for at least 4 tornado touch downs (2 EF1s and 2 EF0s). Two other EF0s made brief touch downs during the evening as well. The tornadoes were located near Harveysburg (EF0), Octa (EF0), Fairborn/Midway (EF0), Park Layne (EF1), Piqua (EF1), and Beavercreek Township (EF0). Before these tornadic storms developed, significant flash flooding occurred in southwestern Ohio, with numerous reports of rushing water over area roadways, particularly in Butler and Hamilton Counties.

|
|
| May Climate Summary |
June 2017:
Although June 2017 started off on a dry and seasonably warm note, the month will largely be remembered for a significant heavy rainfall event that impacted the area on the 23rd. This event, the result of the remnants of Tropical Cindy merging with a frontal boundary, produced widespread rainfall amounts of 2 to 4+ inches, much of which occurred in only a 6 to 8 hour time frame for any one location. Roughly 40 instances of flooding and flash flooding were reported to our office in the 18-hour span on the 23rd. As a result of this event, each of the 3 major climate sites recorded above normal precipitation for the month. In addition to the flooding that occurred on the 23rd, multiple instances of severe weather (including flooding/flash flooding) occurred on the 4th, 5th, 13th, 14th, 18th, 19th, and 24th.
|
| June Climate Summary |
July 2017:
July 2017 will largely be remembered for repeated rounds of intense storm activity that resulted in numerous instances of flooding and flash flooding in the local area in addition to damaging winds, hail, and tornadoes. With seasonably moist low level conditions in place for most of the month, storm activity often produced heavy to extreme rainfall rates which resulted in the aforementioned flooding. With the fairly-consistent storm activity, temperatures never strayed too far from the seasonal norms. Some of the events that occurred during the month are highlighted below:
Severe weather occurred on July 7th, 2017 with mostly high wind reports received. The first round of storms occurred in the late morning of the 7th into the early afternoon. A second round of storms then developed late afternoon into evening. A survey concluded that a microburst was responsible for damage observed in the Fayetteville, Ohio area.

|
Severe weather initially moved across the Columbus area during the daytime hours on July 10th. Another round of severe weather moved into Mercer County during the evening hours. An EF0 Tornado touched down near Rockford, Ohio. The tornado was on the ground from about 8:14pm to 8:31pm and had estimated maximum wind speeds of 70 mph.
|
During the early afternoon hours of July 11th, 2017, a decaying mesoscale convective system (MCS) moved into western portions of the area. The complex began to bow forward as it entered the area, and strong winds aloft were transported down to the ground. There were measured winds of at least 63 MPH near Richmond, IN with numerous reports of downed trees and minor structural damage through east central Indiana and west central Ohio. The complex eventually dissipated as it moved east through the middle of the afternoon, but not before creating a swath of widespread wind damage stretching from Wayne County, Indiana through Montgomery County, Ohio. https://www.weather.gov/iln/20170711
| July Climate Summary |
August 2017:
August 2017 was a month that featured very little in the way of weather extremes or high-impact events in the local area although some severe weather still occurred. Temperatures never strayed too far from normal and severe weather activity was on the low side. With extended bouts of slightly cooler than normal temperatures, storm activity was often isolated in nature – which led to near normal or below normal precipitation.
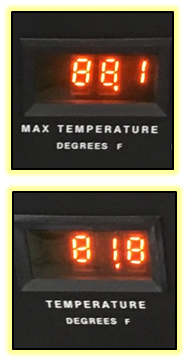
On Monday August 21st, a solar eclipse occurred across the region. Although the local area was not in the path of total obscuration, there were weather changes that were noted as a result. At the National Weather Service in Wilmington, Ohio there was a special weather balloon launched at peak obscuration. The temperature dropped over 6 degrees at the National Weather Service office, however some locations observed over a 10+ degree drop.
|
|
| August Climate Summary |
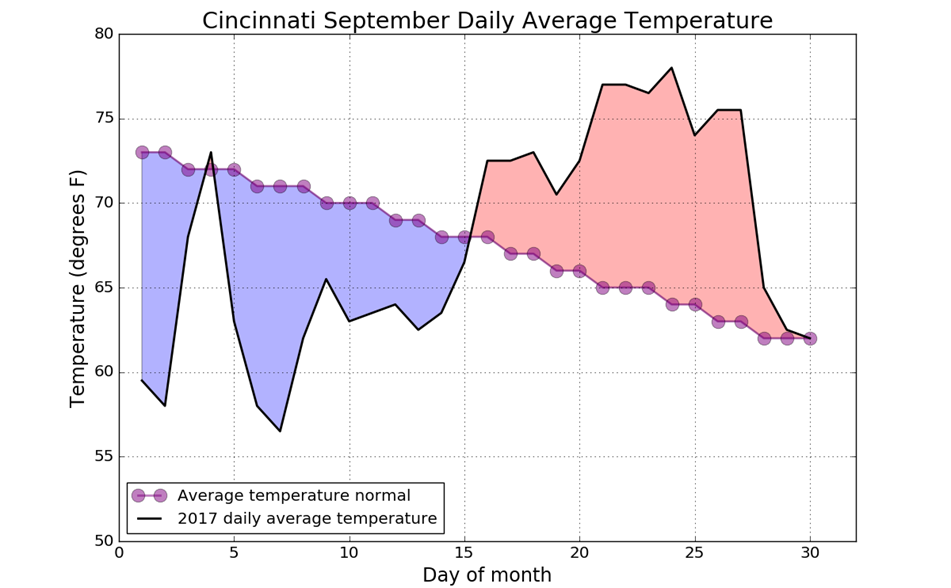
September 2017:
The month of September was very quiet from a severe weather standpoint with only a handful of reports and started off cool. The cool temperatures lasted through the first half of the month before turning much warmer by the second half. All three climate sites reported 90 degree temperatures before the month was over. The remnants of two hurricanes, Harvey and Irma, brought precipitation to the region during the month.
|
| September Climate Summary |
October 2017:
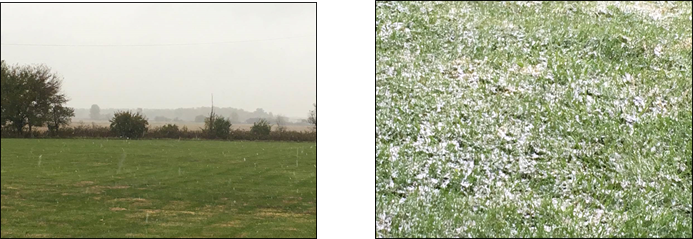
October started off warm with heavy rain from the remnants of once-Hurricane Nate. By the end of the month a strong cold front moved through bringing much cooler temperatures to the region. Some locations also observed the first snowfall of the season by the end of the month.
|
Isolated severe weather also occurred during the month including an EF0 tornado near Sunman, Indiana on October 7th. Pictures of selected damage are below:

|

|
| October Climate Summary |
November 2017:
The month of November started warm with temperatures reaching the mid 70s in places by the first week. This warmth was also accompanied by severe weather and flooding on November 5th into the 6th. Below normal temperatures then persisted through most of the rest of the month. The two exceptions being on November 18th and towards the end of the month when temperatures again warmed. High winds, heavy rain, and flooding also occurred on the 18th.
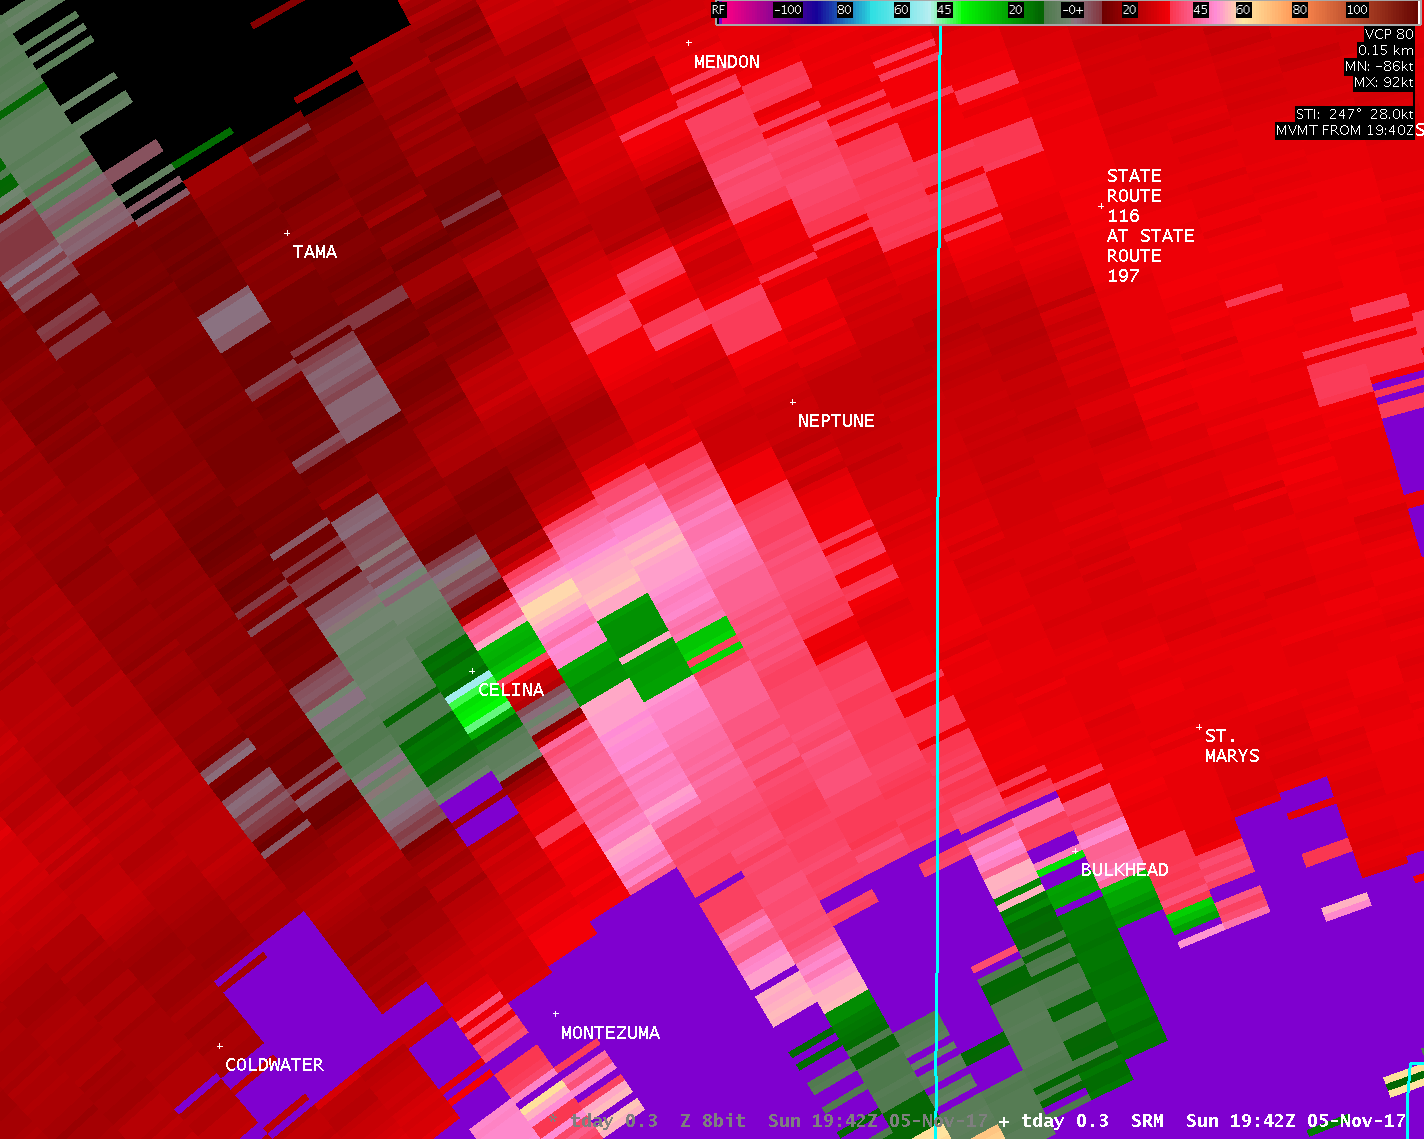
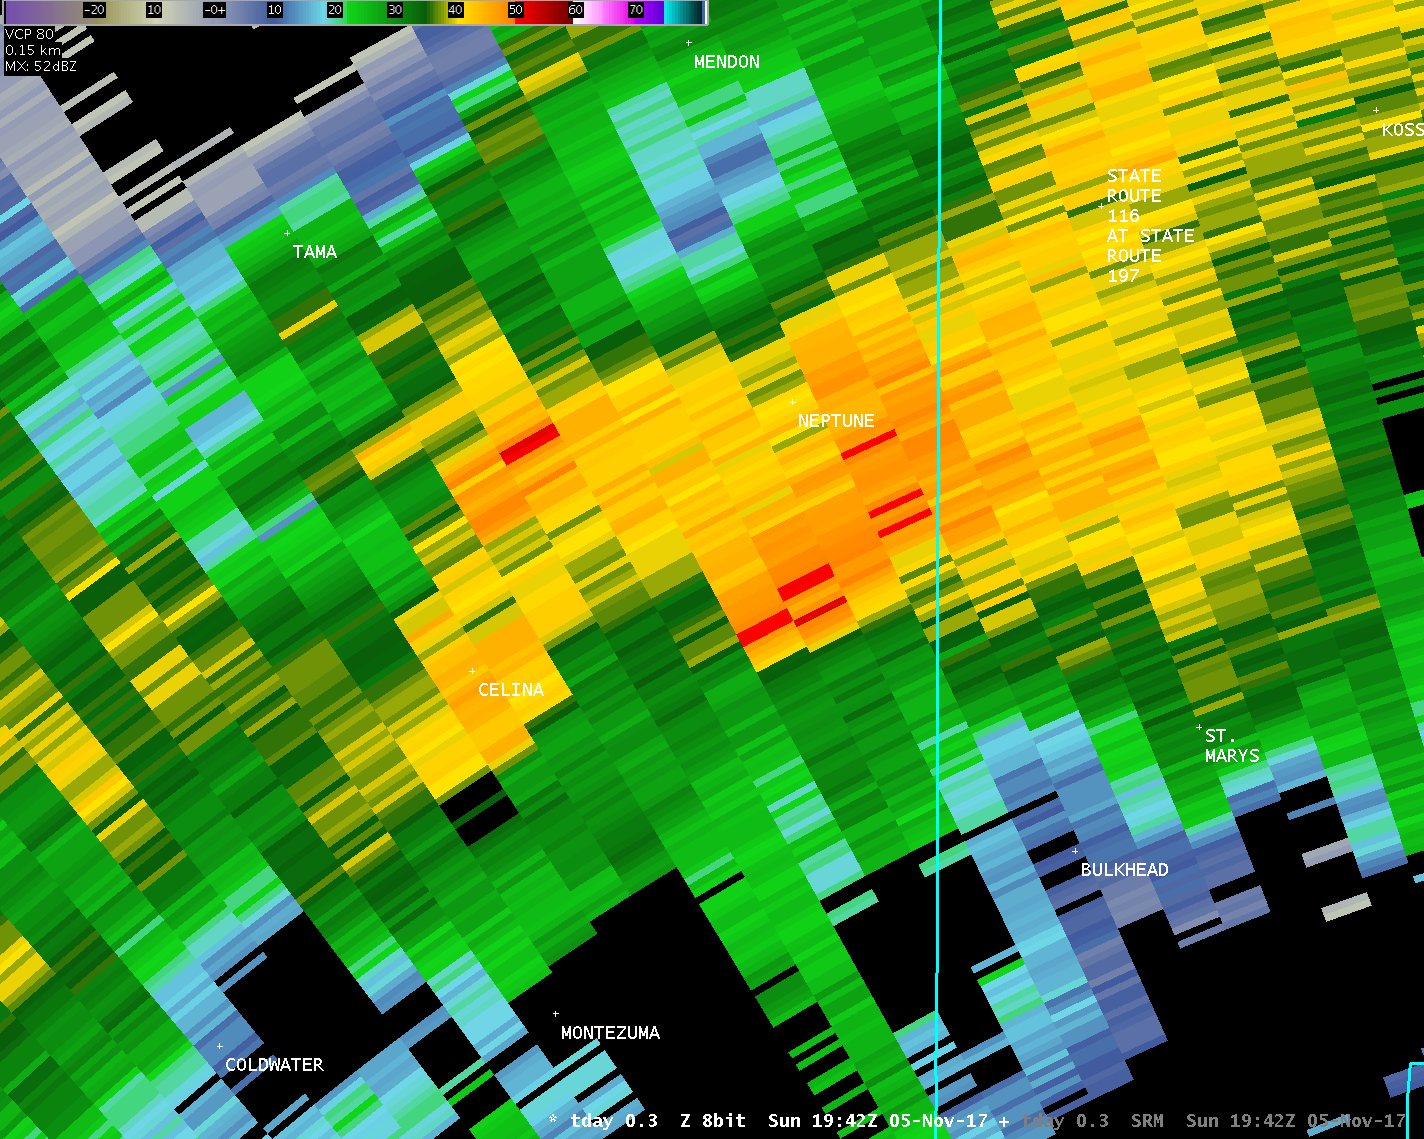
With the event on the 5th into the 6th supercell thunderstorms developed west of the local area during the afternoon hours and moved into parts of Mercer and Auglaize Counties in Ohio. These supercells spawned two separate EF2 tornadoes, including one in Western Mercer County and one near Celina, Ohio. Another tornado (rated EF1) touched down later in the evening near South Vienna, OH. Another tornado survey was done in Brown County in response to a tornado debris signature that was noted on radar, however after an extensive search no evidence of a tornado touchdown could be found. Significant heavy rain also evolved through the evening and overnight hours, with numerous reports of flooding and flash flooding throughout the area. Widespread 2-4†was observed from west-central through central Ohio.
Damage From Celina:

|
Radar Imagery of Tornadic Circulation:
|
|
| November Climate Summary |
December 2017:
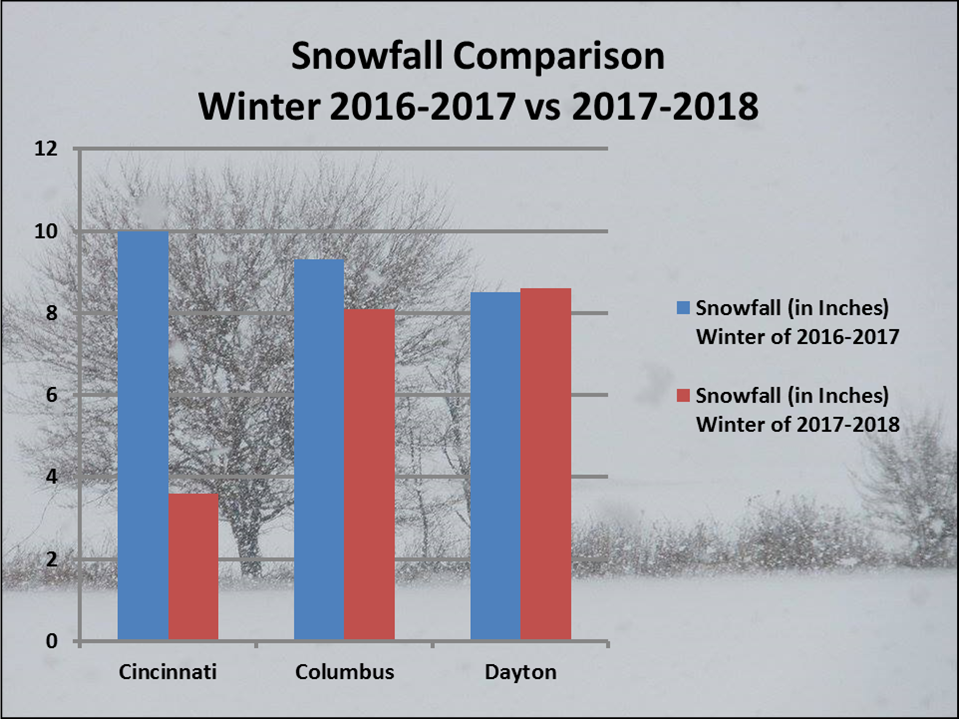
Although there were fluctuations in the regional temperature trends through the month, the most extreme temperature departures from normal occurred in the final week of December when a bitterly cold airmass settled into the region. Precipitation was generally below normal for the month however snowfall was above normal for a large portion of the region. In just the month of December Dayton already surpassed all of last winter’s snowfall for the entire season! Columbus is well on their way to surpass last winter, while Cincinnati still has several inches to go.
|
| December Climate Summary |

