Indianapolis, IN
Weather Forecast Office
| Statistics | Rainfall Maps | River Level Plots |
The wet weather pattern of June continued into July across central Indiana. Waves of thunderstorms moved across the state at times during the month, some bringing more than 5" in one day to some locations.
The heavy rain resulted not only in flash flooding, but also prolonged flooding of area streams and rivers. The flooding damaged homes and property.
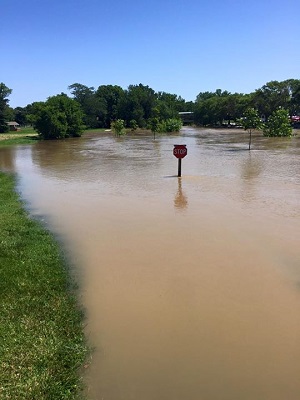
Haw Creek near Columbus on July 14
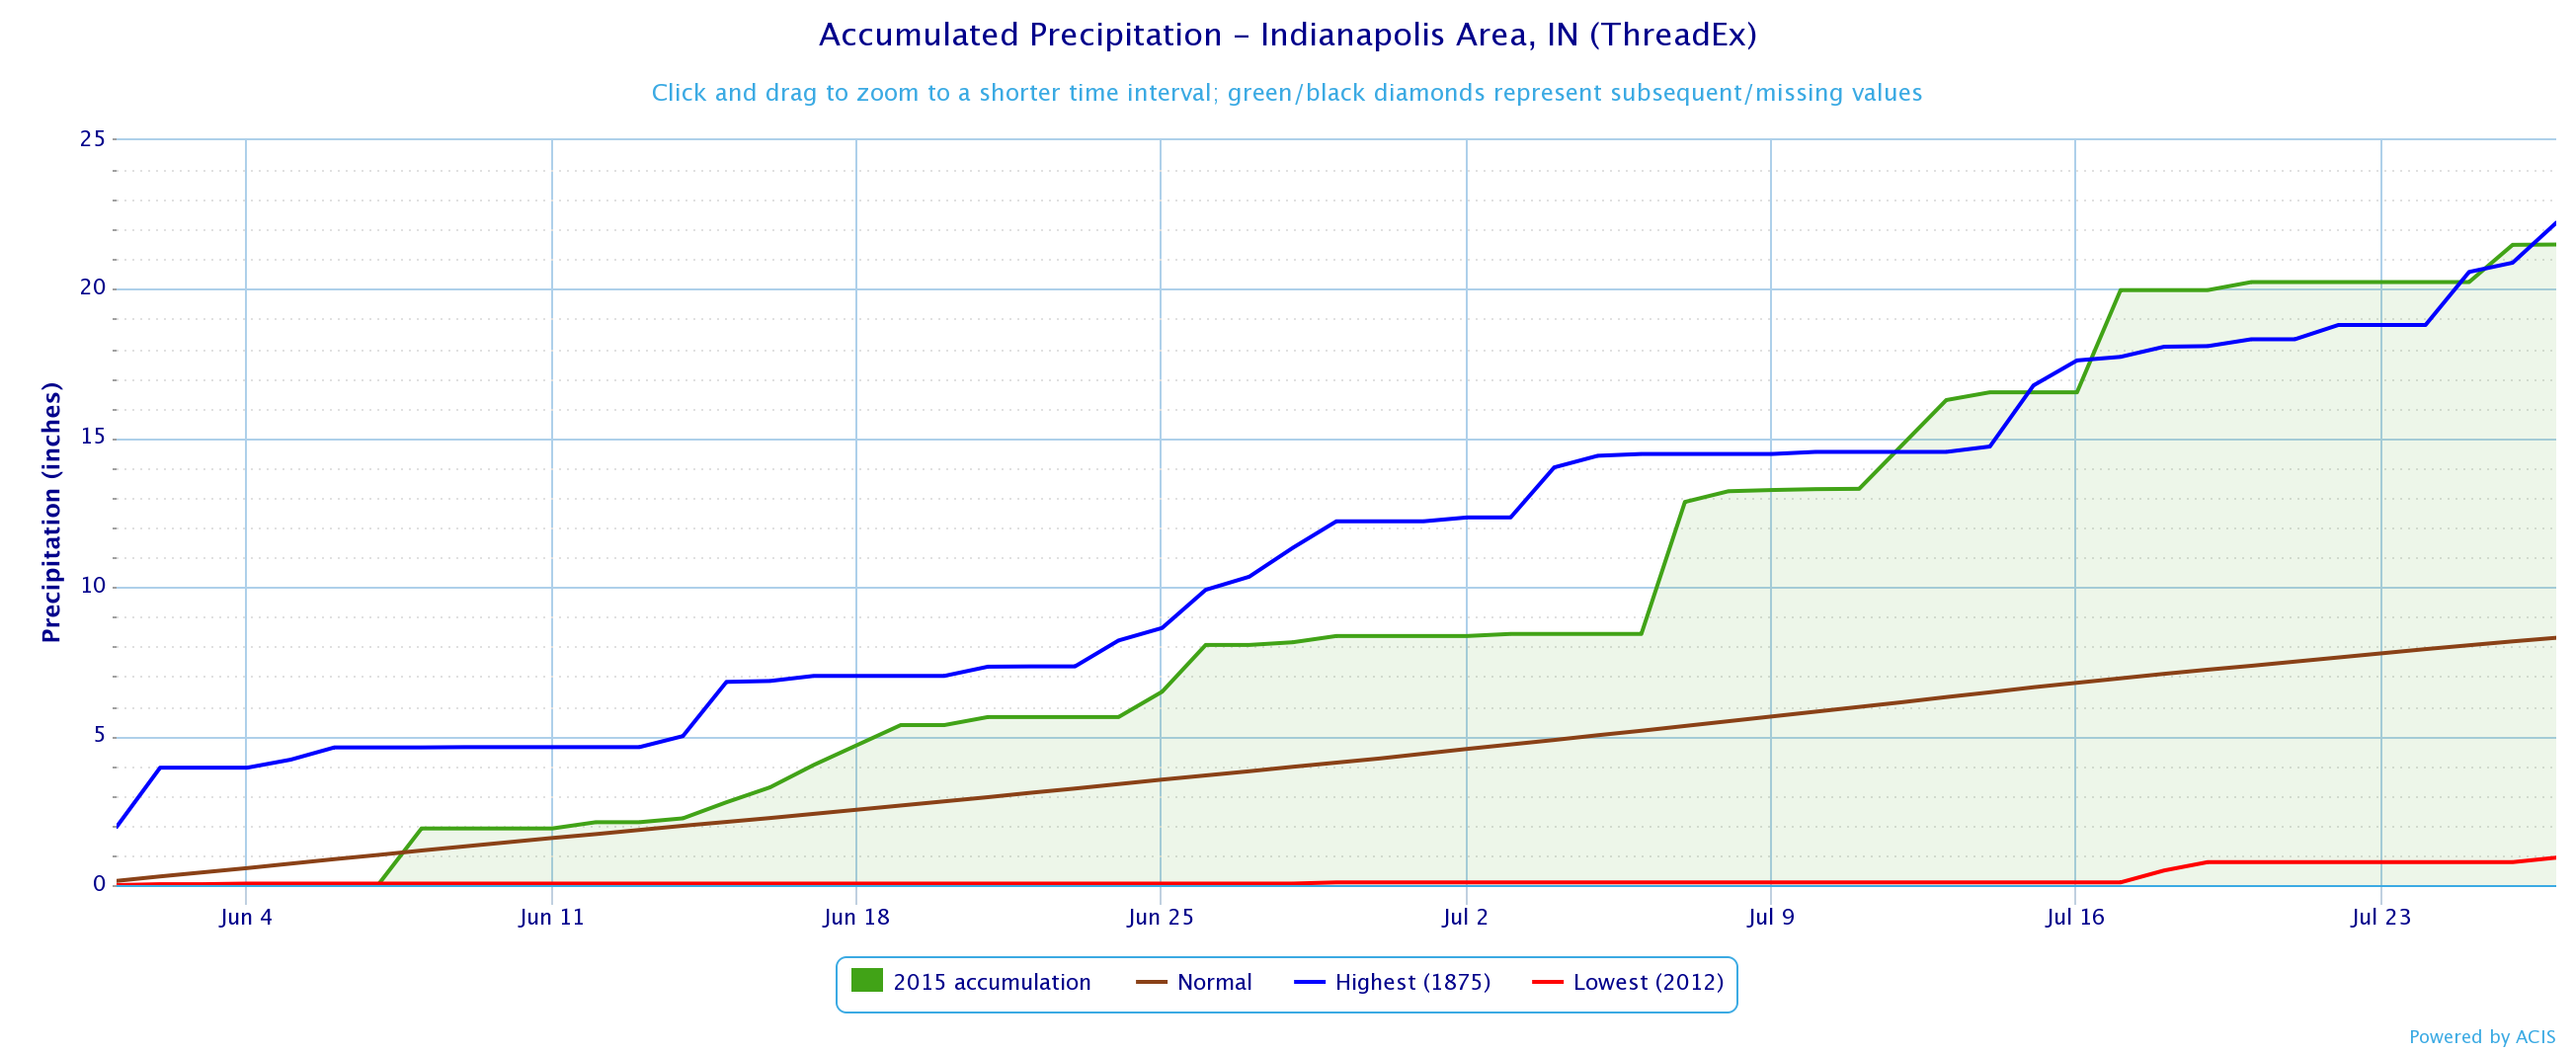
Graph of Rainfall at Indianapolis from June 1-July 27. Click for a full size version.
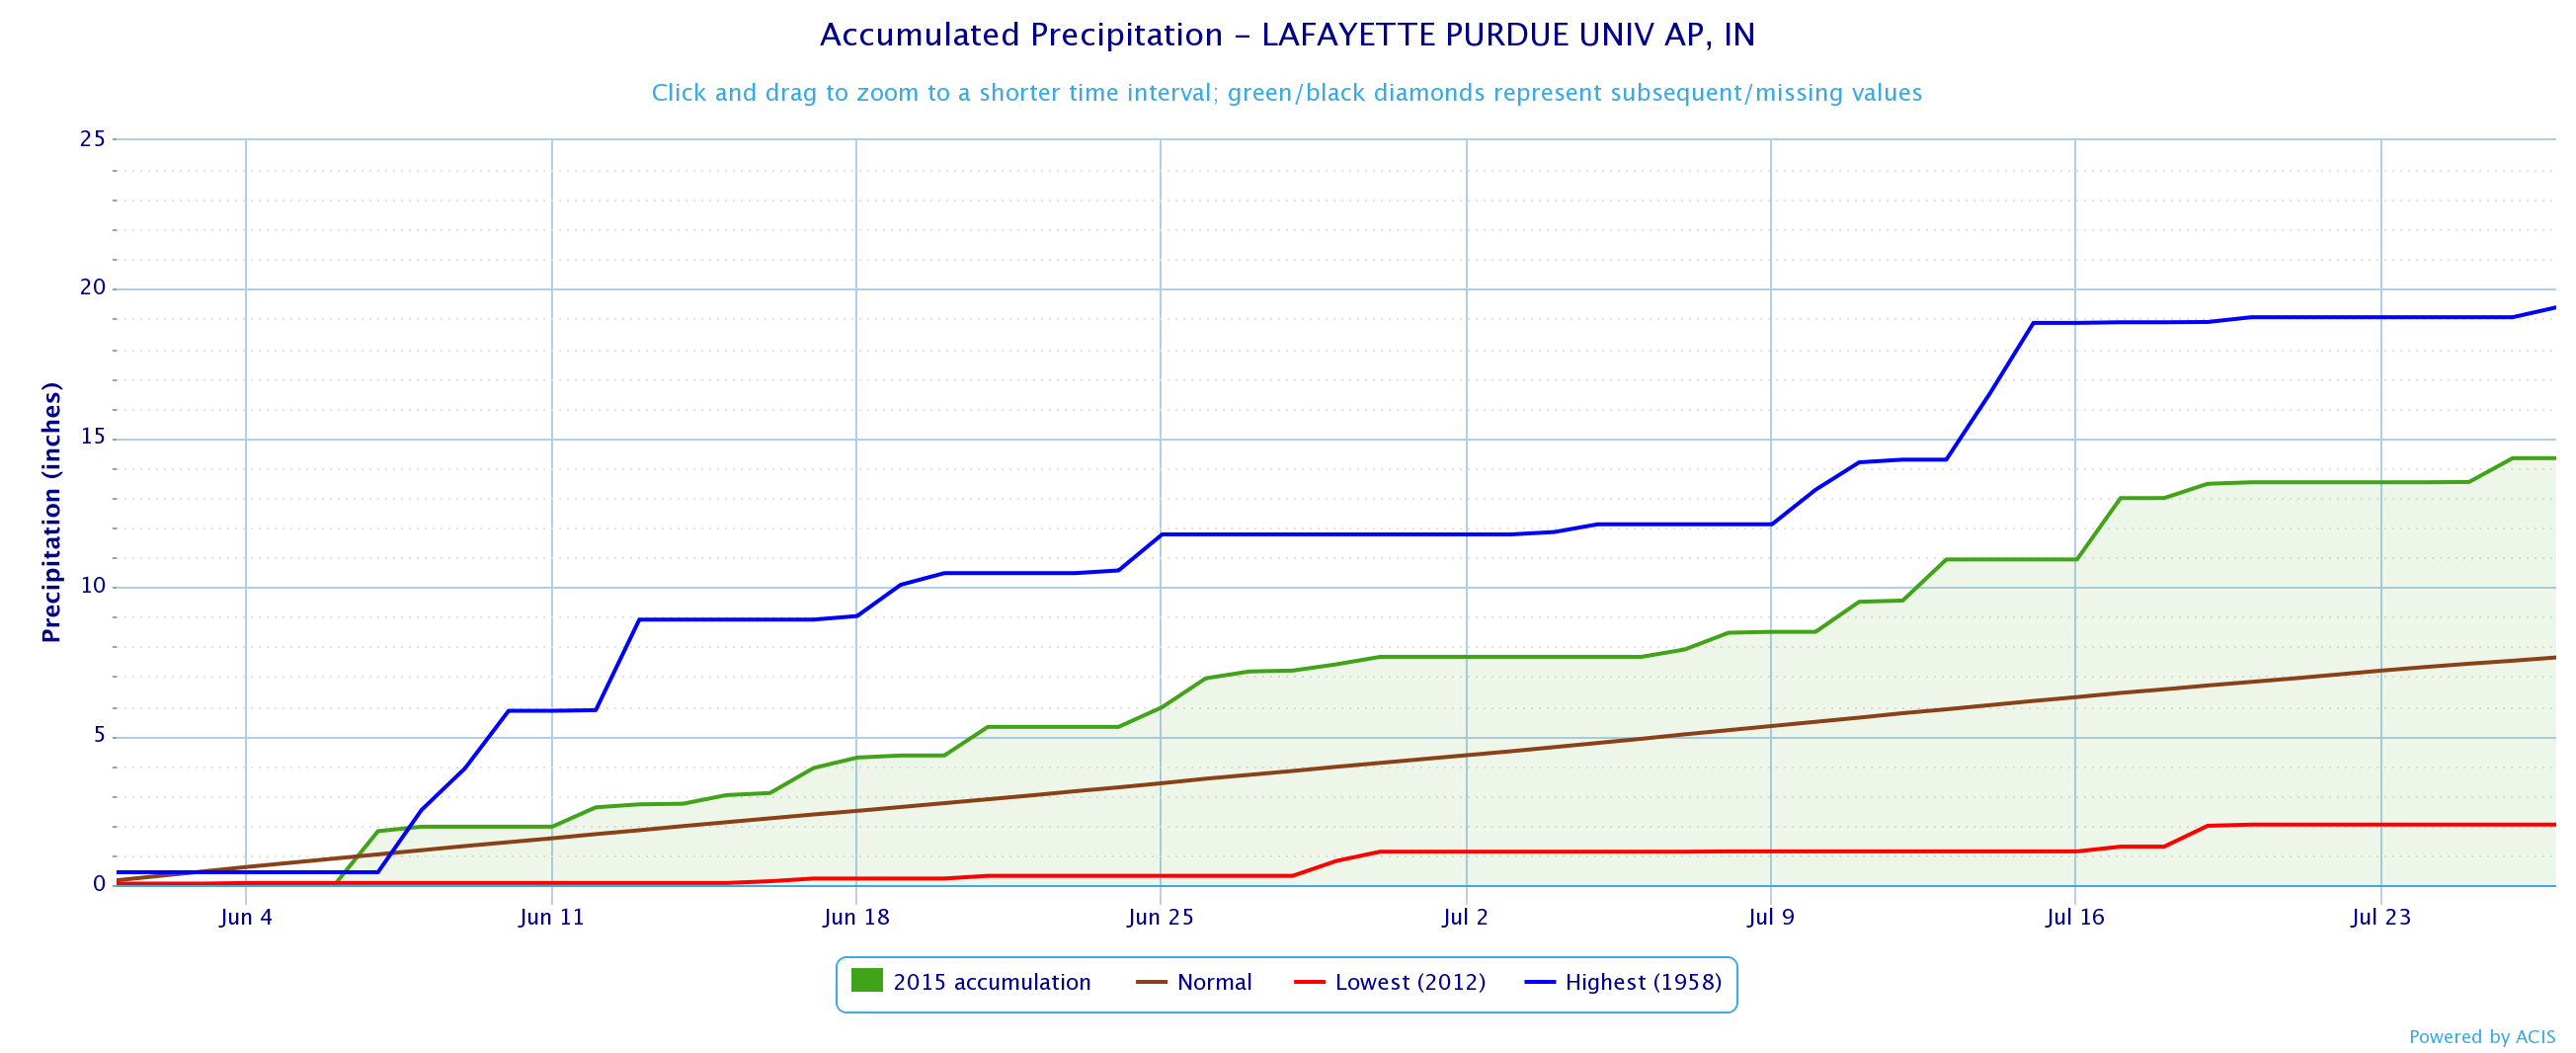
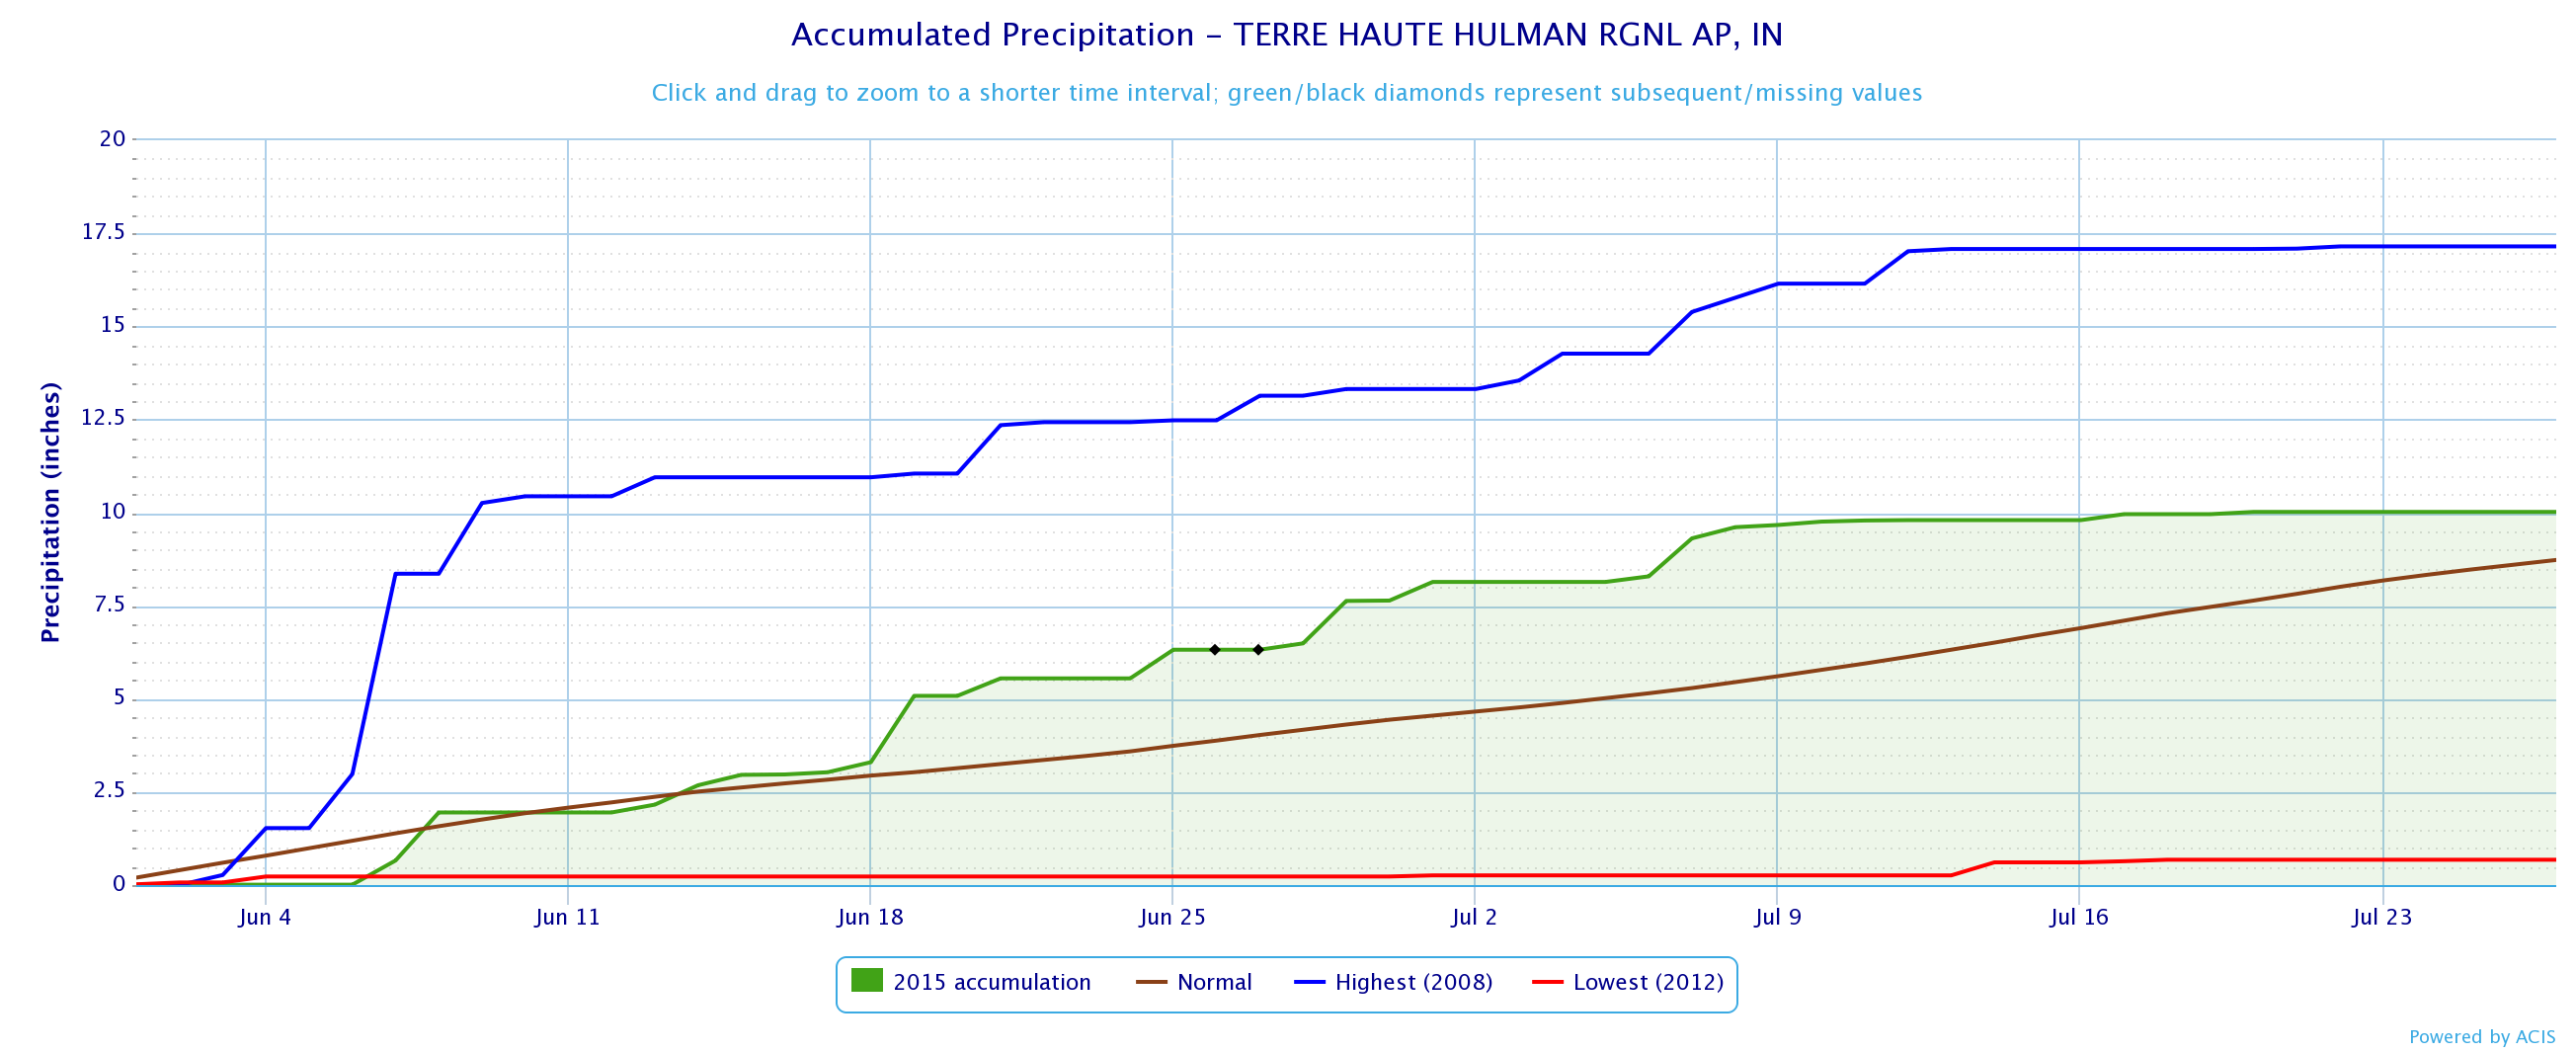
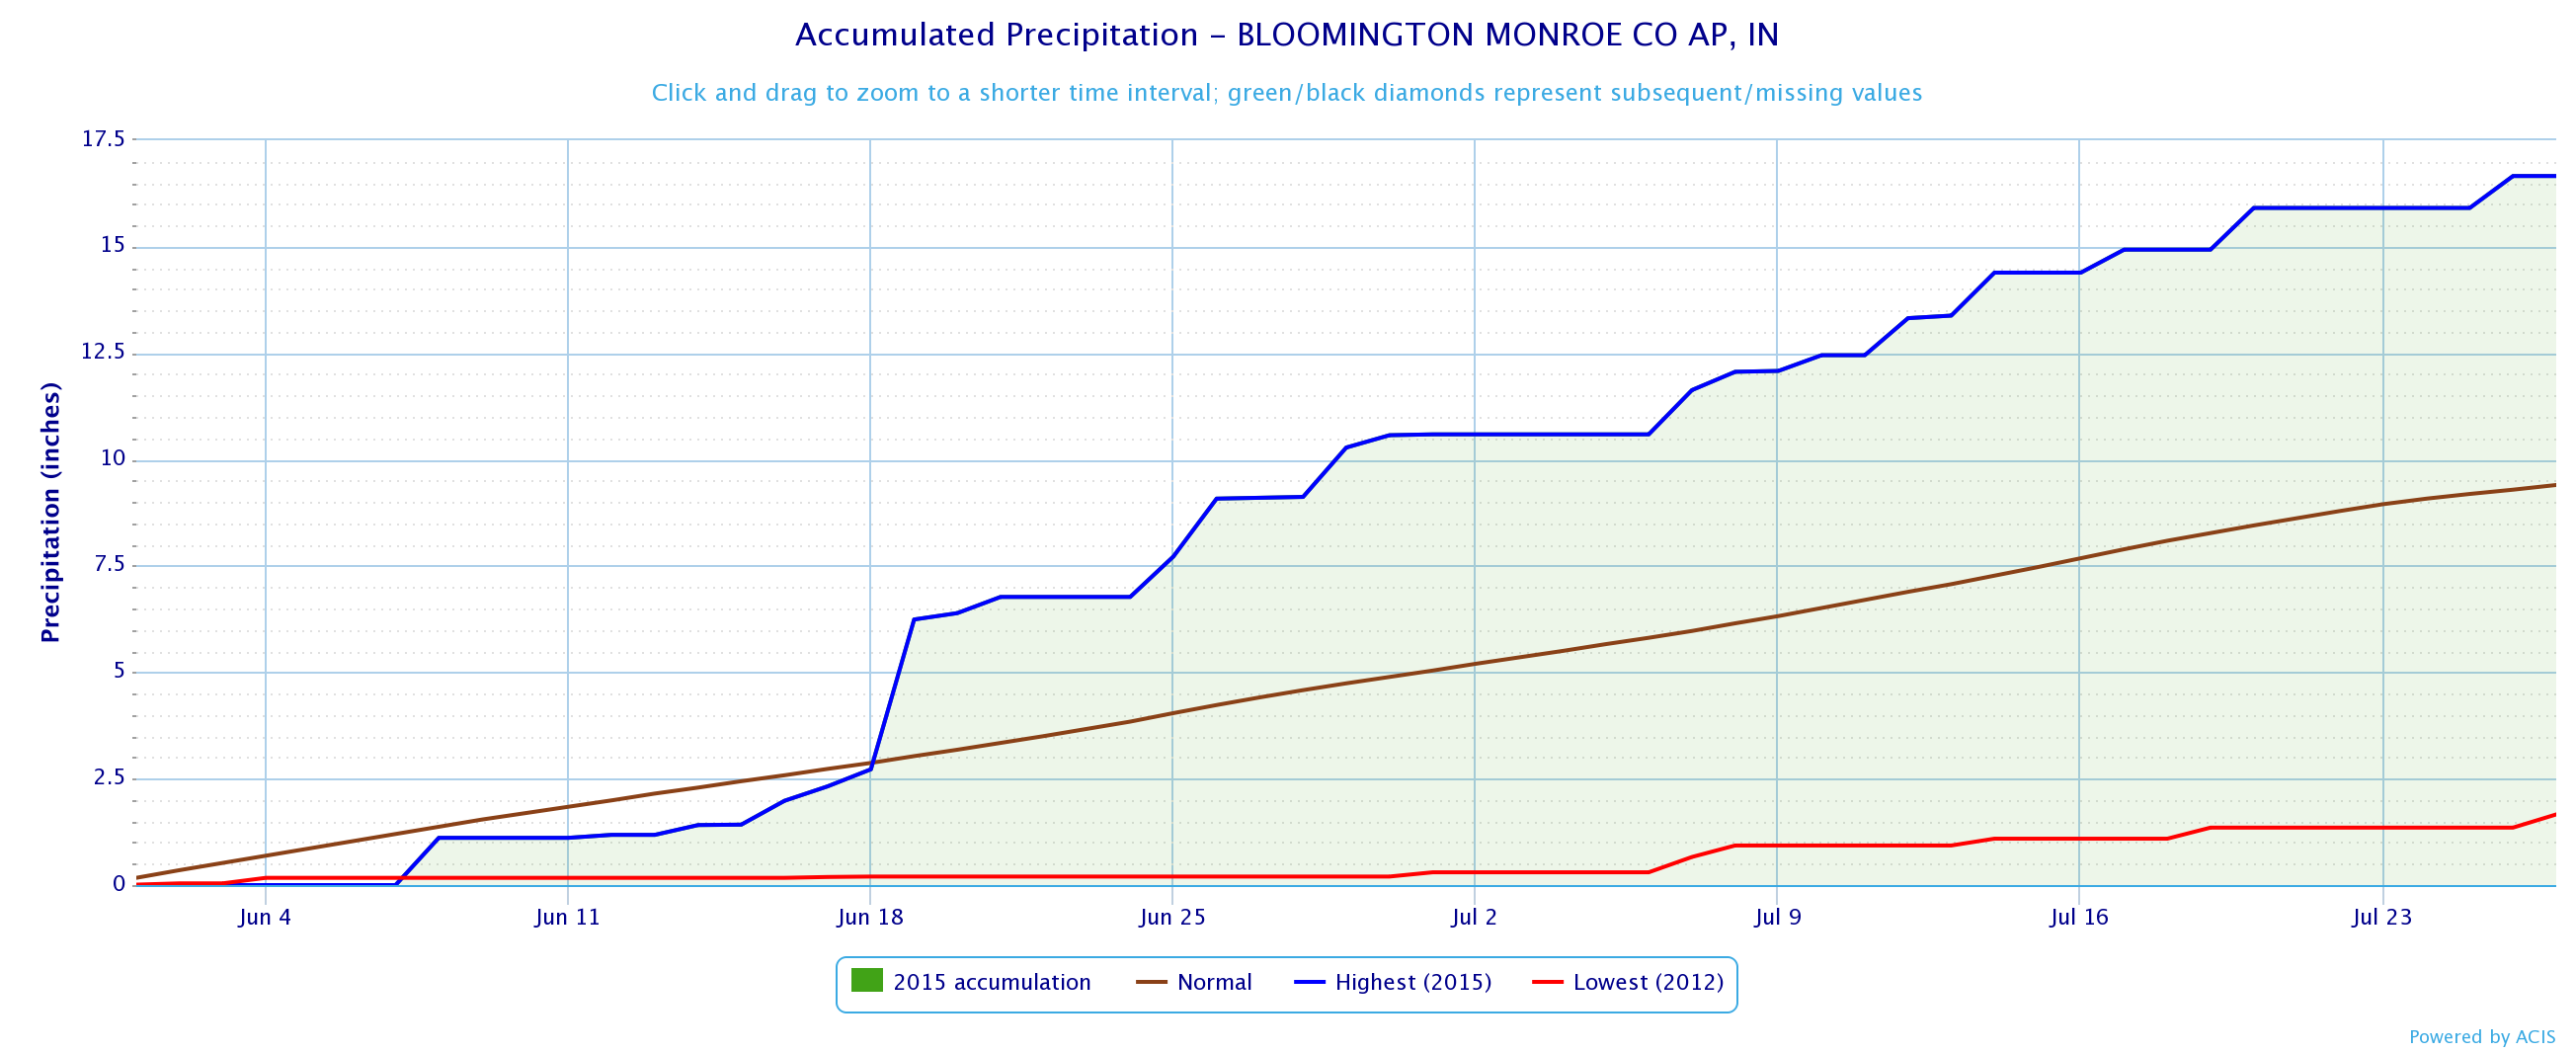
Other cities' rainfall maps for June 1 - July 27:
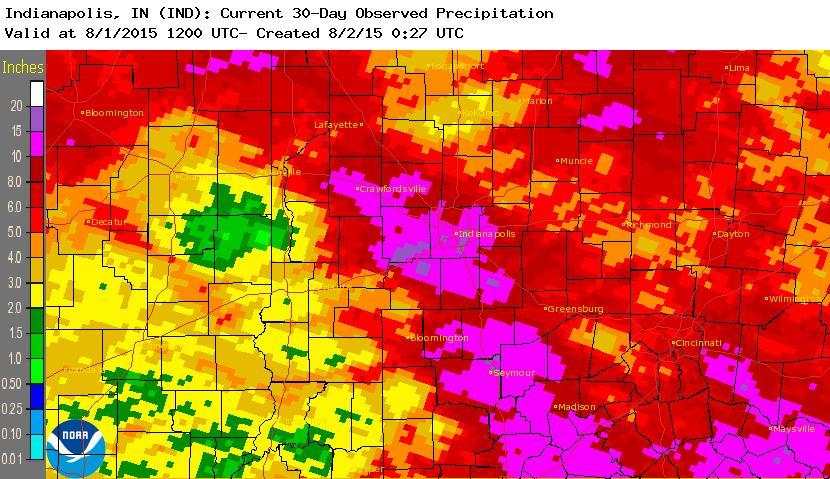
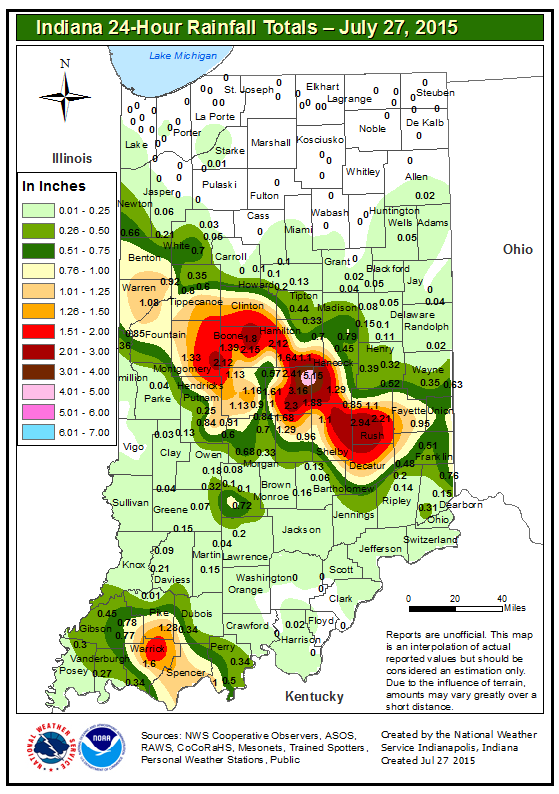
30 Day Map: The map below shows rainfall for July 2 through July 31.
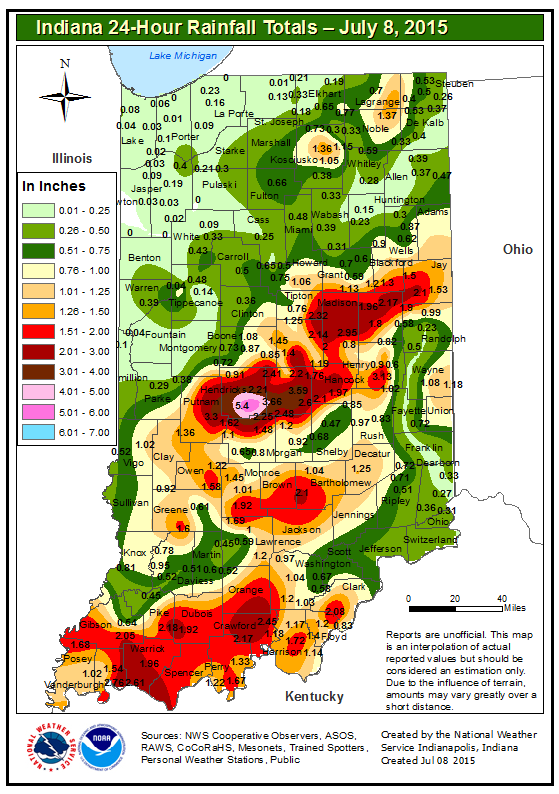
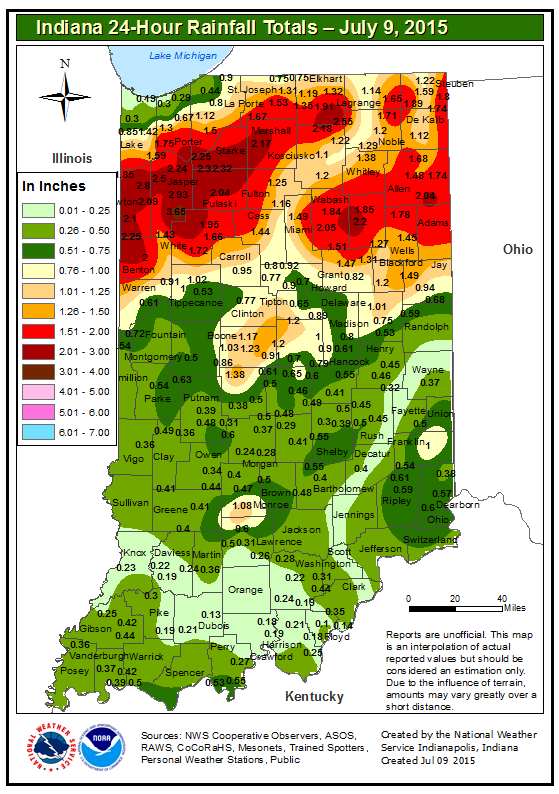
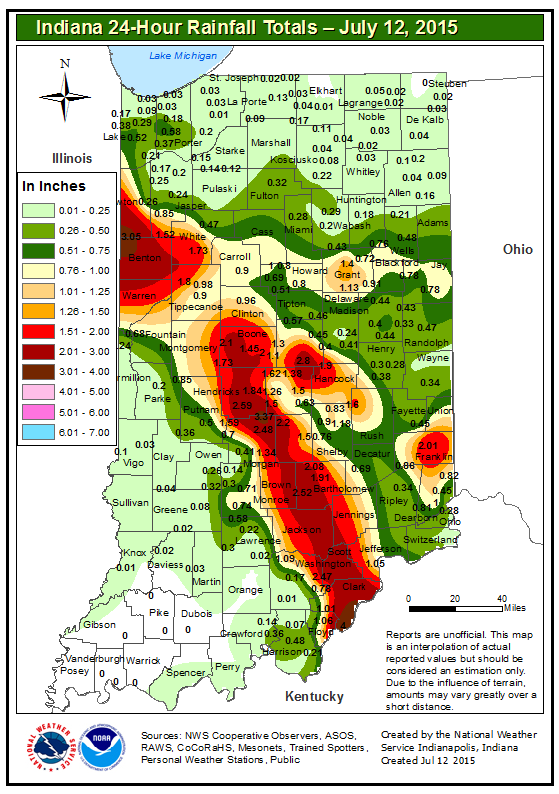
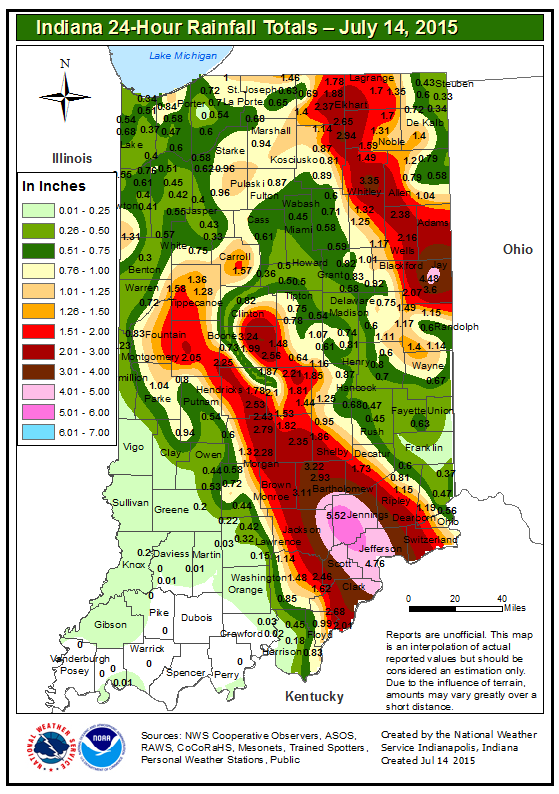
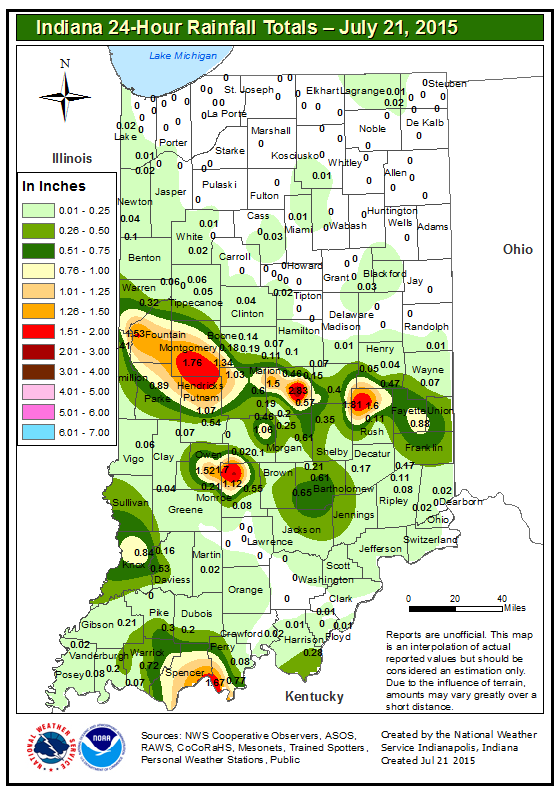
Below are some maps of days which had significant rainfall. The period is for the 24 hours ending approximately at 8:00 AM on the date of the map. Click any map for a larger version.
 |
 |
 |
 |
 |
 |
 |
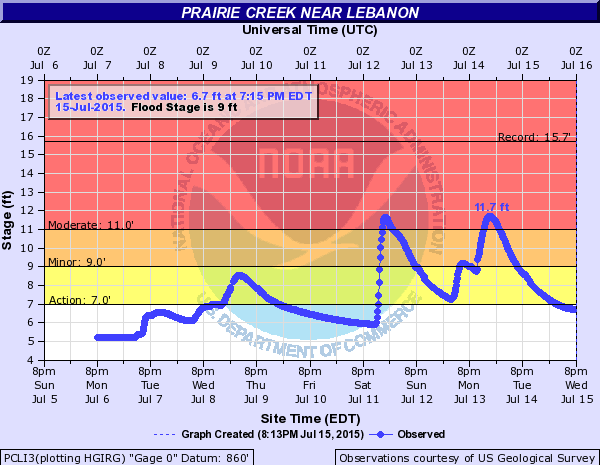
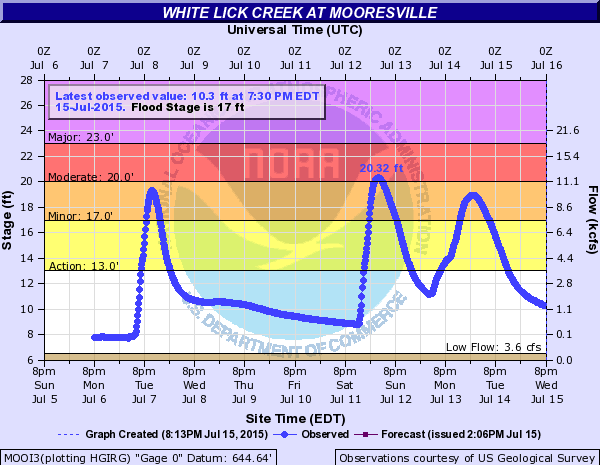
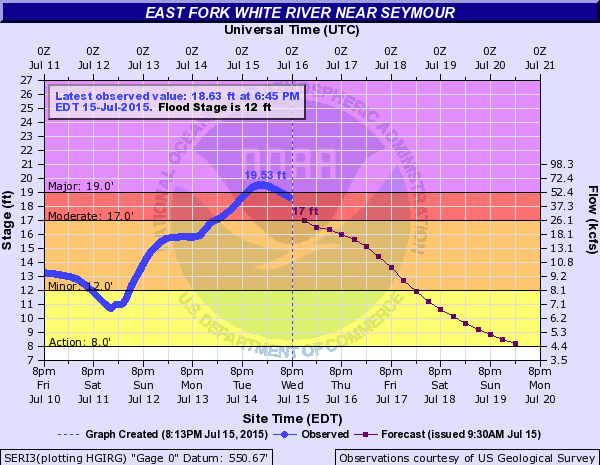
Below are selected plots of river levels. The plots were captured on the evening of July 15.
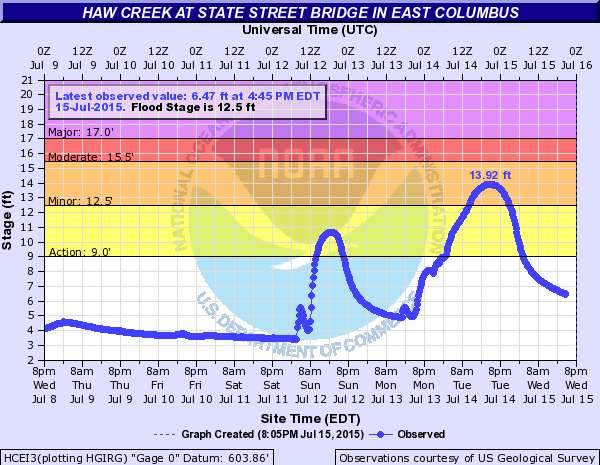
Picture of Haw Creek taken on July 14
Hazards
Outdoor Event Watcher
Hazardous Weather Outlook
Drought Information
NOAA All Hazards Radio
Graphical Hazards Outlook
Spotter Information
Local forecasts
Local Area
Aviation
Computer Model Forecasts
Fire Weather
Graphical
Precipitation
Air Quality
Text River Forecasts
Area Forecast Discussion
Central Indiana Weather Brief
US Dept of Commerce
National Oceanic and Atmospheric Administration
National Weather Service
Indianapolis, IN
6900 West Hanna Avenue
Indianapolis, IN 46241-9526
317-856-0664
Comments? Questions? Please Contact Us.

