| Previous Month | Next Month |
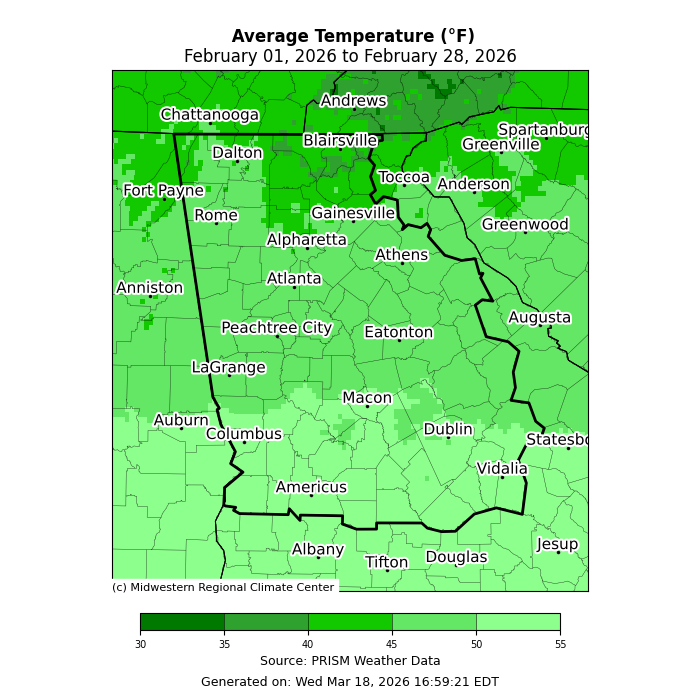
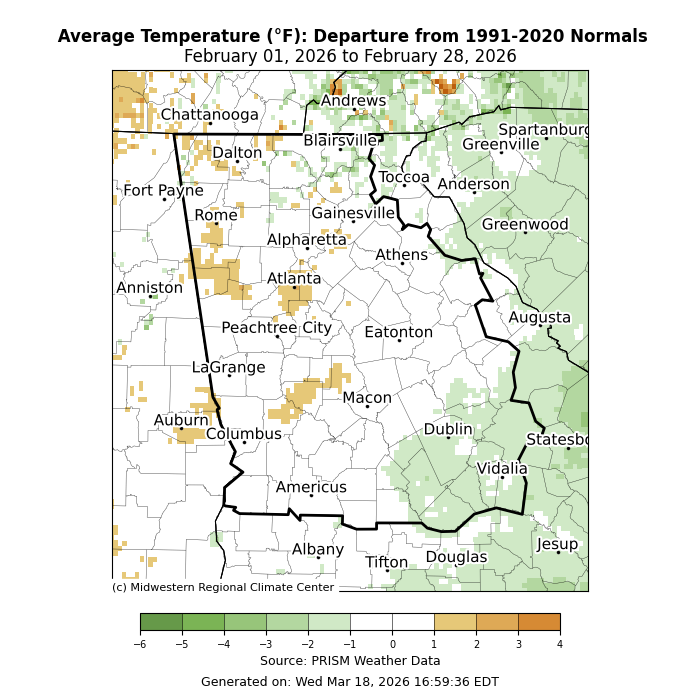
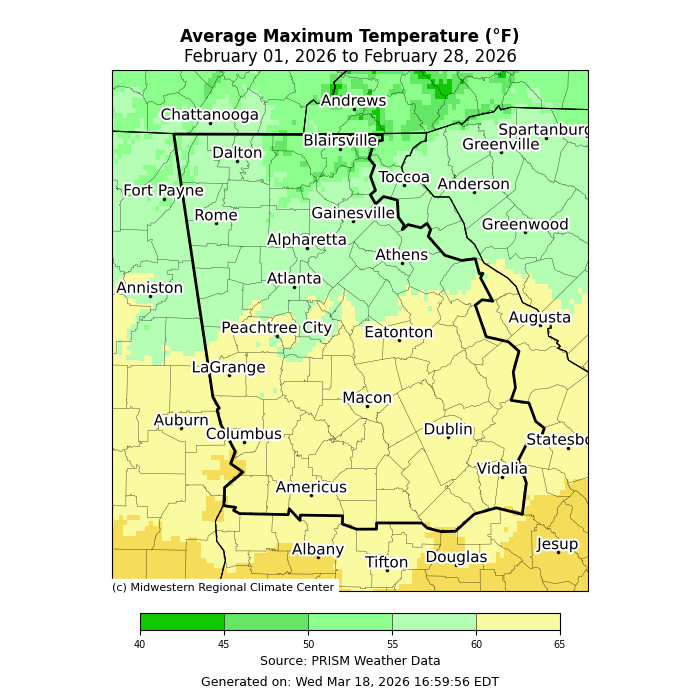
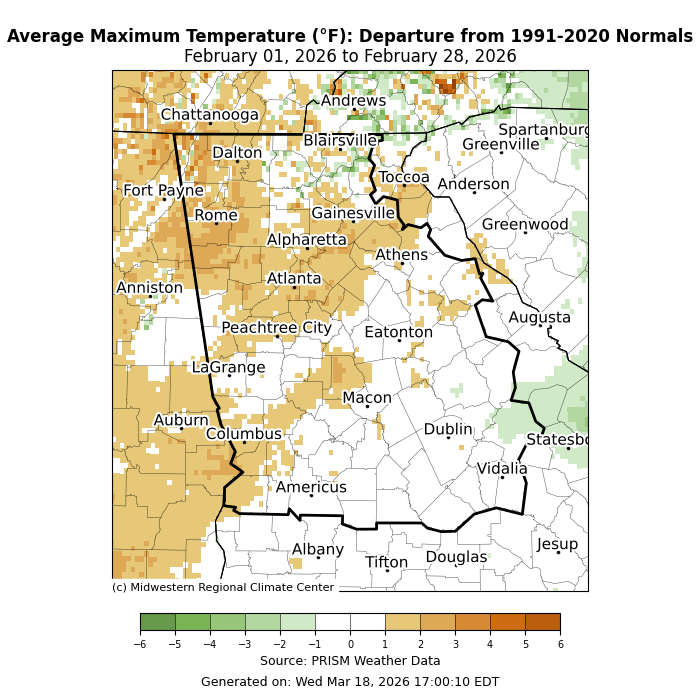
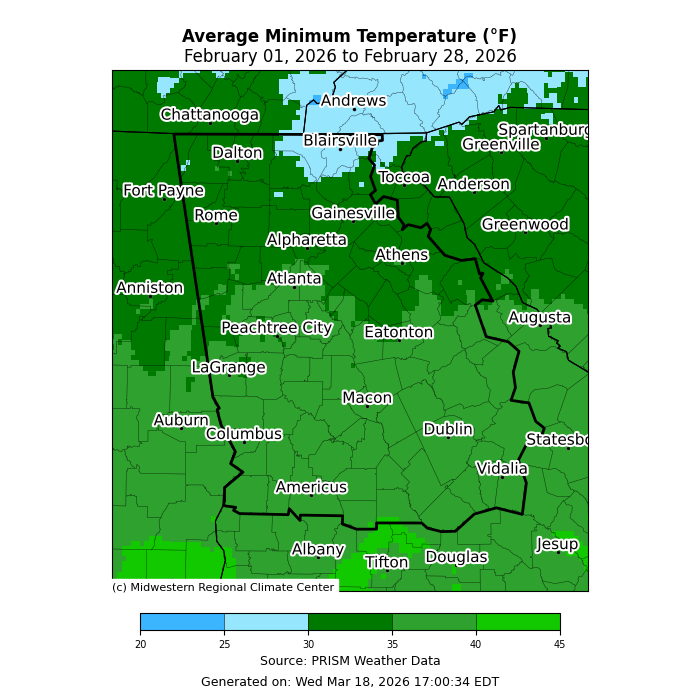
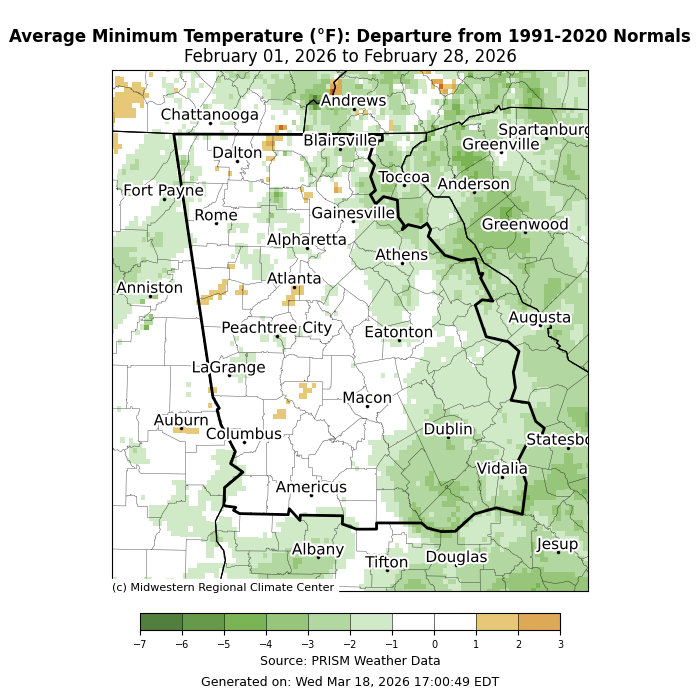
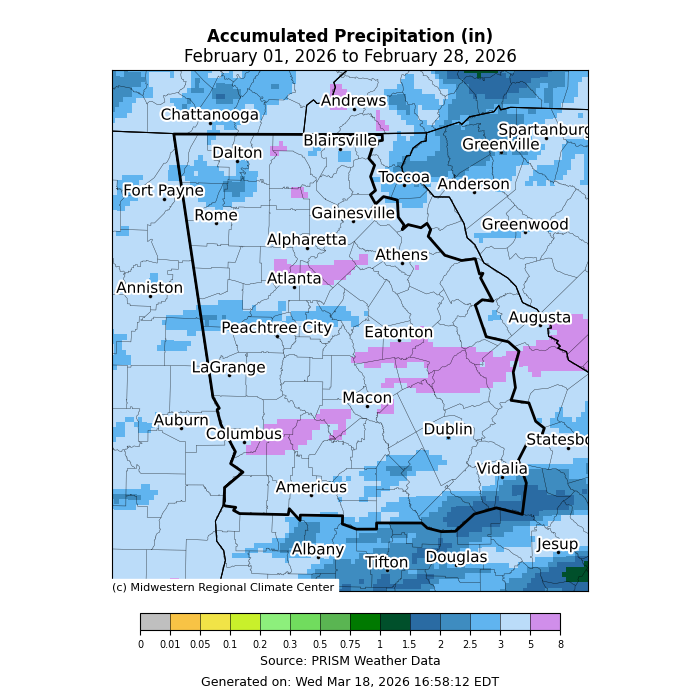
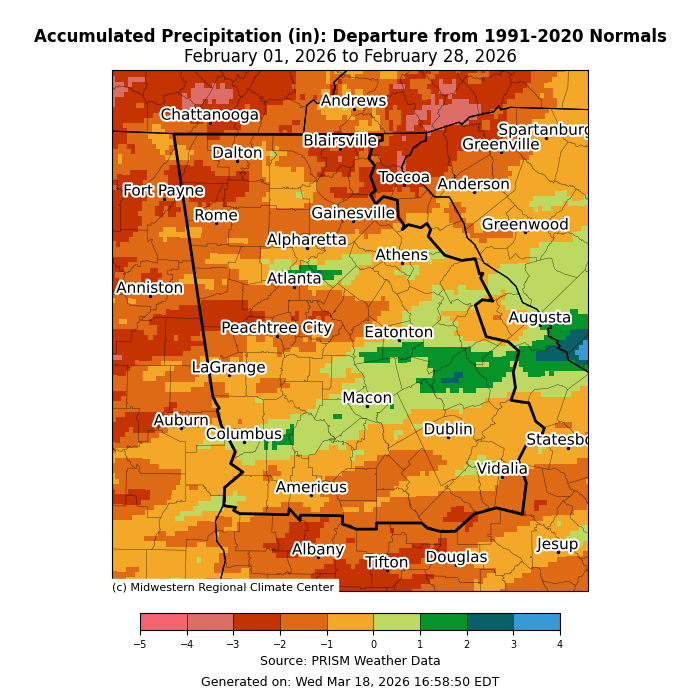
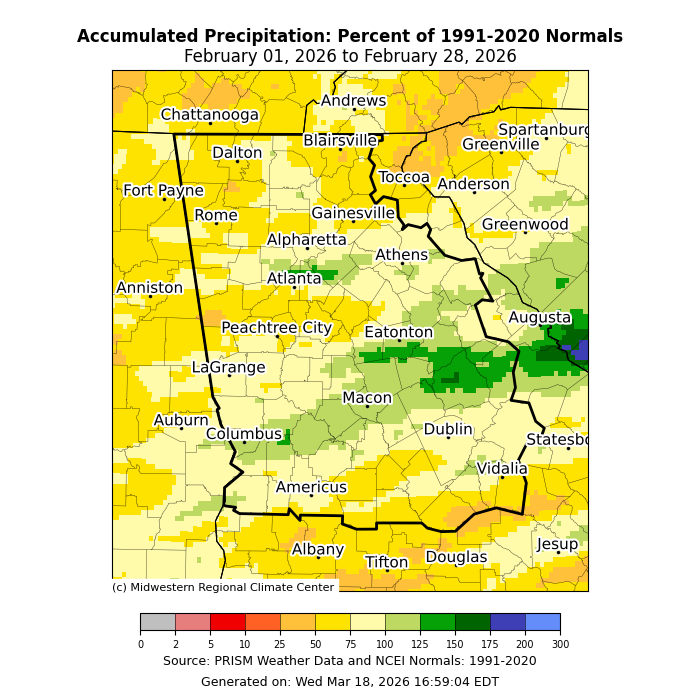
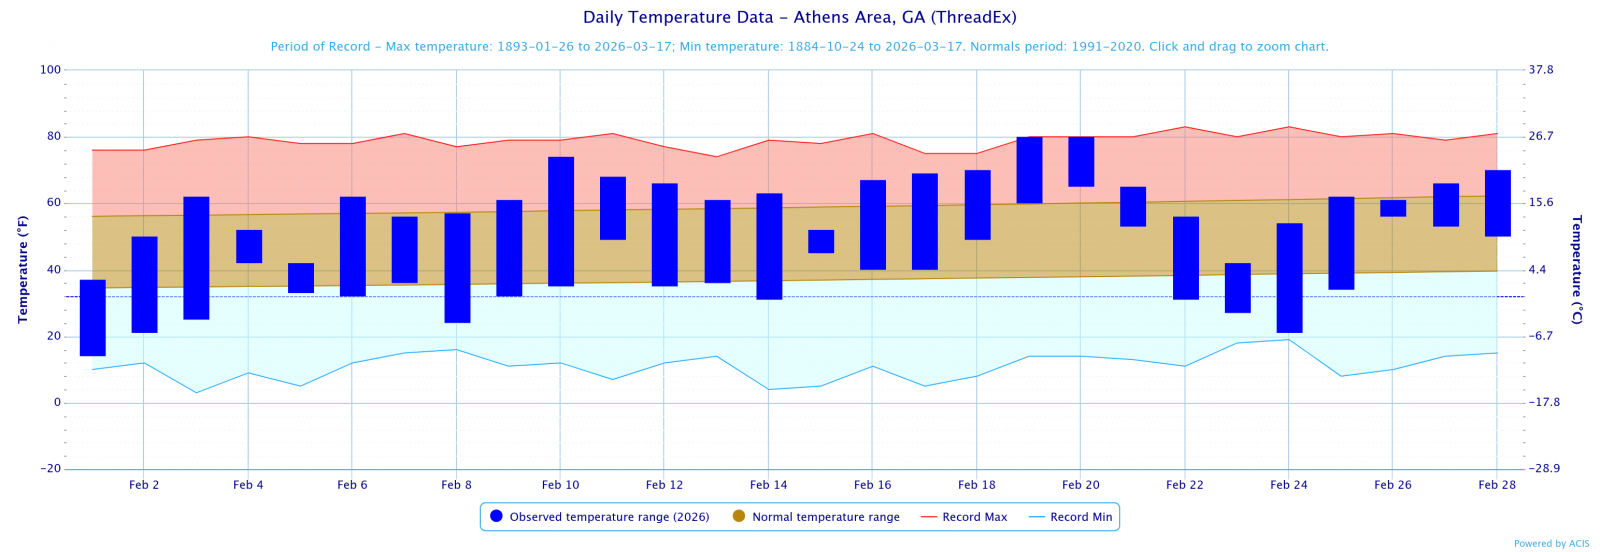
Temperatures through the month of February were two degrees above normal. Precipitation through the month of February was an inch below normal.
Climate Site Maximum Temperature Max T Date Climate Site Total Precipitation DFN (Departure Climate Site Maximum Daily Precip (in inches) Max P Date Data prepared by NWS Peachtree City/Atlanta Based on the Climate Prediction Center's outlook for March, Georgia has an 40% to 50% chance of seeing above normal temperatures. For precipitation, Georgia has an equal chance of above or below normal precipitation.
Overview
Climate Graphs
Records
Events
March Outlook
February 2026 Climate Averages
Climate Site
February Temp (°F)
Average Temp
Departure from normal
Athens
49.5
48.0
1.5
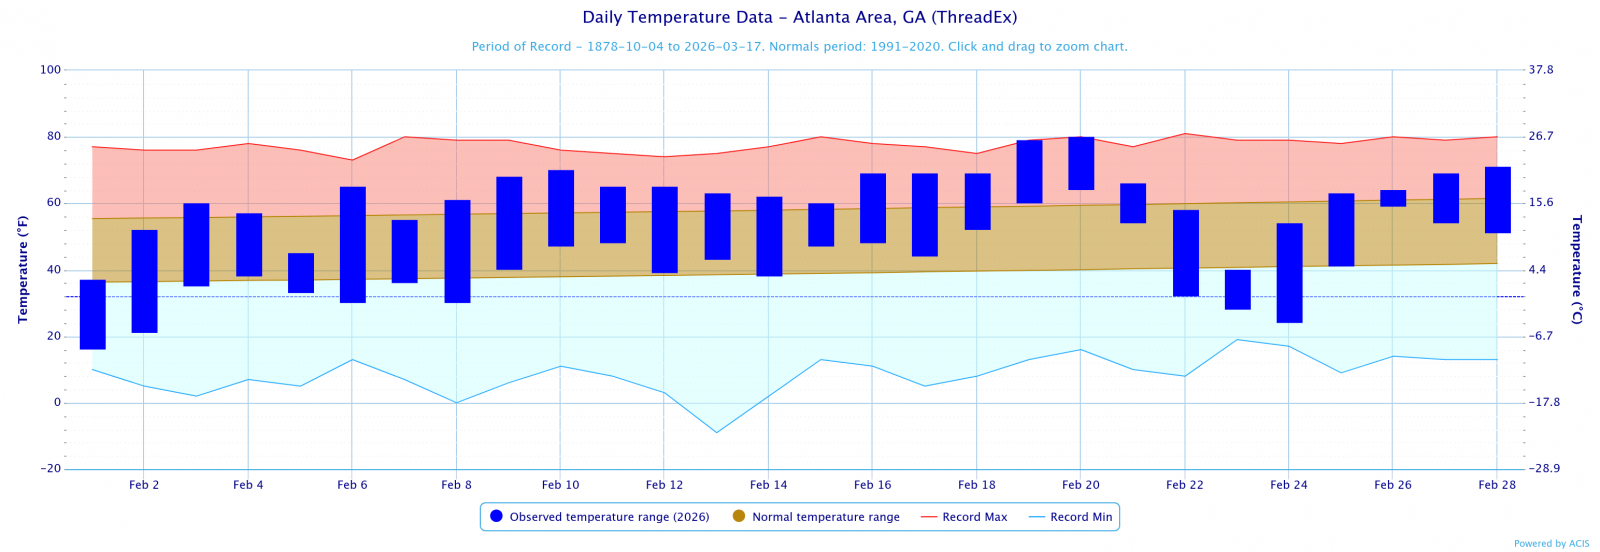
Atlanta
51.6
48.5
3.1
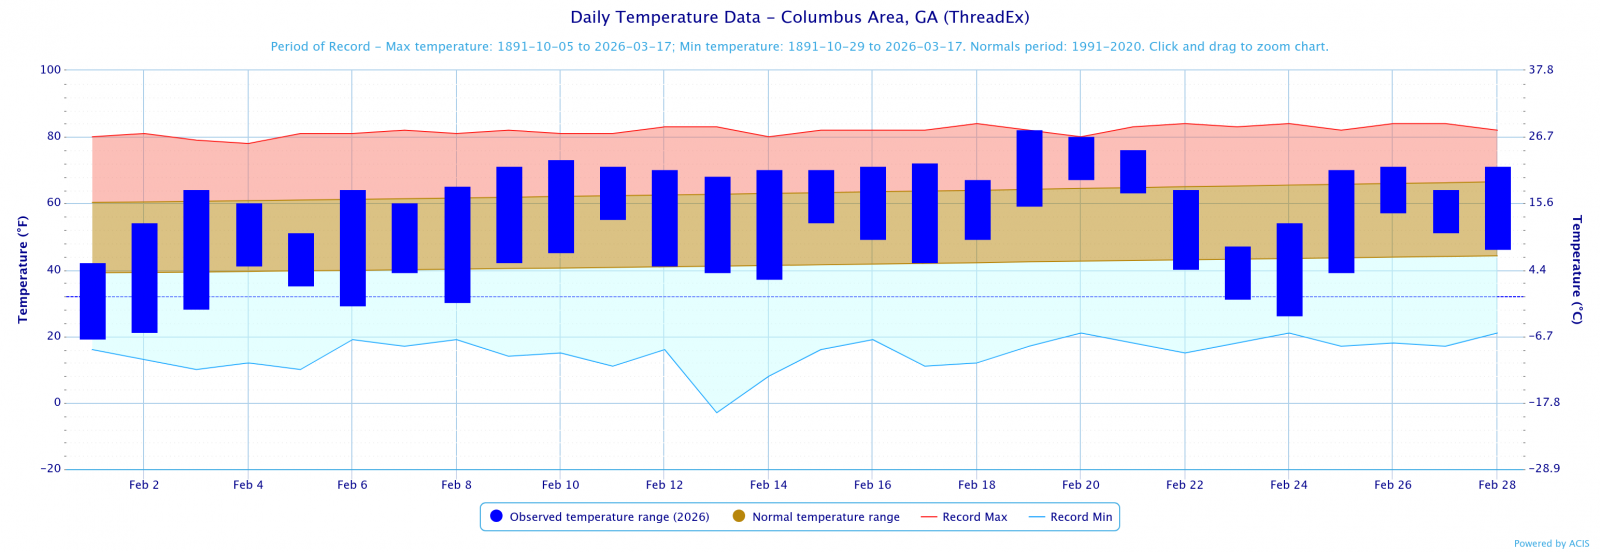
Columbus
53.9
52.3
1.6
Macon
51.8
51.2
0.6
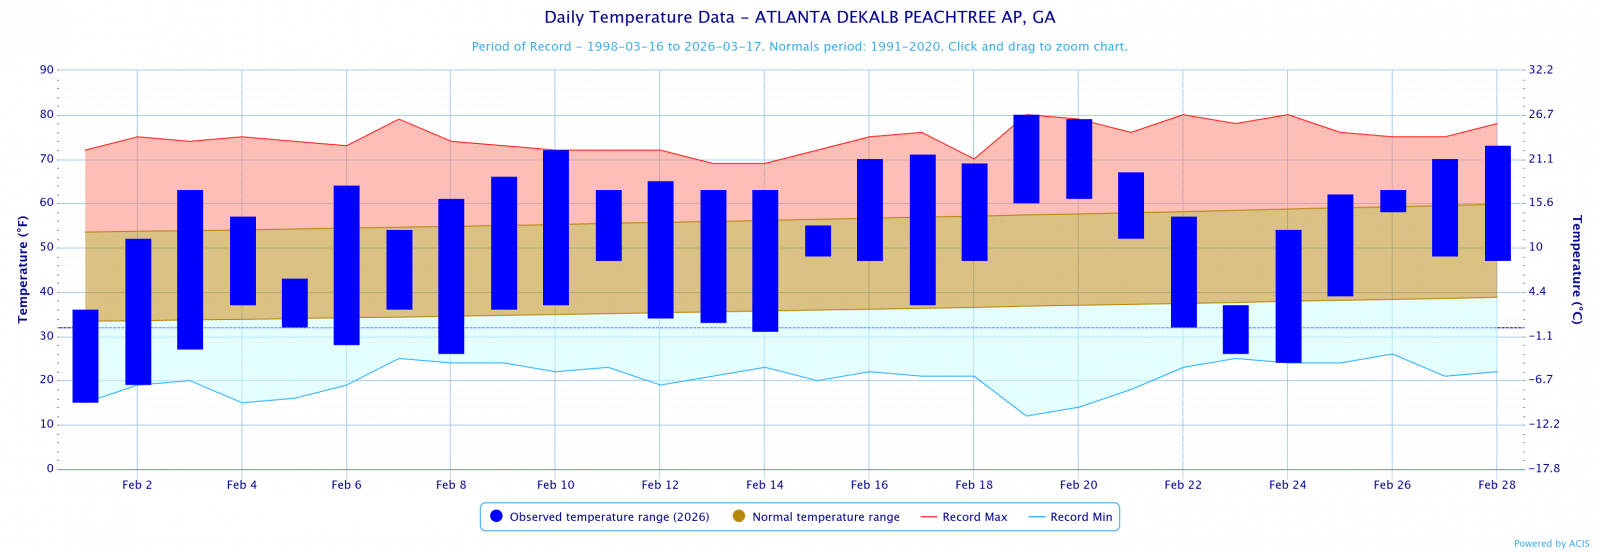
Dekalb Peachtree Arpt
49.9
46.1
3.8
Fulton Co Arpt
49.1
47.5
1.6
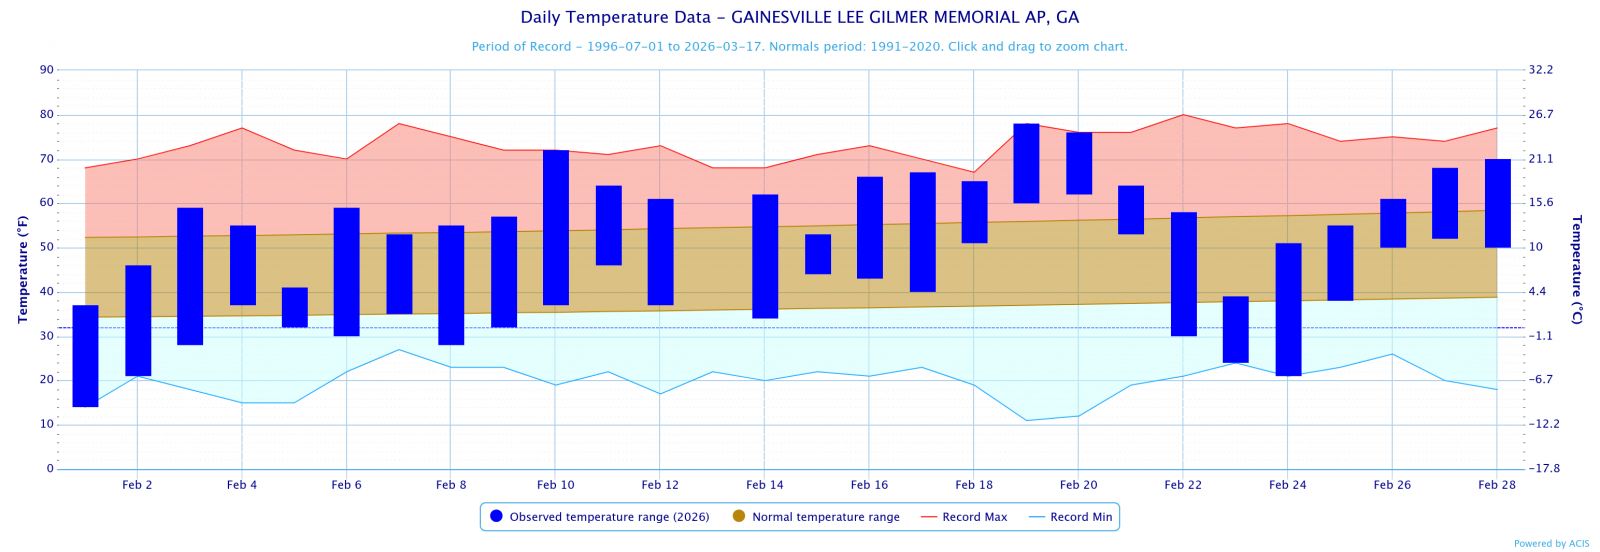
Gainesville
48.5
45.7
2.8
Peachtree City
49.2
48.7
0.5
Rome
52.1
46.3
5.8
February 2026 Temperature Climate Statistics
Minimum Temperature
Min T Date
Athens
80
2/19, 20
14
2/1
Atlanta
80
2/20
16
2/1
Columbus
82
2/19
19
2/1
Macon
82
2/19
18
2/1
Dekalb Peachtree Arpt
80
2/19
15
2/1
Fulton Co Arpt
80
2/26
15
2/1
Gainesville
78
2/19
15
2/1
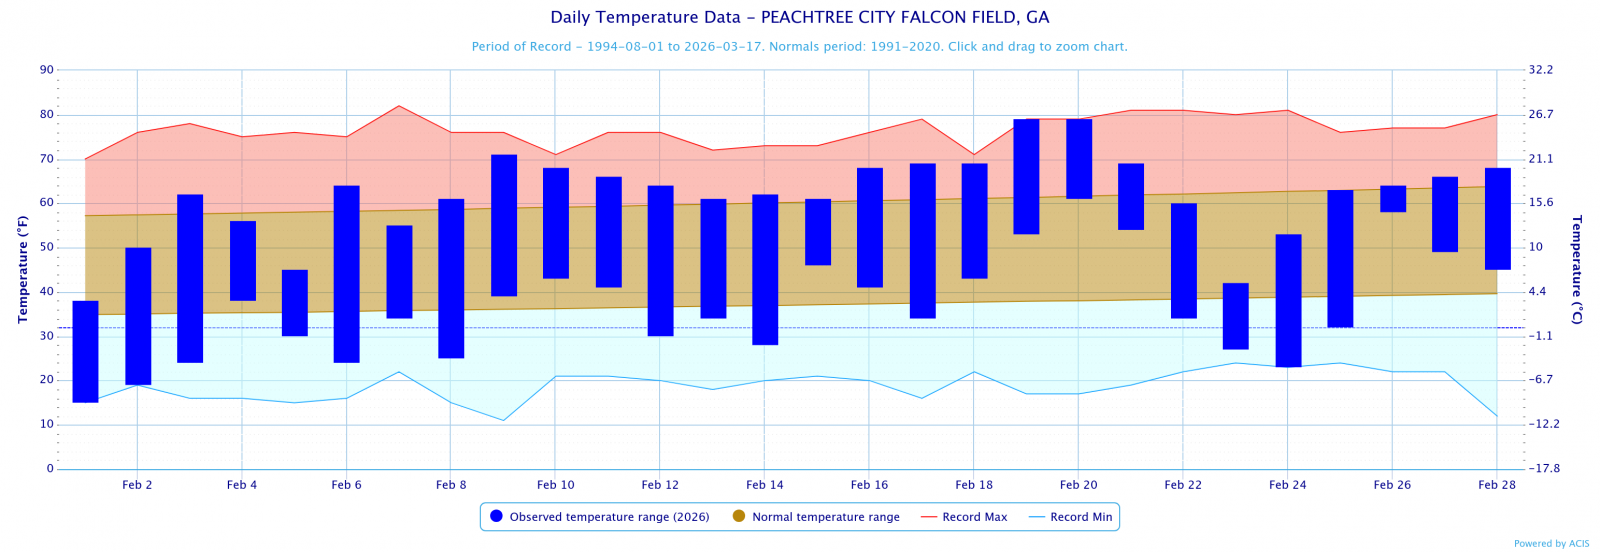
Peachtree City
79
2/19
15
2/1
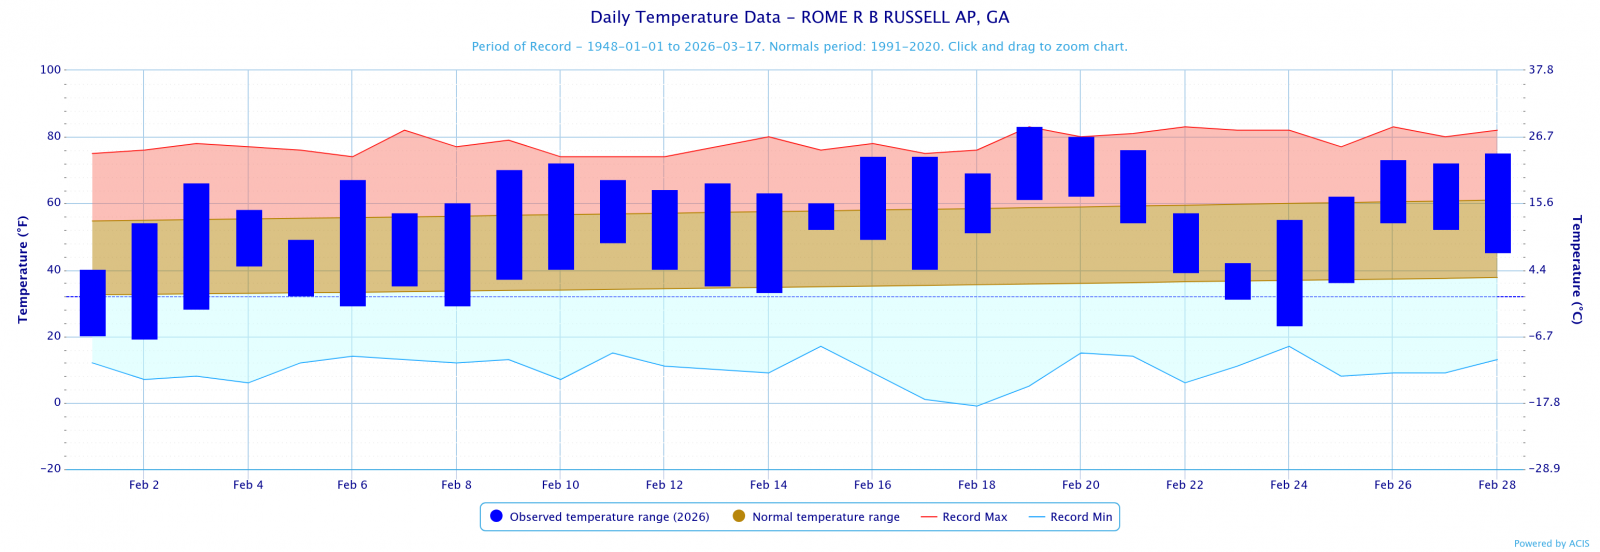
Rome
83
2/19
19
2/2
February 2026 Precipitation Climate Statistics
Average Precipitation
From Normal)
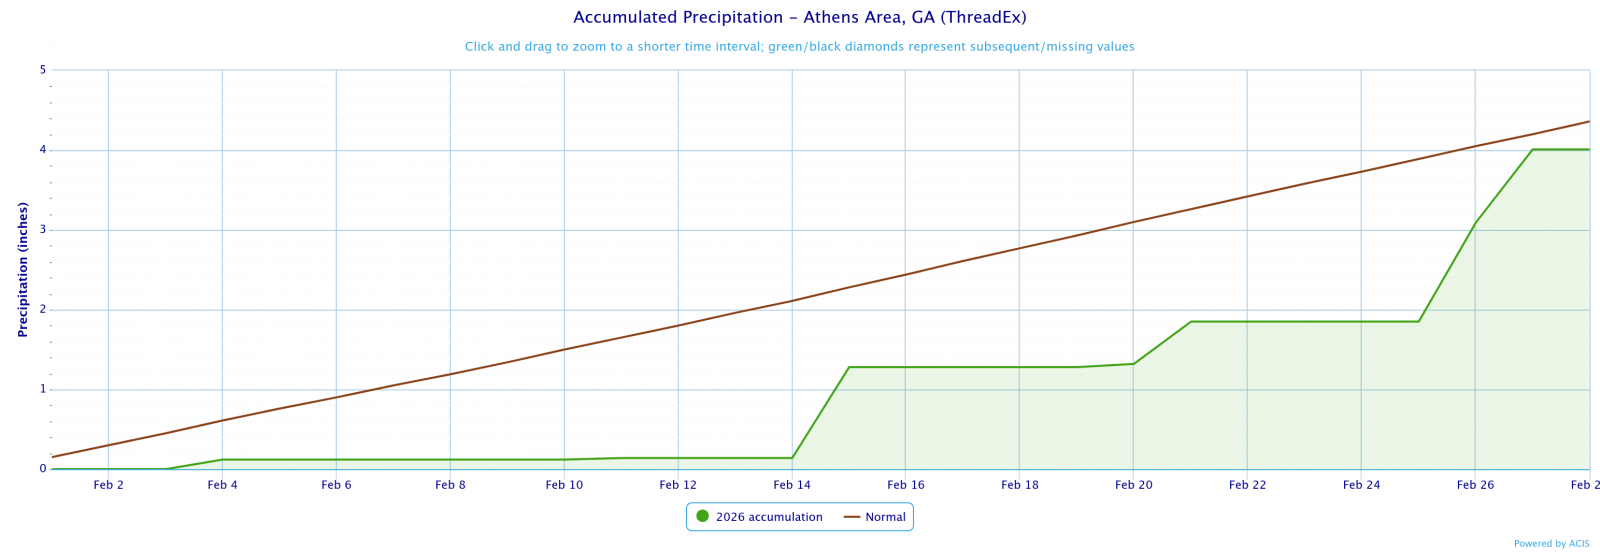
Athens
4.01
4.36
-0.35
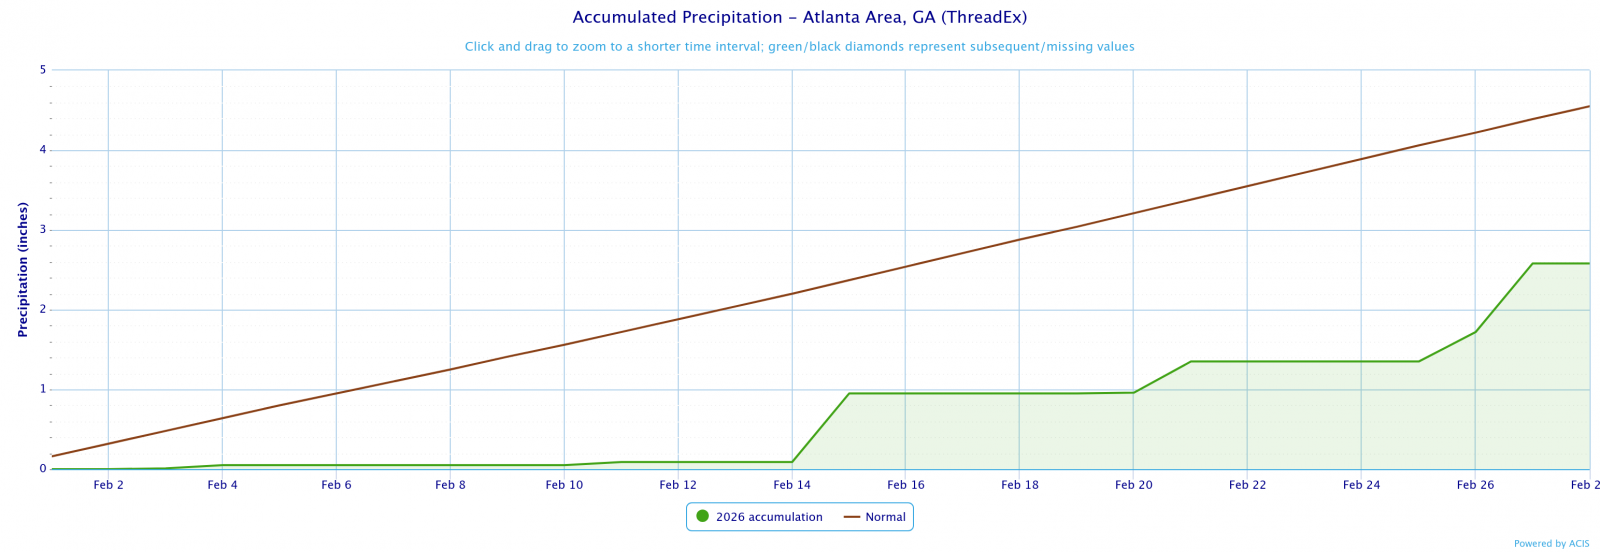
Atlanta
2.58
4.59
-2.01
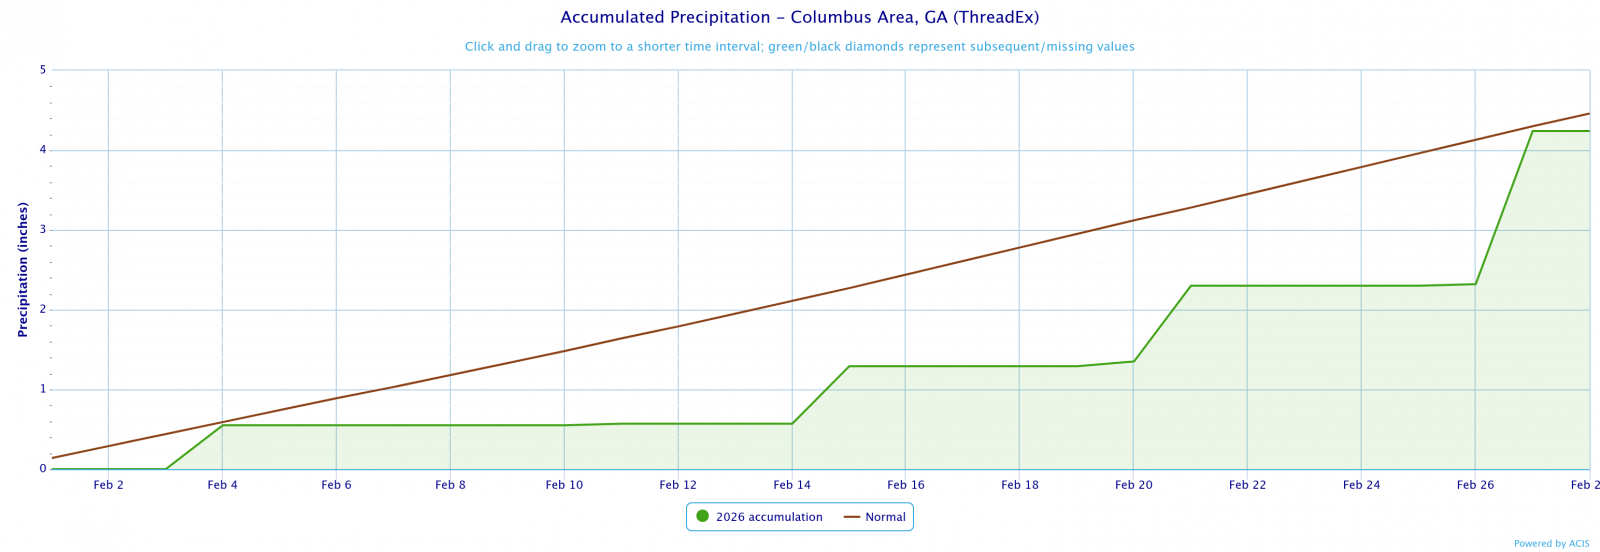
Columbus
4.24
4.24
0.00
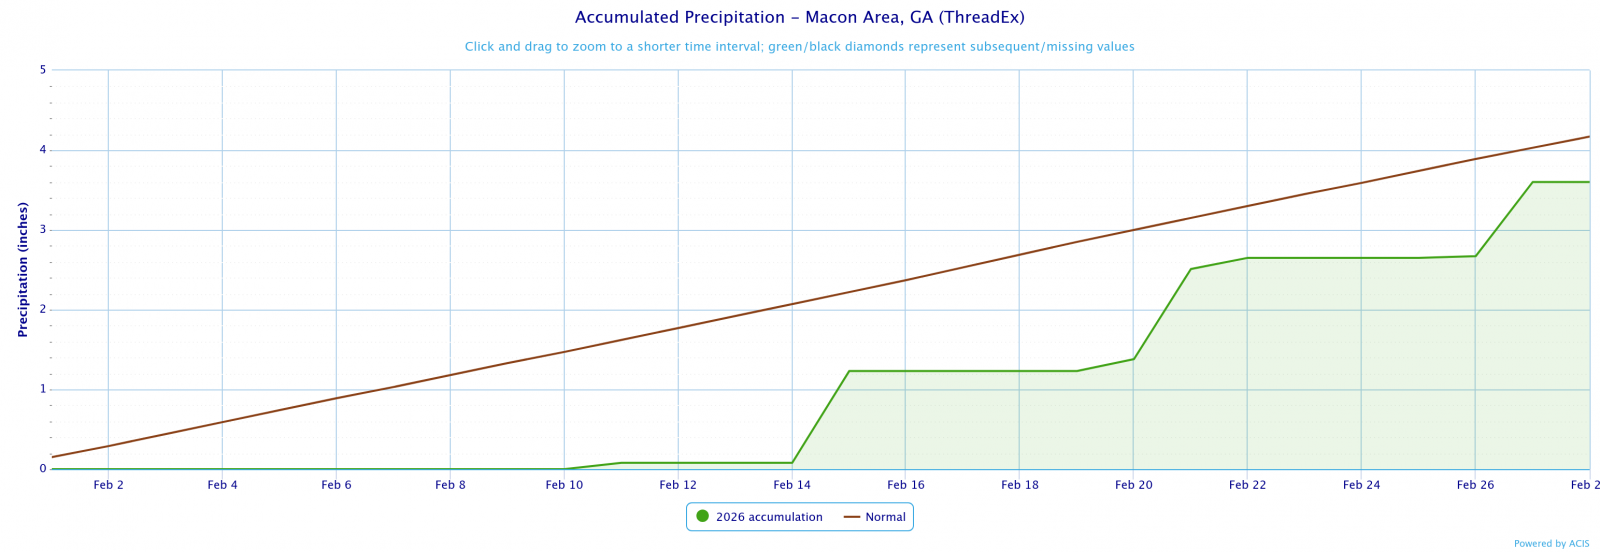
Macon
3.60
4.32
-0.72
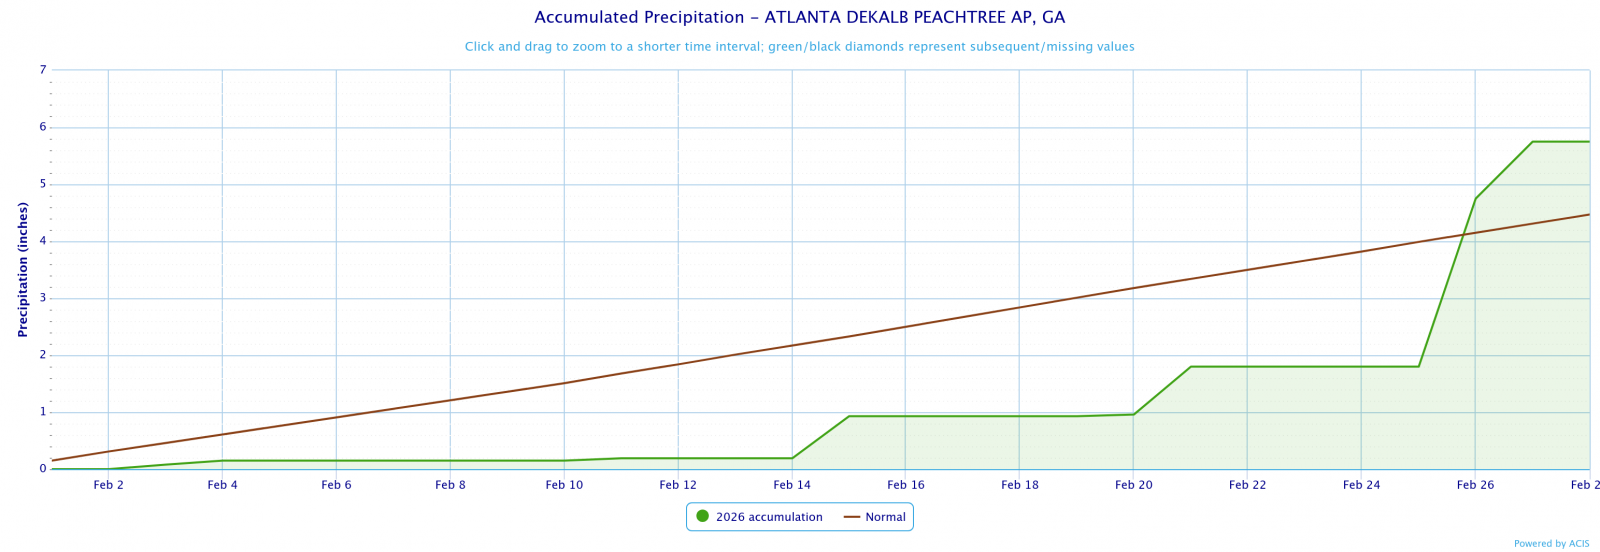
Dekalb Peachtree Arpt
5.75
4.57
1.18
Fulton County Arpt
3.14
4.25
-1.11
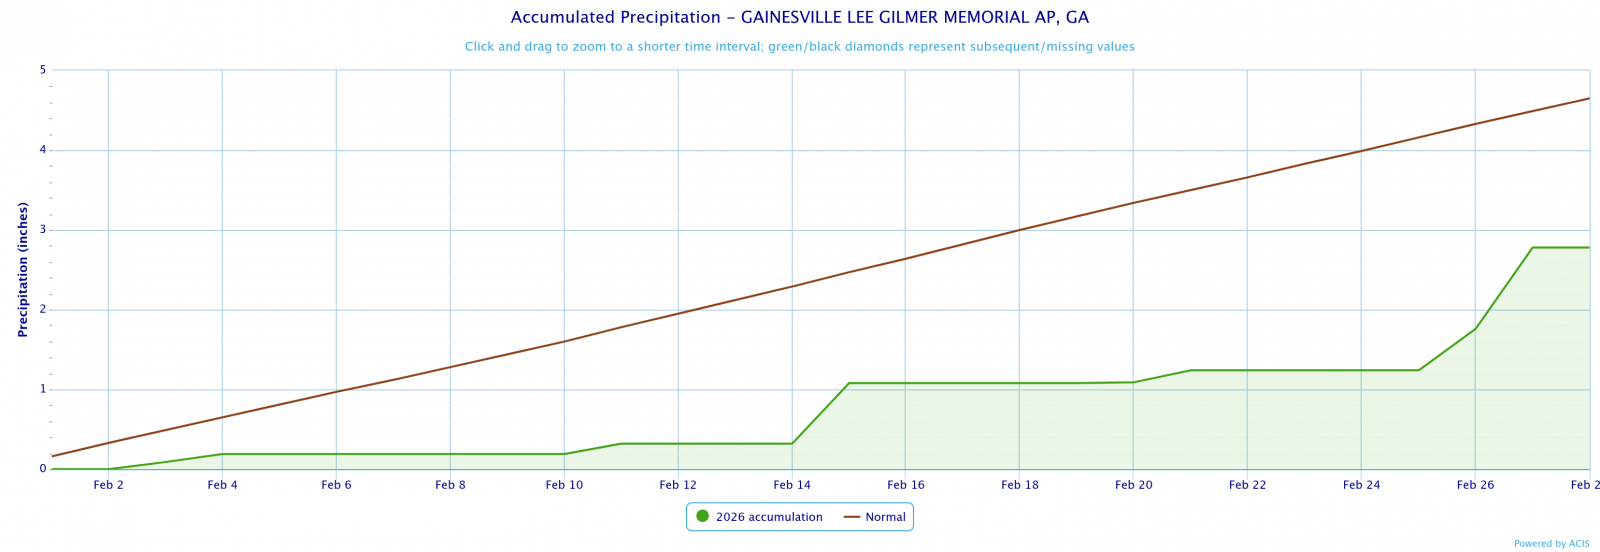
Gainesville
2.78
4.95
-2.17
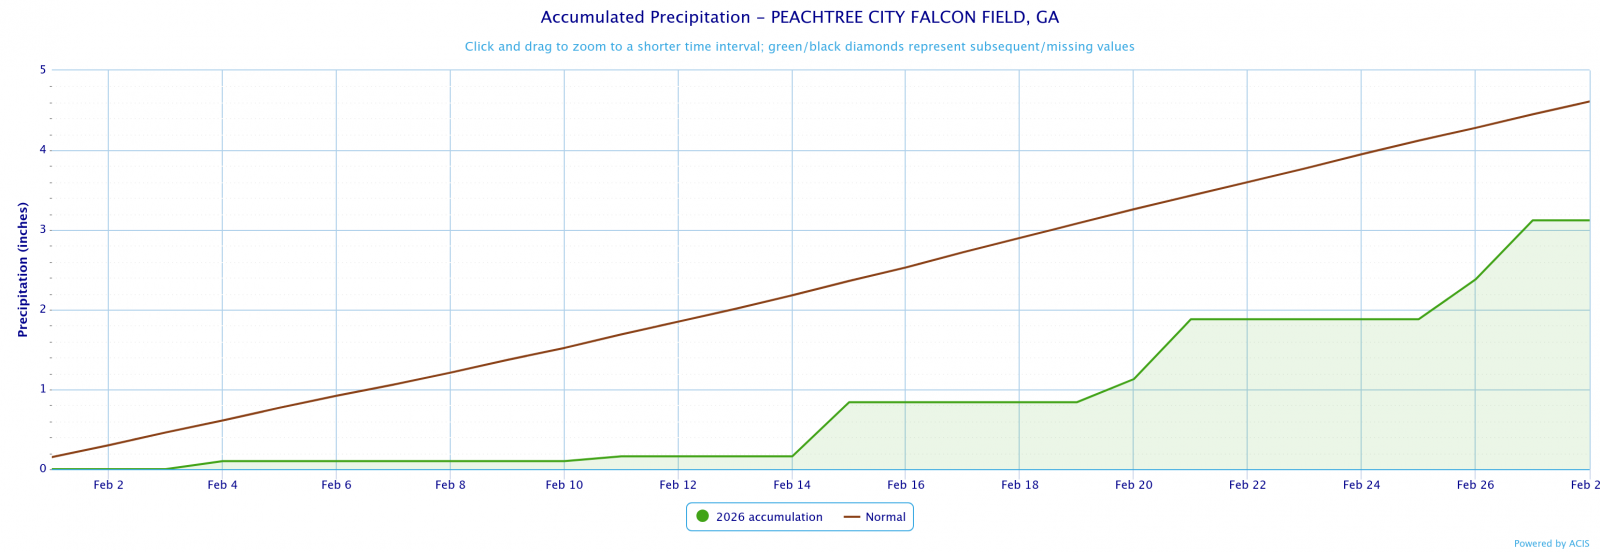
Peachtree City
3.12
4.29
-1.17
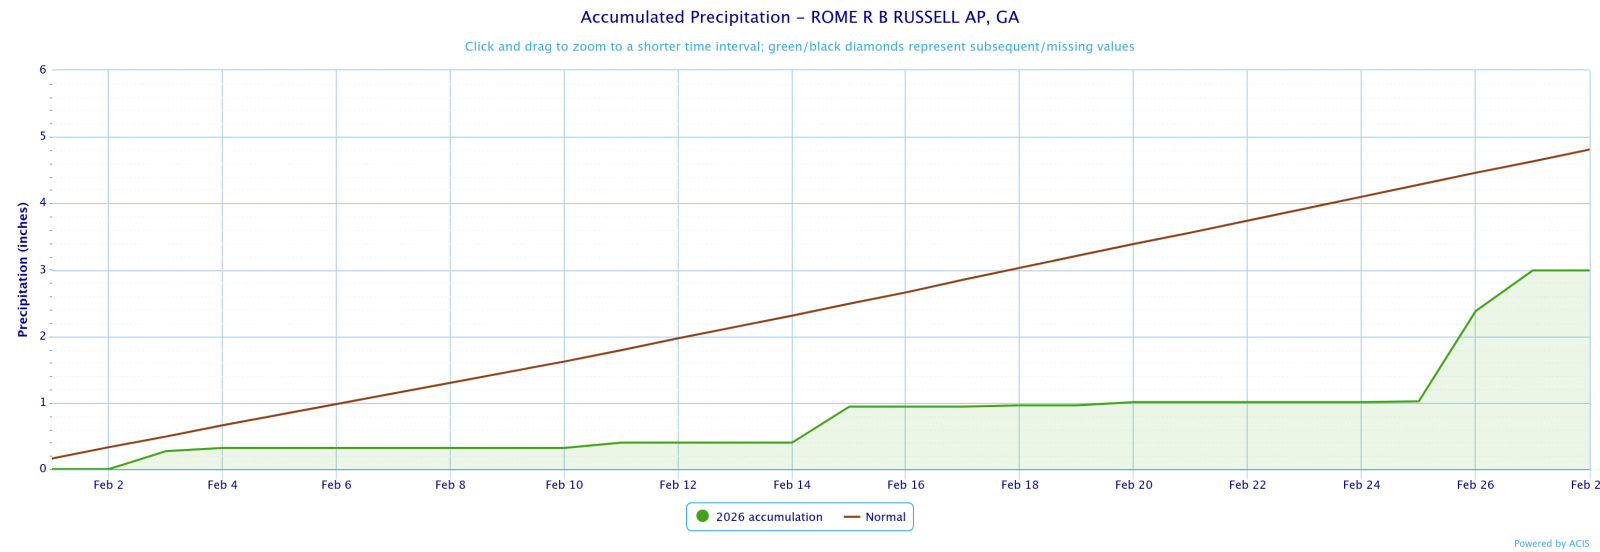
Rome
2.99
4.99
-2.00
February 2026 Precipitation Climate Statistics
Athens
2.16
2/26
Atlanta
1.23
2/26
Columbus
1.92
2/27
Macon
1.27
2/21
Dekalb Peachtree Arpt
3.95
2/26
Fulton Co Arpt
1.56
2/26
Gainesville
1.54
2/26
Peachtree City
1.21
2/26
Rome
1.97
2/26
Click the links below to explore the temperature and precipitation data across north and central Georgia for the month of February 2026.
Temperature Maps
Precipitation Maps
Temperature Graphs
Precipitation Graphs

Temperature and precipitation records at our 4 main climate sites are located below.
February 2026 Climate Records
Date
Type
Location
Records set over a 24 hour period
2/19
Max Temp
Macon
Macon reached 82°F which breaks the old record of 80°F set in 1986
No significant weather events occurred across north and central Georgia this past February.
March Outlook