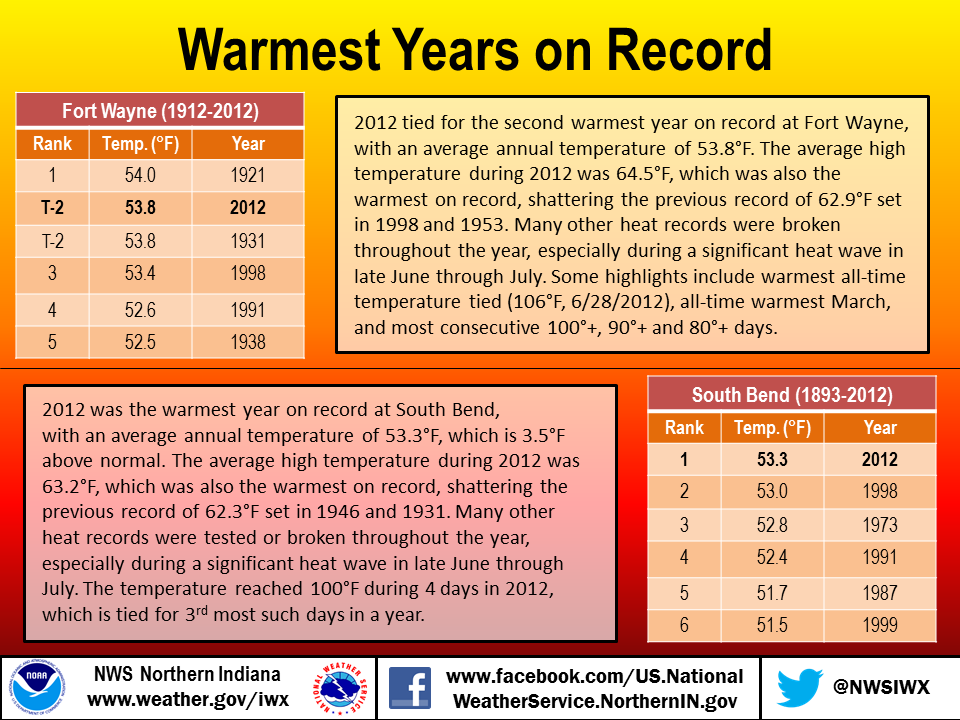
2012 will be remembered for many significant weather events across the country. However, the biggest story across the local area was the record warm temperatures this year, and a subsequent drought that plagued the region for much of late spring into fall. At Fort Wayne, the average temperature for the year was 53.8°F, which tied for the second warmest year on record (1912-2012). The average temperature was 3.3°F above the 30-year normal value (1981-2010) of 50.5°F. The average temperature for 2011 was 51.6°F. The average high temperature for the year was 64.5°F. This is the warmest average high temperature on record for Fort Wayne, breaking the previous record of 62.9°F in 1998 and 1953. 2012 will go down as the warmest year on record (1893-2012) at South Bend. The average temperature was 53.3°F, breaking the previous record of 53.0°F set in 1998. The average temperature was 3.5°F above the 30-year normal value of 49.8°F. The average temperature for 2011 at South Bend was 50.6°F. Like Fort Wayne, 2012 has the warmest average high temperature on record, at 63.2°F. This breaks the previous record of 62.3°F set in 1946 and 1931.
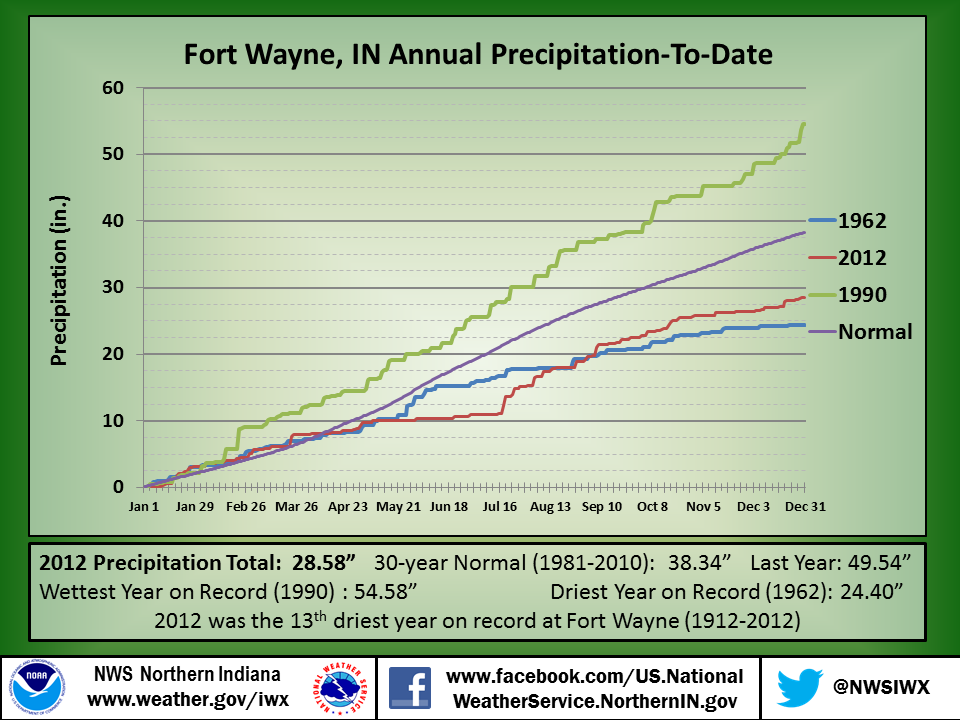
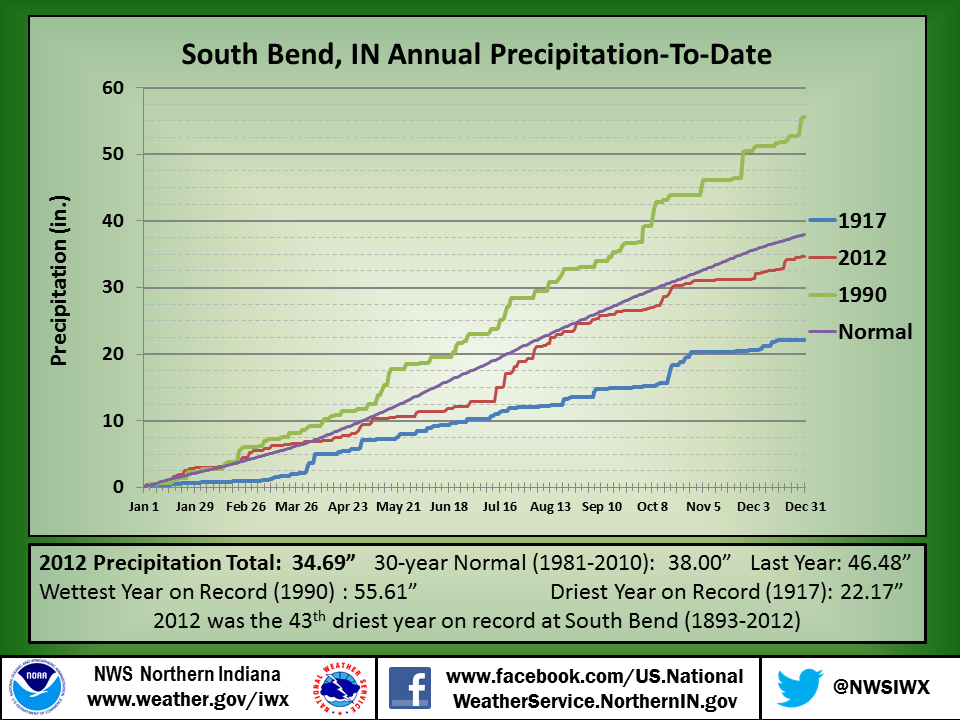
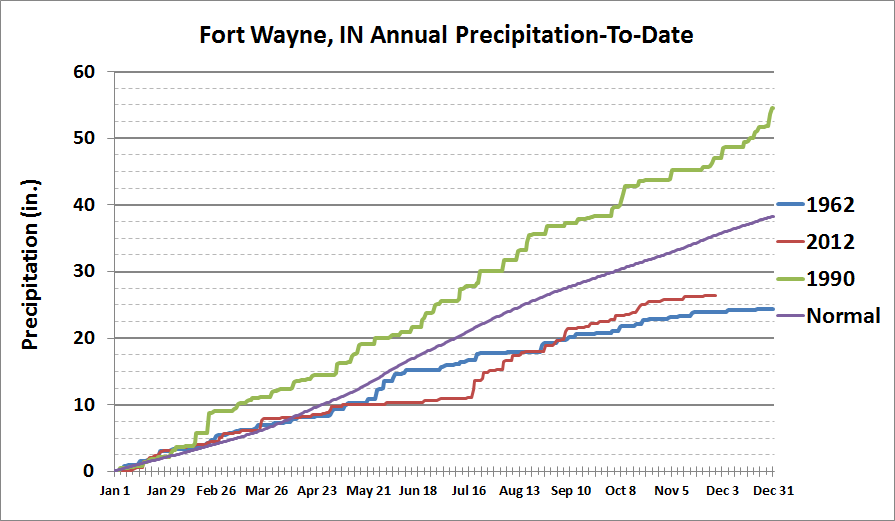
Precipitation for the year of 2012 was below normal at both Fort Wayne and South Bend. Below are graphs depicting the year to date precipitation totals for Fort Wayne and South Bend. The graphs include 2012 year-to-date precipitation, the 30-year normal (1981-2010) year-to-date precipitation, and the precipitation-to-date for the wettest and driest years on record at both sites.
Fort Wayne received 28.58" of precipitation in 2012. This ranks as the 13th driest year on record, and the driest year since 1999, when only 28.33" of precipitaton fell. Precipitation for 2012 was 9.76" below the 30-year normal value of 38.34". Last year was the 3rd wettest year on record at Fort Wayne, when 49.54" of precipitation fell, nearly 20.96" more than what fell in 2012! The graph below shows that 2012 precipitation was near normal into late April/early May. From May 9th through July 17th, only 0.96" of precipitation fell, which is 9.78" below the normal precipitation for that 70 day period. This is the driest 70 day period on record during the meterological spring or summer (March 1st-August 31st). The next two days after this 70 day period, July 18th and 19th, saw 1.22" and 1.43" of precipitation respectively. An active weather pattern from late July through September brought the year-to-date total above the driest year on record. However, below normal precipitation in October and the 3rd driest November on record at Fort Wayne kept the yearly precipitation well below normal.
South Bend received 34.69" of precipitation in 2012. This ranks as the 43rd driest year on record, and the driest year since 2010, when 32.07" of precipitaton fell. Precipitation for 2012 was only 3.31" below the 30-year normal value of 38.00". Last year was the 5th wettest year on record at South Bend, when 46.48" of precipitation fell, nearly 11.79" more than what fell in 2012. The graph below shows that 2012 precipitation was near normal into late April/early May. A dry period from late May through early July brought defecits in the yearly precipitation.However, an active weather pattern change from late July through September brought the year-to-date total near normal. However, below normal precipitation in late September/early October and the driest November on record at South Bend, with only 0.26" of precipitation (the 4th driest month on record), kept the yearly precipitation just below normal.
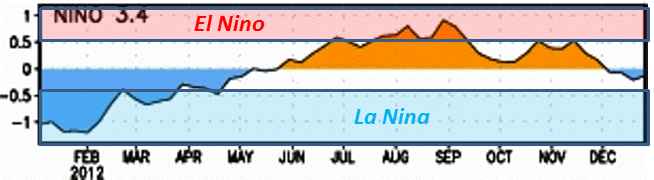
The El Nino Southern Oscillation had a strong influence on the weather in 2010 and 2011, and 2012 was no exception. Above is a graph of the Nino 3.4 sea surface temperature anomalies. At the beginning of the year, La Nina conditions prevailed, which typically bring the potential for above normal precipitation to the Great Lakes region. As sea surface temperatures warmed and the La Nina transitioned to ENSO-neutral conditions, precipitation became below normal in late spring to early summer across the area. Throughout the summer, sea surface temepratures warmed to weak El Nino conditions, before cooling again in early and late fall. To read more about ENSO and its effects on our climate, click here.
To read more about the drought of 2012 and its impacts across the area, click on the link below.
Recently, we created a website with maps of Monthly, Seasonal, Annual, and Climate Normal Precipitation and Snowfall for northern Indiana, southern Lower Michigan, and northwest Ohio. These maps are generated from National Weather Service observing stations. They will be generated and posted within the first few days of each new period (month, season, year.) If you have any questions or suggestions for this webpage please contact us at w-iwx.webmaster@noaa.gov.
Monthly and Seasonal Precipitation Maps
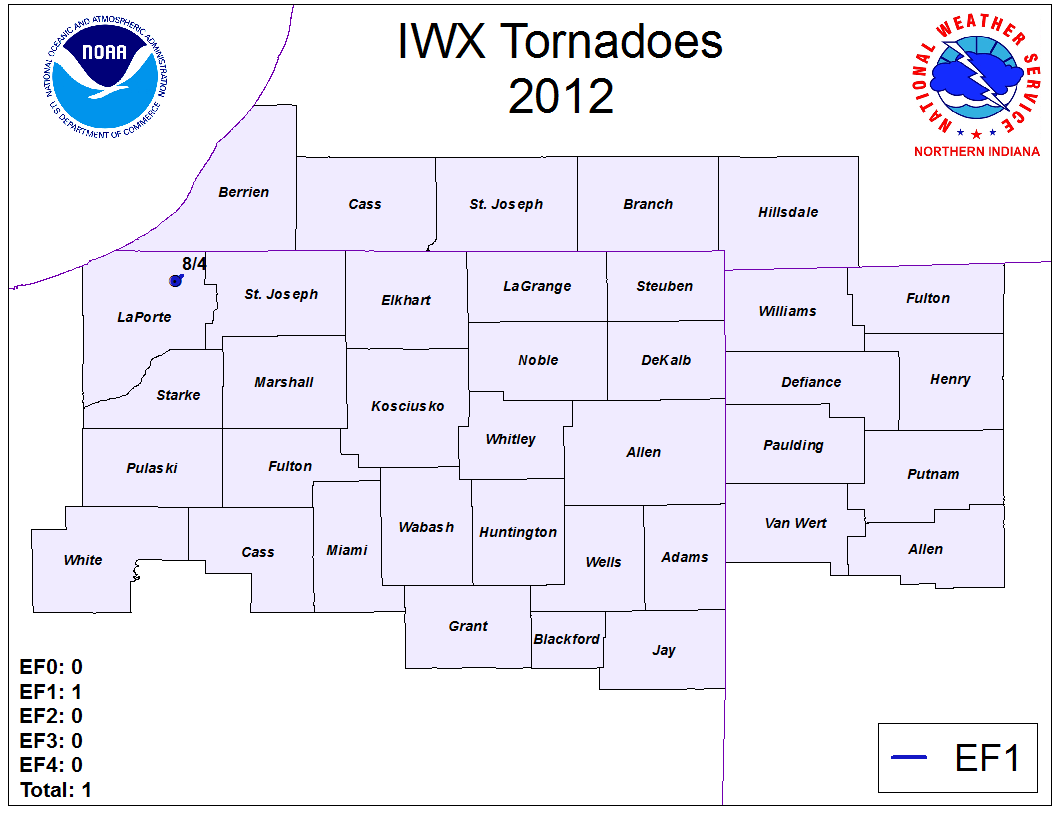
After a record number of tornadoes in 2010 and 14 tornadoes in 2011 across the NWS Northern Indiana County Warning Area (CWA), only 1 tornado occurred in 2012. It was a weak EF-1 tornado with a path length of less than 1.5 miles in LaPorte County, Indiana. The map below shows the location, date and EF rating of the tornado.
|
January 2012 was a roller coaster month with above normal temperatures and precipitation across the area. The new year began with high temperatures in the 40s before temperatures plummeted as a cold front moved through the area. The cold air would not last long as temperatures reached into the mid 50s by the 6th and the period from the 5th through the 12th had high temperatures of at least 40 degrees each day. Another strong cold front brought temperatures back down to below normal with lake effect snow showers between the 13th and 15th. Again, the cold air did not last long as temperatures warmed back into the 50s by the 16th. This pattern continued through the end of the month. Each cold period helped spawn light snow which added to the above normal snowfall for the month. |
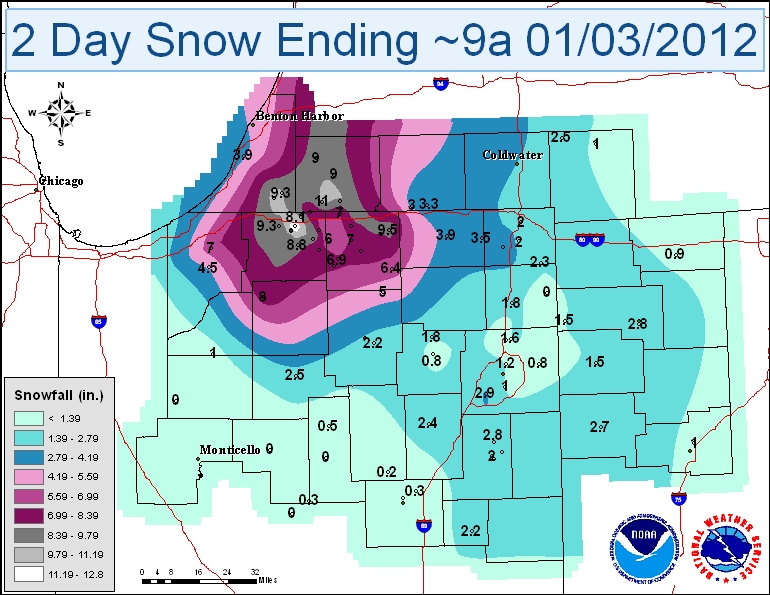
January 1st-3rd Lake Effect SnowAn upper level trough dropped southeast out of central Canada into the Great Lakes region on Sunday, January 1st, accompanied by a surface low and cold front. Temperatures started out in the mid to upper 40s early Sunday ahead of the front, with breezy conditions across the region as the low approached. As the cold front rushed east across the region throughout the day, temperatures fell sharply, and rain began to change over to snow. Cold air spilled into the region behind the front, along with a few upper level disturbances, which helped produce lake effect snow late Sunday through early Tuesday. |
 |
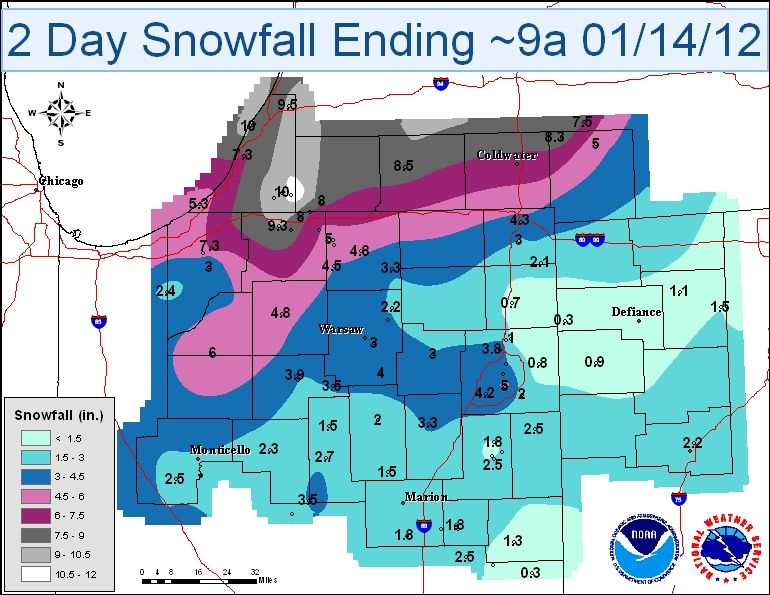
January 12th-14th Lake Effect SnowstormA lake effect snow storm brought over ten inches of snowfall to portions of Berrien County. |
 |
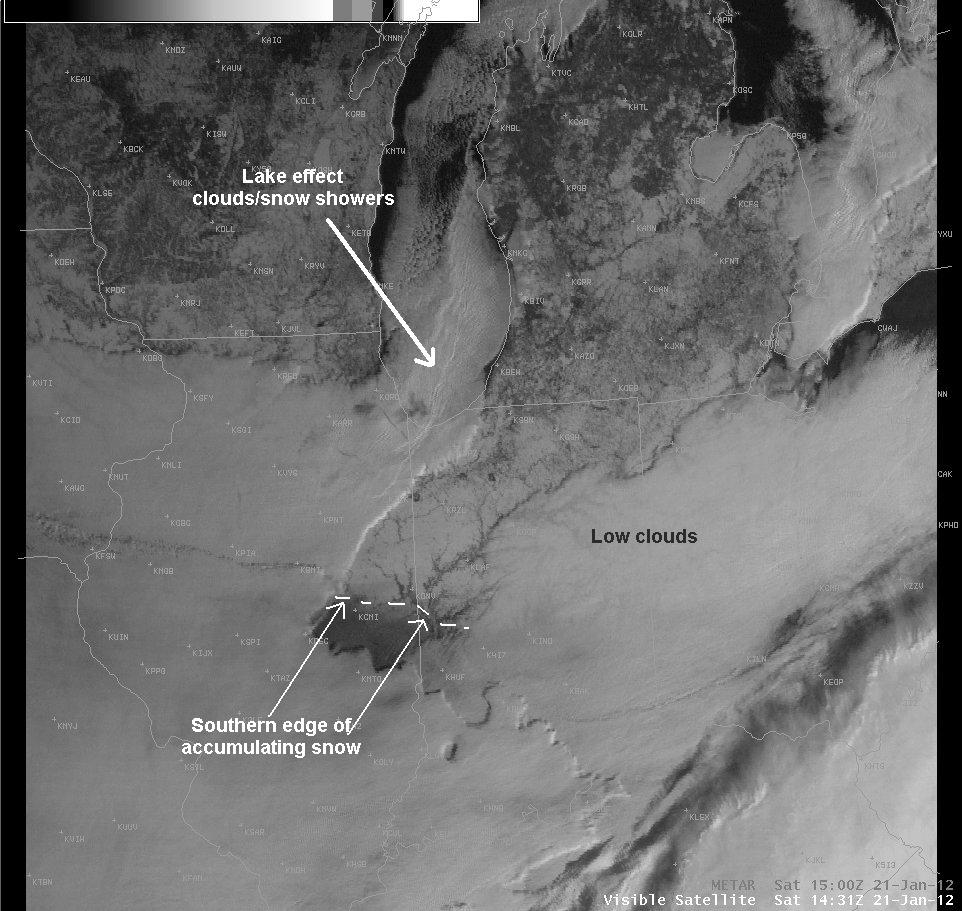
January 20th SnowfallA fast moving storm system from the eastern Pacific brought accumulating snow to the region late Friday afternoon and Friday night. A band of moderate to heavy snow across northern Illinois shifted eastward into northwest and north central Indiana by late Friday afternoon. Snow continued through much of the evening hours before diminishing overnight. Storm total snowfall accumulations were generally in the 3 to 7 inch range with isolated higher amounts. |
 |
January 28th Heavy SnowfallA narrow band of moderate to heavy snow brought localized snowfall amounts in the 4 to 7 inch range. The approach of an upper level trough allowed a frontal boundary in the upper levels of the atmosphere to strengthen during the overnight hours. In addition, some increasing instability aloft also tracked northward into northeast Indiana. These factors led to a narrow band of more intense snow. |
 |
|
Nearly the entire month of February was warm with below normal snowfall and near normal precipitation. The atmosphere remained active with help from a weakening La Nina as numerous storm systems moved through the Ohio Valley. Cold arctic air was bottled up in Canada and this kept mild temperatures in place across the region. Meteorological winter came to a very warm end as temperatures reached into the upper 60s on Leap Day. |
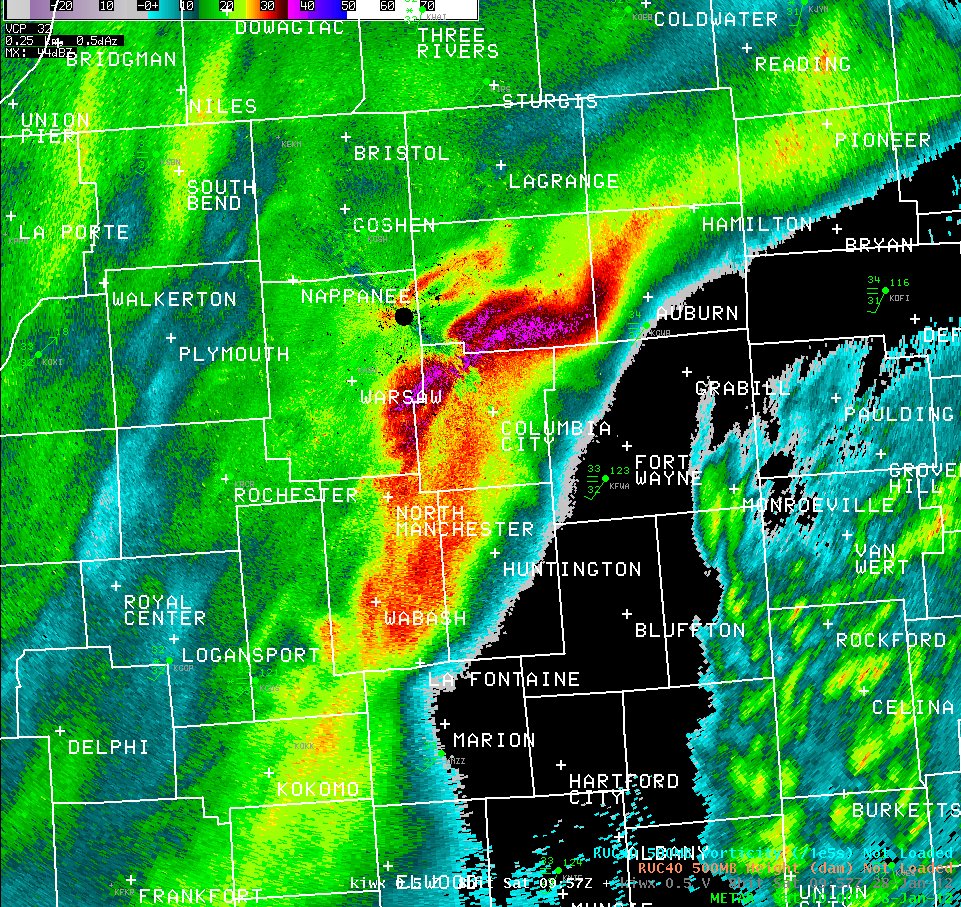
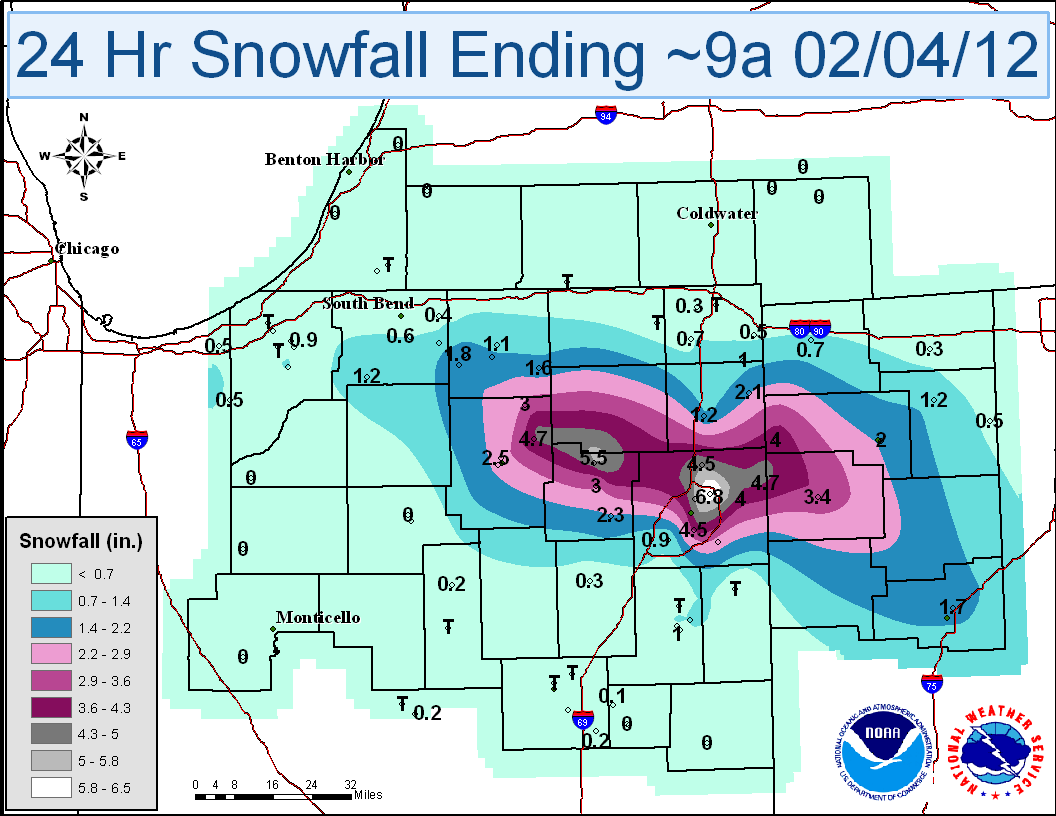
February 4th Surprise SnowfallMany locations across central portions of the CWA saw accumulating snowfall as a band of locally heavy snowfall set up across Kosciusko, Noble, Whitley, Dekalb and Allen counties in Indiana and Paulding/Defiance counties in Ohio. Under this mesoscale snowband, temperatures cooled just enough to allow for precipitation to fall in the form of snow. Locations just to the south and west of these areas saw mainly rain. |
 |
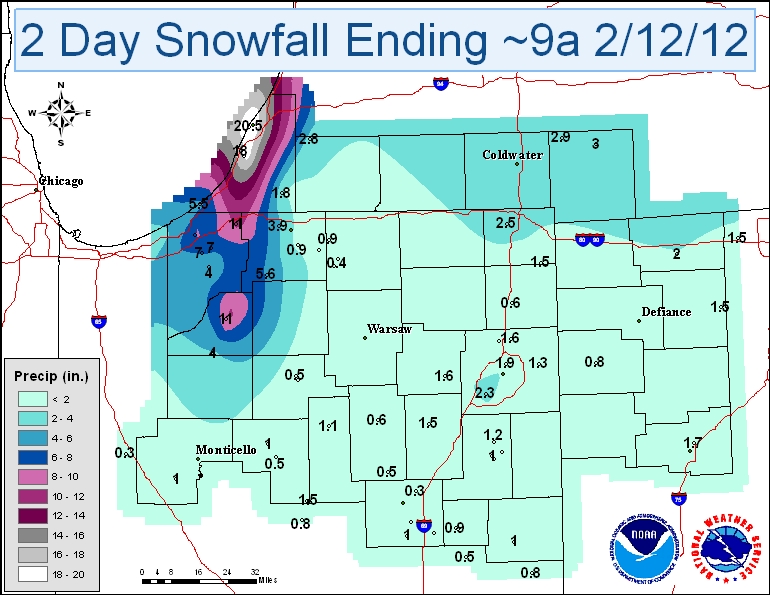
February 11th Lake Effect SnowA band of heavy lake effect snow developed across far NW Indiana during the evening hours of February 10th. This band began to shift eastward and reached northwest portions of the CWA on February 11th. Some locations received over a foot of snow by the time the event was over. |
 |
2011-2012 Winter in ReviewThe winter of 2011-2012 (December-February) was characterized by much above normal temperatures across the area and in fact, across much of the eastern United States. Fort Wayne received 32.2 inches of snowfall, which was 1.3 inches above normal and over 14 inches below the previous winter's total. South Bend received only 51.2 inches of snowfall, which was 15.4 inches below normal and over 50 inches below the 2010-2011 winter. |
|
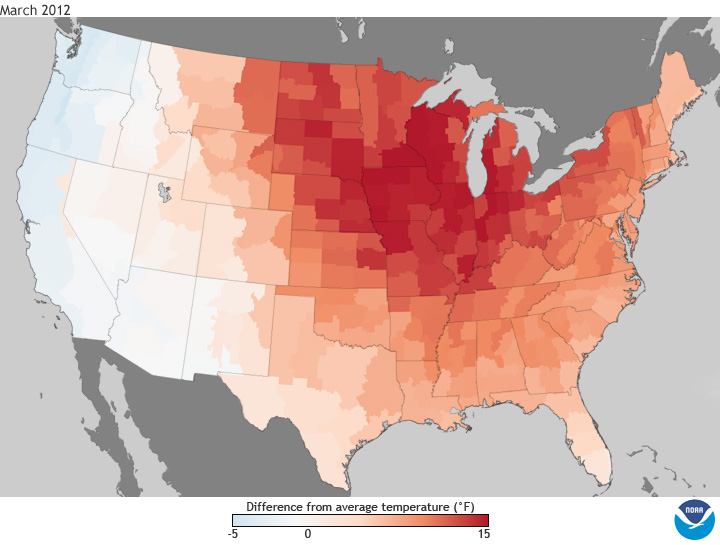
March 2012 was a record-shattering month. Fort Wayne and South Bend experienced their warmest March on record. Fort Wayne had 10 consecutive days with high temperatures of 70 degrees or greater and South Bend had 9 consecutive days. Both Fort Wayne and South Bend also reached 80 degrees five times which was a new record. As a result of this warmth, trees and vegetation came to life quickly and were in a state normally not seen until the end of April or early May. Many fruit trees bloomed 5 weeks ahead of schedule. Precipitation was below normal at South Bend and above normal at Fort Wayne. |
Record-Setting March Temperatures |
|
Despite monthly average temperatures that were slightly above normal, April was cooler by March. This has only happened one other time in 1907 since records began at both Fort Wayne and South Bend. The incredible March warmth helped vegetation spring to life and bloom well ahead of normal. This proved to be devastating in many areas as temperatures return to normal in April which meant morning temperatures below freezing. Fruit crops were severely damaged by the more seasonable weather. To make matters worse, precipitation was well below normal for the entire region, with some locations seeing only 25% of their normal precipitation until the last 3 days in the month. |
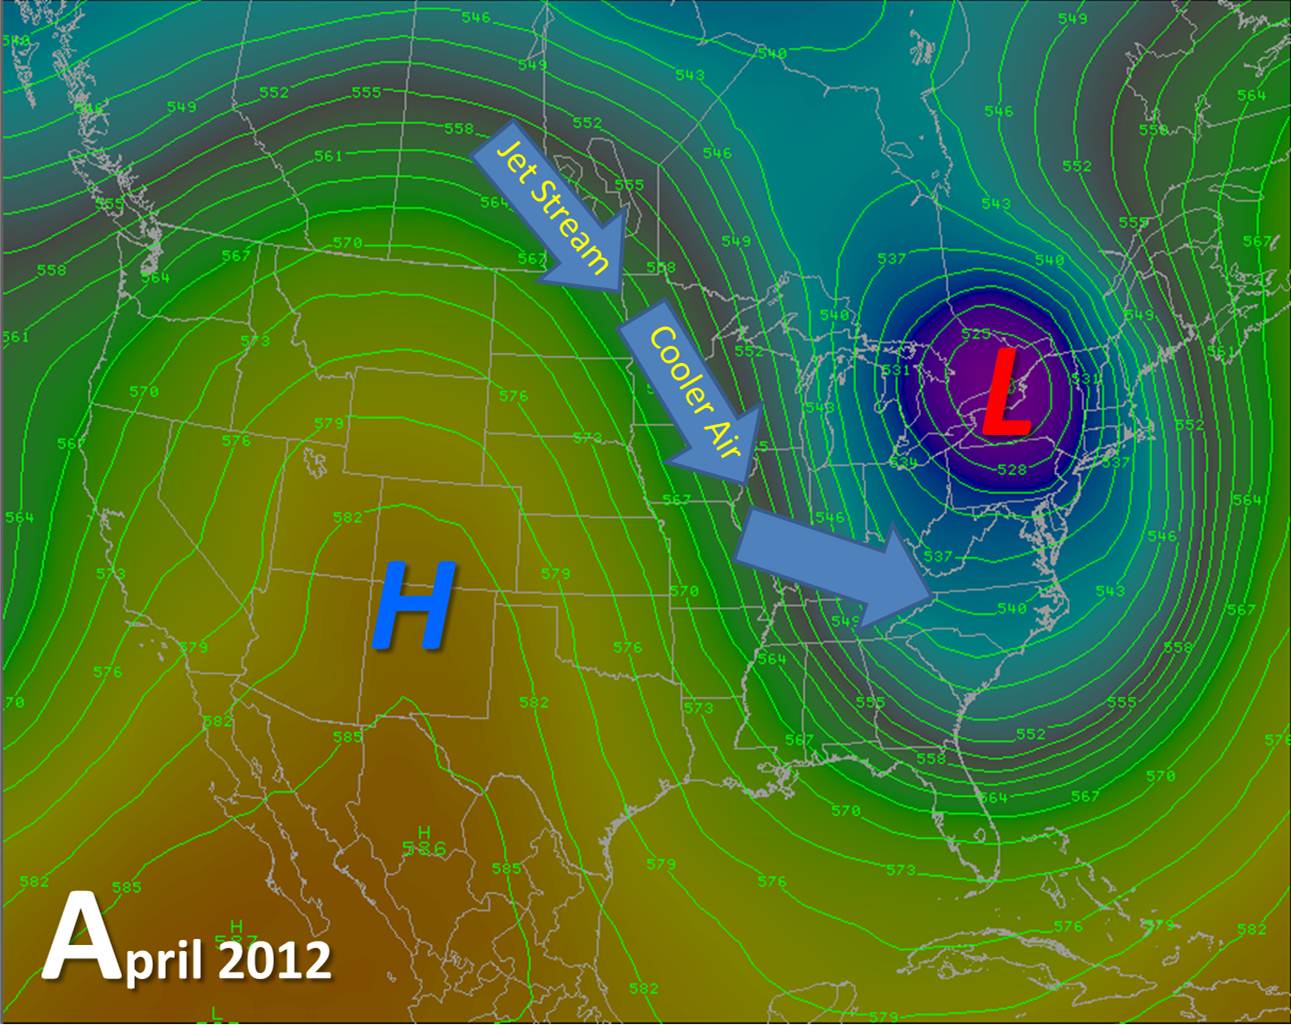
March Heat, April FreezesA strong and persistent ridge of high pressure across the eastern two thirds of the country resulted in record and near record breaking temperatures during the month of March. The earlier than normal extreme warmth promoted early development of flowering bulbs and budding of trees and shrubs. In many areas this development occurred up to a month earlier than normal. With the weather returning somewhat closer to normal in April, the fear in the agricultural community was that any hard freeze could potentially result in widespread damage to fruit trees and other horticulture, as well as to early planted corn. Growers' worst fears came true in the central Midwest. After a warm first week of April, several incursions of cold air made their way through the central U.S. the remainder of the month and into May. |
 |
April 2012 was cooler than March 2012 |
 |
|
The month of May was characterized by a continuation of relatively dry conditions and warm temperatures which were both common through much of the spring. It was the 3rd warmest May on record in Fort Wayne and the 9th warmest May on record at South Bend. Incredibly, temperatures rose into the upper 90s toward the end of the month, breaking records for all time warmest May day on record. Due to the warmth and virtually no precipitation for most of the month, high evaporation rates occurred which stressed vegetation. The area fell into the D0 drought category, meaning abnormally dry conditions were present. |
|
Dry and warm conditions continued across the area during June. Drought intensified to D2 (severe) or D3 (extreme) conditions during the month as most of the area received little to almost no rainfall. With the lack of rainfall came a lack of severe weather as well, until the last few days of the month when a long lived derecho pushed through the area and on to the East Coast, causing many downed trees and minor structural damage. Despite extreme heat toward the end of the month, cooler temperatures at the beginning of the month helped hold the monthly average to only a few degrees above normal. There were 9 days where the temperature reached at least 90 degrees at South Bend and 12 days at Fort Wayne. Incredibly, the high temperature on the 29th reached 106 degrees at Fort Wayne! This tied the all time record high temperature! |
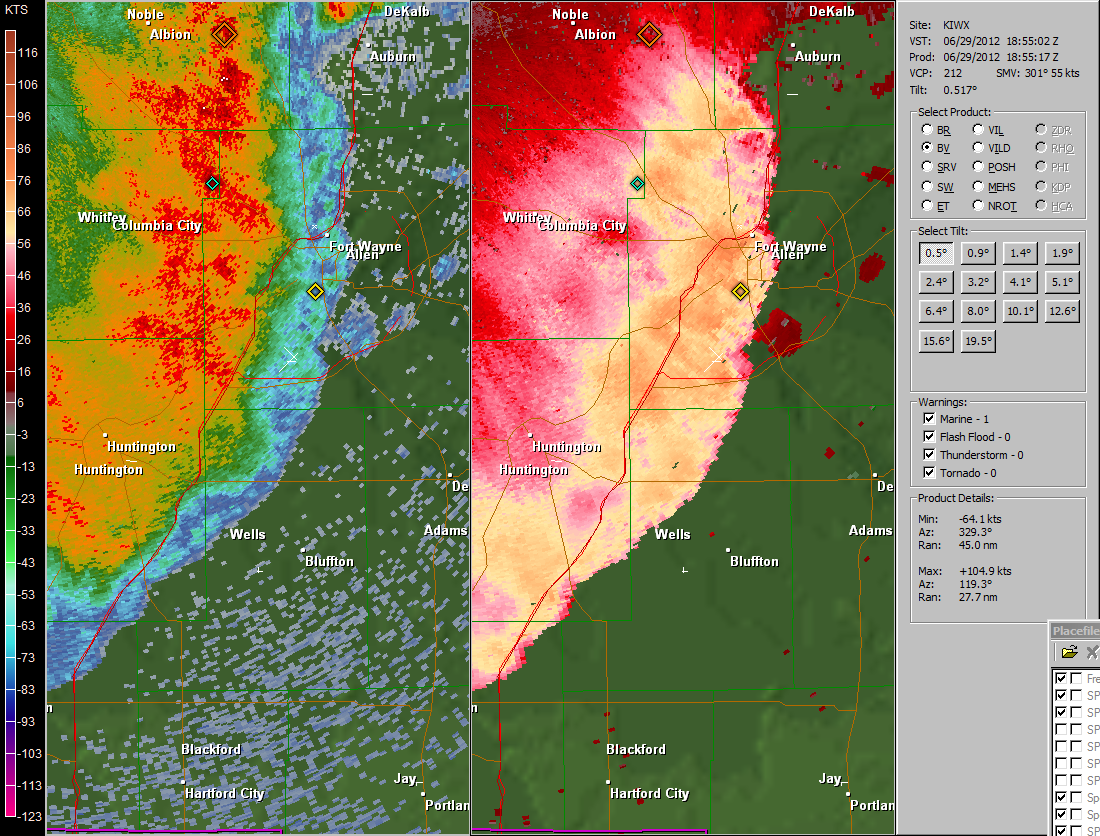
June 29th DerechoOn the afternoon of June 29th, an intense, long-lived windstorm called a derecho formed in northwest Indiana and began carving a path of destruction over 600 miles long. Winds approaching 100 miles per hour were reported during the most intense part of the event (between Fort Wayne, IN and Columbus, OH.) At the peak of the event, the Fort Wayne International Airport observing equipment observed a peak wind gust of 91 mph, and the observer reported seeing a downburst descend from the cloud directly ahead of him. Winds were as strong as an EF-1 tornado over a widespread area which resulted in immense damage along the storm's entire path. |
 |
|
Drought conditions continued to intensify and persist through early July. D2 (severe) and D3 (extreme) conditions were present across much of the area as extreme heat plagued the region with little to no rainfall for the first 2 weeks of July. Fort Wayne hit 90+ degrees 20 times during the month, the most 90+ degree days in a month since July 2011, when an all time record 22 90+ degree days were recorded. A streak of 22 consecutive 90+ degree days ended on the 19th. This streak set a new record for consecutive 90+ degree days. South Bend hit 90+ degrees 16 times during the month, the most 90+ degree days in a month since July 1983. The record heat with less than a tenth of an inch of precpitation put major stress on area crops and lawns. A pattern change in the middle of the month brought some relief to the area in the form of precipitation and cooler temperatures. |
Heat Statistics for the Area |
|
The pattern change that began in late July continued through August with cooler than normal temperatures and precipitation closer to normal. This led to some improvements in the drought situation. Much of the region improved from D3 and D4 drought to D1 or moderate drought conditions. |
August 4th TornadoA line of severe thunderstorms formed along a strong cold front that raced east across the area on August 4th. The storms spawned a weak tornado that touched down near Rolling Prairie in La Porte county, Indiana. The tornado was on the ground for less than 1.5 miles and caused tree damage and minor structural damage to a residence. |
 |
|
The cool pattern continued through September with cooler than normal temperatures and above normal precipitation in the east and below normal precipitation across northwest Indiana and southwest lower Michigan. Even though precipitation was above normal in some areas, ongoing moderate drought conditions continued as hydrological conditions were still poor. Many areas saw their first frost during the last half of the month as a few nights dropped to near freezing. |
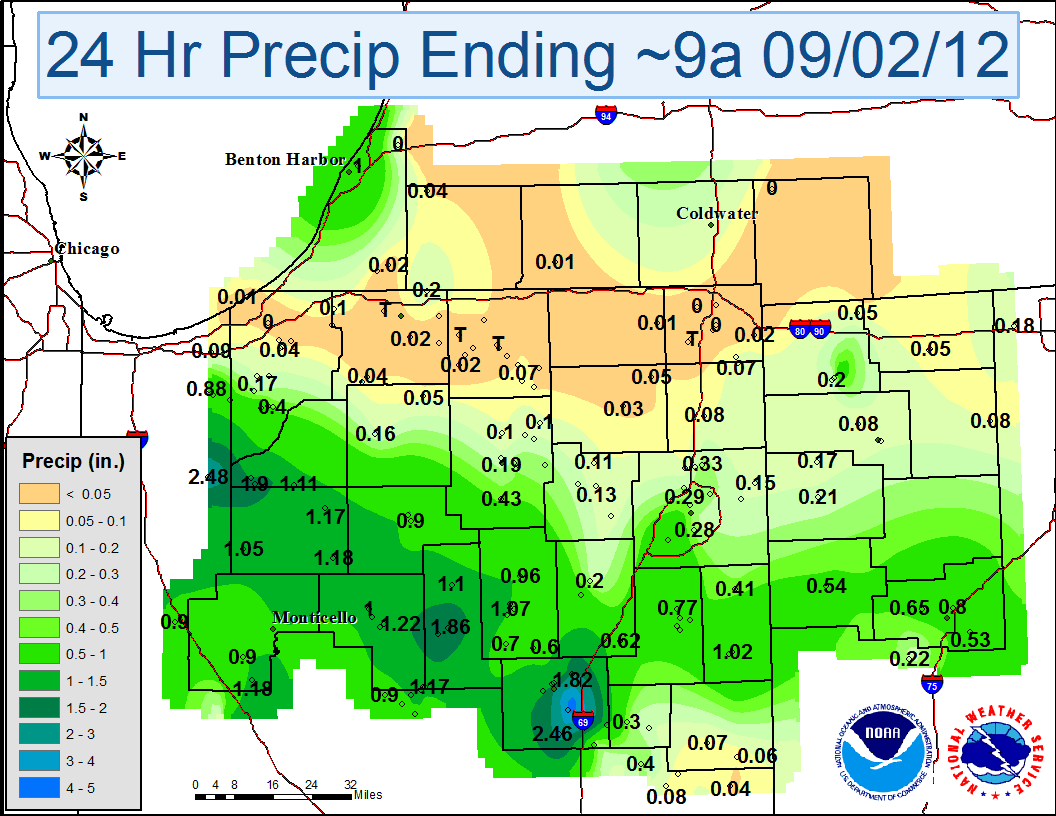
Rainfall from the Remnants of Hurricane IsaacThe remnants of Hurricane Isaac moved across the Mississippi and Ohio Valleys over Labor Day weekend. Heavy rainfall fell across central and southern Illinois and Indiana. The gradient in heavy rainfall was sharp across the local area, with southern portions of the Northern Indiana CWA (county warning area) receiving the most rain. Areas across southern lower Michigan, northwest Ohio and far northern Indiana saw less than a half inch of rain. |
 |
|
October was a relatively wet month with many days of measurable rainfall with below normal temperatures. A strong blast of cold Canadian air moved into the region at the end of the month, combining with the remnants of Hurricane Sandy to produce cold, windy, and wet conditions across the area. |
Post-tropical Cyclone Sandy Impacts the AreaPost-tropical cyclone Sandy moved onshore on the East Coast, but it's effects were felt even in the local area. The combination of the strong low pressure system combined with high pressure across the northern Great Lakes caused very windy conditions across the area. |
 |
Frost/Freeze Information for the AreaThe fall season was underway across the area and it's the time of year when the possibility for frost and freezing temperatures at night return. Typically, frost can occur when the temperature falls below 36°F, especially in rural areas. It is a localized phenomena and can be quite variable across a small area. While the National Weather Service does not keep track of "frost" in observations per se, we do keep track of when temperatures hit the freezing mark or fall below. Frost becomes more widespread when the temperature falls below 32°F with some freeze possible. A hard freeze is possible when temperatures fall below 28°F. |
 |
|
November was characterized by well below normal precipitation. Fort Wayne recorded it's second driest November on record and South Bend recorded it's driest November on record. Temperatures were below normal for the 4th month in a row despite several short warm spells during the month. Cool Canadian high pressure remained largely in control outside of a few fast moving systems that brought warmer temperatures but little to no rainfall to the area. This allowed for drought conditions across the area to deteoriate back to D1 or moderate drought conditions. Snowfall was also below normal. |
One of the Driest Novembers on RecordNovember 2012 went down as one of the driest Novembers on record. Fort Wayne recorded its second driest November on record with below normal temperatures. South Bend recorded its driest November on record and 4th driest month ever with below normal temperatures. |
 |
|
December 2012 was generally a warm month across the area. Temperatures were in the 50s and 60s across portions of the area over the first few days of the month. During the middle of the month, a few weather systems impacted the region. While precipitation was above normal for the month, snowfall was below normal at South Bend, while snowfall was near normal at Fort Wayne. |
December 10-11th Lake Effect SnowIn the wake of a departing low pressure system, northerly winds combined with forcing from an upper level disturbance to generate conditions favorable for the development of lake effect snow. Light snow began during the afternoon hours on Monday, December 10th and increased in intensity during the evening hours. Snow tapered off by the morning hours on Tuesday, December 11th. Accumulations were mainly limited to two main bands: one in western La Porte County and one from Berrien County to western Cass County into St. Joseph/Elkhart counties in Indiana. |
 |
Record streak for most consecutive days without measurable snow ends at South Bend |
December 26th Winter StormA strong low pressure system moved from the southern Plains across the Ohio Valley on December 26th, 2012. The storm produced widespread heavy snow from Arkansas all the way to the East Coast. The local area was on the northern fringes of the heaviest snow with most locations in receiving 3 to 5 inches. Heavier amounts of 5 to 9 inches were seen across southeastern portions of the area. The storm also produced gusty winds which caused blowing and drifting snow and hazardous travel conditions across the region. |
 |
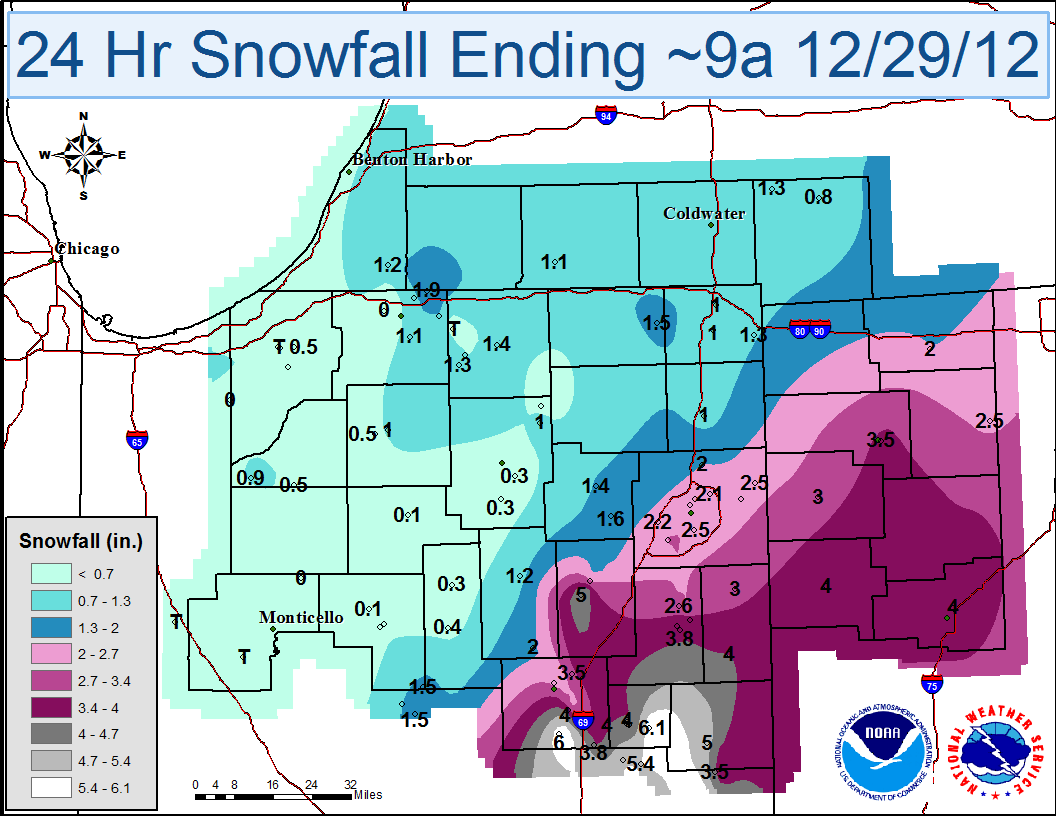
December 28-29th Snow EventA low pressure system moved across the Tennessee and Ohio Valleys during the evening of December 28th into the morning of the 29th. This system brought another round of snow to the area, especially locations across the southeast portion of the local area. Snowfall amounts ranged from less than half an inch in the northwest to 4-6 inches in the southeast. |
 |
| Records Tied or Broken in 2012 at Fort Wayne | ||||
| Date | Record Type | New Record | Old Record | Old Date |
| 20-Jan-2012 | DAILY MAX SNOWFALL | 3.8 | 3.1 | 1978 |
| 29-Feb-2012 | DAILY MAX TEMPERATURE | 66 | 66 | 1976 |
| 14-Mar-2012 | DAILY MAX TEMPERATURE | 79 | 78 | 1995 |
| 15-Mar-2012 | DAILY MAX TEMPERATURE | 81 | 75 | 1995 |
| 15-Mar-2012 | DAILY MAX LOW TEMP | 57 | 51 | 1990 |
| 16-Mar-2012 | DAILY MAX TEMPERATURE | 78 | 77 | 1945 |
| 17-Mar-2012 | DAILY MAX TEMPERATURE | 76 | 71 | 2009 |
| 18-Mar-2012 | DAILY MAX TEMPERATURE | 77 | 75 | 1903 |
| 18-Mar-2012 | DAILY MAX LOW TEMP | 55 | 54 | 1905 |
| 19-Mar-2012 | DAILY MAX TEMPERATURE | 83 | 76 | 1921 |
| 20-Mar-2012 | DAILY MAX TEMPERATURE | 84 | 76 | 1918 |
| 21-Mar-2012 | DAILY MAX TEMPERATURE | 87 | 81 | 1907 |
| 21-Mar-2012 | MAX MARCH TEMPERATURE | 87 | 86 | March 24, 1910 |
| 22-Mar-2012 | DAILY MAX TEMPERATURE | 83 | 83 | 1907 |
| 3-Apr-2012 | DAILY MAX TEMPERATURE | 78 | 78 | 1956 |
| 27-Apr-2012 | DAILY MIN TEMPERATURE | 28 | 28 | 1976 |
| 28-Apr-2012 | DAILY MAX SNOWFALL | T | T | 1961 |
| 3-May-2012 | DAILY MAX TEMPERATURE | 87 | 87 | 1955 |
| 3-May-2012 | DAILY MAX LOW TEMP | 63 | 63 | 1938 |
| 25-May-2012 | DAILY MAX LOW TEMP | 69 | 69 | 1918 |
| 25-May-2012 | DAILY MAX TEMPERATURE | 93 | 92 | 1908 |
| 27-May-2012 | DAILY MAX TEMPERATURE | 96 | 95 | 1911 |
| 27-May-2012 | MAX MAY TEMPERATURE | 96 | 96 | May 27, 1911 |
| 28-May-2012 | DAILY MAX TEMPERATURE | 95 | 94 | 1911 |
| 28-Jun-2012 | DAILY MAX TEMPERATURE | 106 | 102 | 1934 |
| 28-Jun-2012 | ALL-TIME MAX TEMP/MAX JUNE TEMPERATURE | 106 | 106 | June 25,1988 |
| 4-Jul-2012 | DAILY MAX TEMPERATURE | 101 | 101 | 1955 |
| 5-Jul-2012 | DAILY MAX TEMPERATURE | 101 | 99 | 1988 |
| 6-Jul-2012 | DAILY MAX TEMPERATURE | 101 | 99 | 1988 |
| 7-Jul-2012 | DAILY MAX TEMPERATURE | 103 | 102 | 1988 |
| 7-Jul-2012 | CONSECUTIVE 100+ DEGREE DAYS | 4 | 3 | July 9, 1988 |
| 17-Jul-2012 | DAILY MAX TEMPERATURE | 100 | 99 | April 14, 1905 |
| 18-Jul-2012 | CONSECUTIVE 90+ DEGREE DAYS | 21 | 14 | July 23, 1983 |
| 8-Aug-2012 | CONSECUTIVE 80+ DEGREE DAYS | 56 | 55 | September 7, 1899 |
| 7-Sep-2012 | DAILY MAX PRECIP | 1.19 | 0.97 | 1930 |
| 8-Oct-2012 | DAILY MIN TEMPERATURE | 28 | 28 | 1952 |
| 20-Dec-2012 | DAILY MAX PRECIP | 0.76 | 0.59 | 1960 |
| Records Tied or Broken in 2012 at South Bend | ||||
| DATE | RECORD TYPE | NEW RECORD | OLD RECORD | OLD DATE |
| 17-Jan-2012 | DAILY MAX SNOWFALL | 5.5 | 3.7 | 2005 |
| 19-Jan-2012 | DAILY MAX SNOWFALL | 5.7 | 4.9 | 1987 |
| 31-Jan-2012 | DAILY MAX LOW TEMP | 45 | 37 | 1989 |
| 29-Feb-2012 | DAILY MAX TEMPERATURE | 66 | 63 | 2000 |
| 14-Mar-2012 | DAILY MAX TEMPERATURE | 81 | 76 | 1995 |
| 15-Mar-2012 | DAILY MAX TEMPERATURE | 81 | 76 | 1935 |
| 15-Mar-2012 | DAILY MAX LOW TEMP | 63 | 48 | 1990 |
| 16-Mar-2012 | DAILY MAX TEMPERATURE | 79 | 77 | 1945 |
| 17-Mar-2012 | DAILY MAX TEMPERATURE | 78 | 75 | 1894 |
| 17-Mar-2012 | DAILY MAX LOW TEMP | 55 | 47 | 1946 |
| 18-Mar-2012 | DAILY MAX TEMPERATURE | 77 | 76 | 1903 |
| 18-Mar-2012 | DAILY MAX LOW TEMP | 61 | 58 | 1894 |
| 19-Mar-2012 | DAILY MAX TEMPERATURE | 79 | 77 | 1921 |
| 20-Mar-2012 | DAILY MAX TEMPERATURE | 83 | 76 | 1921 |
| 20-Mar-2012 | DAILY MAX LOW TEMP | 65 | 62 | 1921 |
| 21-Mar-2012 | DAILY MAX LOW TEMP | 62 | 51 | 1894 |
| 21-Mar-2012 | DAILY MAX TEMPERATURE | 85 | 79 | 1938 |
| 21-Mar-2012 | MAX MARCH TEMPERATURE | 85 | 85 | March 31,1981 |
| 22-Mar-2012 | DAILY MAX TEMPERATURE | 83 | 81 | 1938 |
| 3-May-2012 | DAILY MAX TEMPERATURE | 79 | 79 | 1956 |
| 3-May-2012 | DAILY MAX LOW TEMP | 65 | 65 | 1959 |
| 27-May-2012 | DAILY MAX TEMPERATURE | 97 | 91 | 1941 |
| 27-May-2012 | MAX MAY TEMPERATURE | 97 | 96 | May 31, 1934 |
| 28-May-2012 | DAILY MAX TEMPERATURE | 95 | 94 | 1911 |
| 19-Jun-2012 | DAILY MAX LOW TEMP | 75 | 73 | 1975 |
| 4-Jul-2012 | DAILY MAX TEMPERATURE | 100 | 99 | 1921 |
| 5-Jul-2012 | DAILY MAX TEMPERATURE | 100 | 100 | 1911 |
| 6-Jul-2012 | DAILY MAX TEMPERATURE | 102 | 100 | 1988 |
| 20-Jul-2012 | DAILY MAX PRECIP | 2.06 | 2.04 | 1896 |
| 6-Oct-2012 | DAILY MIN MAX TEMP | 46 | 46 | 1952 |
| November | DRIEST NOVEMBER | 0.26 | 0.37 | 1917, 1904 |
| 4-Dec-2012 | DAILY MAX TEMPERATURE | 64 | 64 | 1998 |
Stay tuned to our website and NOAA Weather Radio for weather information during 2013. Also, interact with NWS Northern Indiana on our Facebook Page, and follow us on Twitter @NWSIWX. Thanks to our spotters and followers on social media for the reports, photos and information shared with us during 2012. We look forward to your support during 2013!
Page created by: CEO/NG/EB
Last Updated: 1/2/13 12:45 PM

