2011 was a year of weather extremes across Northern Indiana, Southwest Lower Michigan and Northwest Ohio. Average temperatures for the year were above normal. At Fort Wayne, the average temperature for the year was 51.6 degrees F, which is 1.1 degrees F above normal and ranks as the T-18th (T signifies a tie) warmest year on record. At South Bend, the average temperature for the year was 50.6 degrees F, which is 0.8 degrees F above normal and ranks as the T-20th warmest year on record.
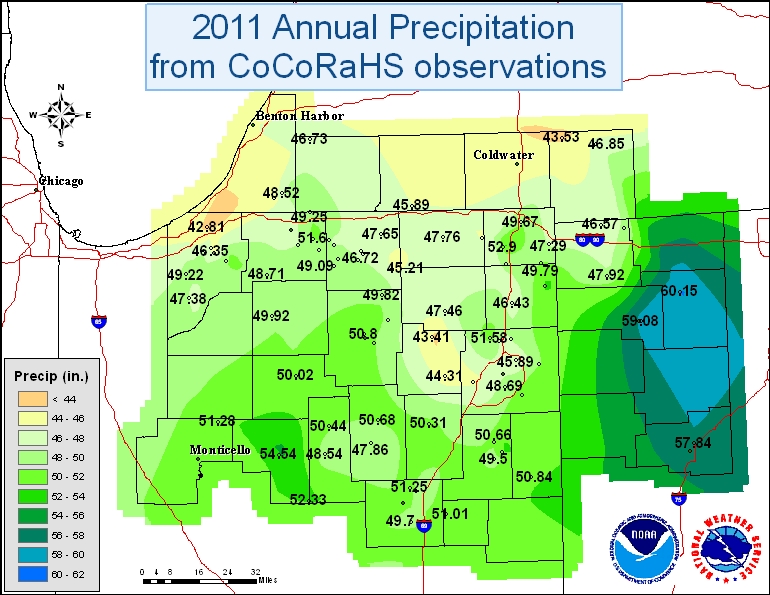
2011 was a particularly wet year across the area with the exception of the summer months which were quite dry with below normal rainfall. This resulted in many areas experiencing D0 to D1 drought conditions in the middle to late summer months. La Nina conditions present early in the year and then again late in the year greatly influenced the precipitation patterns. La Nina tends to bring more precipitation to the Ohio Valley region and this was certainly the case this year. To read more about La Nina phase of the El Nino-Southern Oscillation (ENSO) and the impacts of La Nina, click here. The total precipitation for the year at Fort Wayne was 49.54 inches, which is 11.20 inches above normal. 2011 ranks as the 3rd wettest year on record at Fort Wayne. The total precipitation for the year at South Bend was 46.48 inches, which is 8.48 inches above normal. 2011 ranks as the 5th wettest year on record at South Bend.
|
|
The image below shows an estimate of annual precipitation from CoCoRaHS observers. Notice the maximum in precipitation over Northwest Ohio.
Despite the lack of snowfall at the end of 2011, the calendar year snowfall was well above normal across the region thanks to a very active and cold storm pattern during the beginning of the year. South Bend recorded 86.4 inches of snow for the calendar year, 19.8 inches above normal. This ranks as the 16th snowiest year on record. Fort Wayne received 46.6 inches of snow which is 13.1 inches above normal. This ranks as the 7th snowiest calendar year on record.
The following links will take you to the annual climate summaries for Fort Wayne and South Bend.
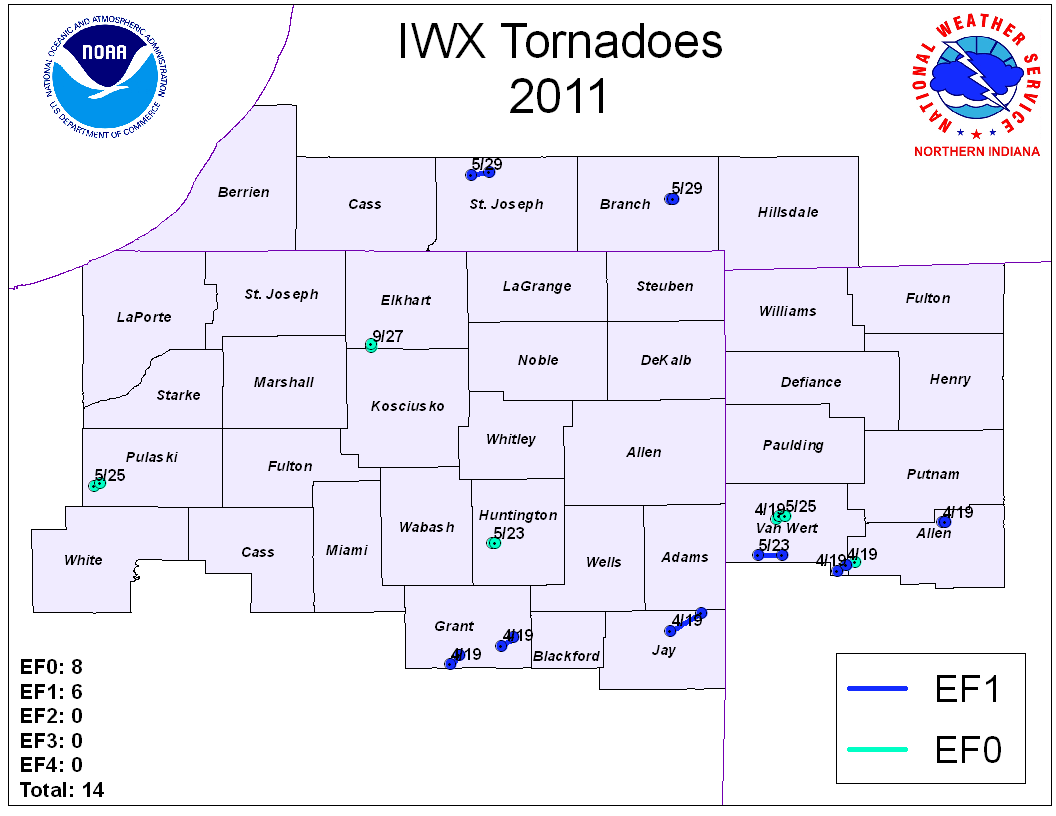
After a record number of tornadoes in 2010 across the NWS Northern Indiana County Warning Area (CWA), only 14 tornadoes occured across the CWA in 2011 with all 14 tornados rated EF-0 or EF-1 on the Enhanced Fujita Scale (EF scale). The map below shows the locations, dates and EF rating of every tornado in 2011 across the CWA.
|
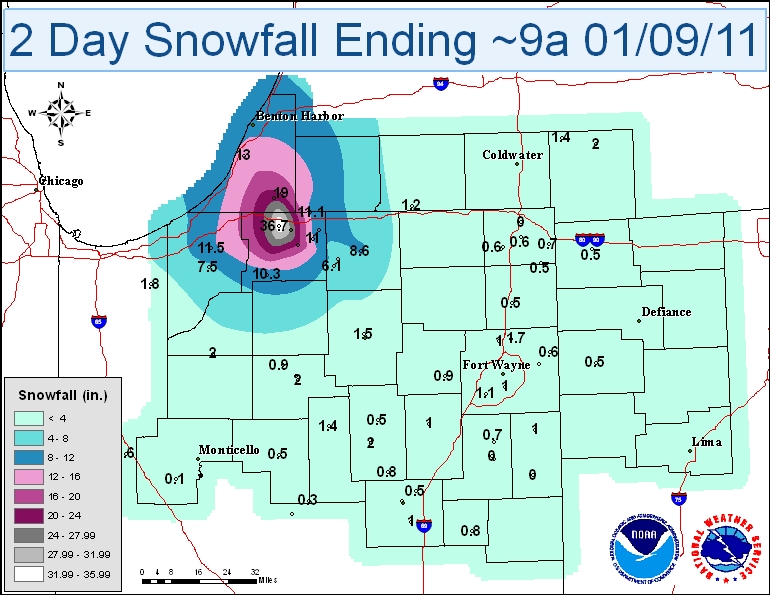
Although New Year's Day started out with temperatures in the mid 50s across the region, including a record high of 55 at South Bend, average temperatures for the month of January 2011 were below normal across the area. While precipitation was slightly below normal across the area for the month, snowfall was above normal at Fort Wayne and South Bend. For the month, South Bend received 53.8 inches of snowfall, which is 30.6 inches above normal, and ranks as not only the 2nd snowiest January on record, but the 2nd snowiest month on record, behind a whopping 86.1 inch monthly snowfall total in January 1978. Much of this snow fell in a two day period, when a lake effect snow event dropped 36.6 inches of snow at South Bend, including 26 inches of snow on January 8th, with 19 inches falling in the course of four hours, and 8 inches of snow falling in one of those hours! |
January 7th-9th Lake Effect SnowA strong upper-level disturbance shifted through the Great Lakes region in the afternoon of Friday the 7th. Cold air flowing over the relatively warm waters of Lake Michigan generated several rounds of heavy lake effect snow bands beginning on Friday the 7th and ending by the morning of Sunday the 9th. Areas in Berrien County, Michigan and La Porte and St. Joseph counties in Indiana were especially hard hit with many locations receiving 2 to 3 feet of snow by the time the event ended. |
 |
|
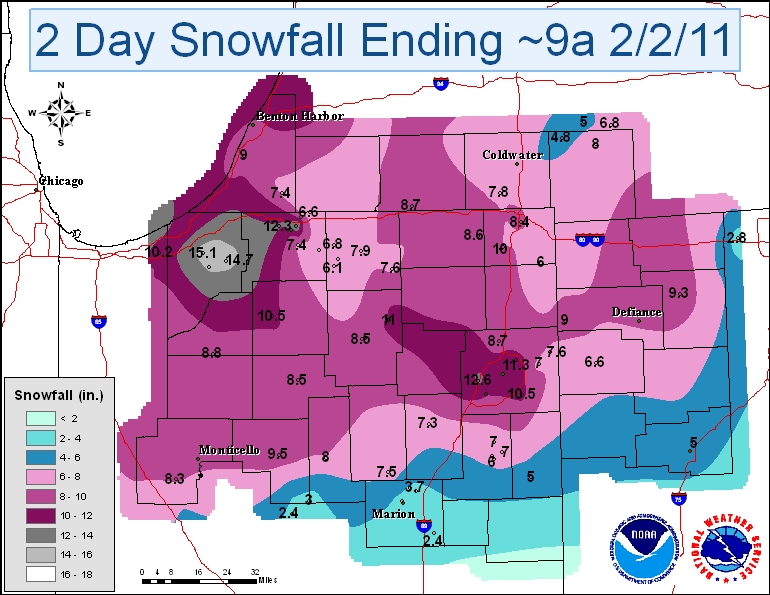
Average temperatures across the area were below normal in February 2011. Precipitation and snowfall were both above normal at Fort Wayne and South Bend, as the region was impacted by a few significant winter storms. One storm in particular brought blizzard conditions to the area on February 1st. The active weather pattern brought 18.3 inches of snowfall to Fort Wayne this month, which is 10.7 inches above normal, and ranks as the snowiest February at Fort Wayne in non leap years. February 2008 is the official snowiest February on record, with 19 inches of snowfall occurring over 29 days that month. |
February 1st BlizzardA quick-hitting blizzard affected much of northwest Ohio, northern Indiana, and southwest Lower Michigan during the late afternoon and evening hours of February 1st. |
 |
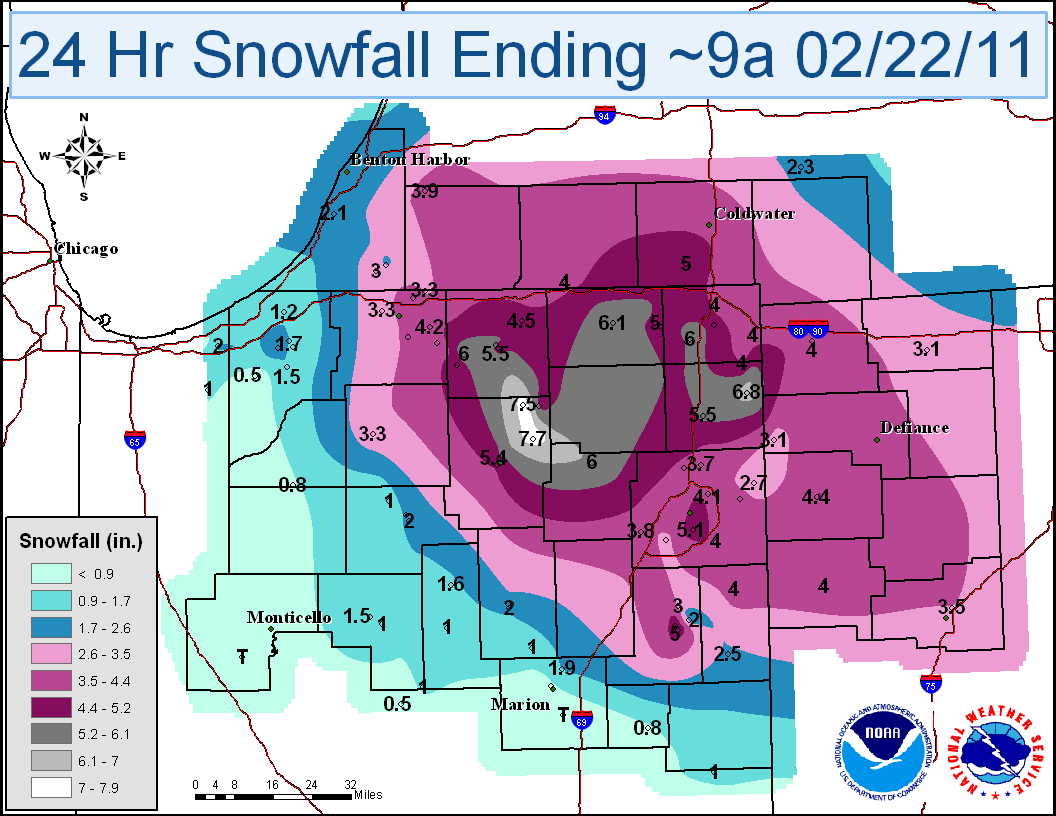
February 21st Snow StormA low pressure system tracked east across the Ohio Valley and brought a mixture of freezing rain, sleet, and snow to the forecast area. Heaviest hit areas received 3 to up to 8 inches of snow on February 21st. |
 |
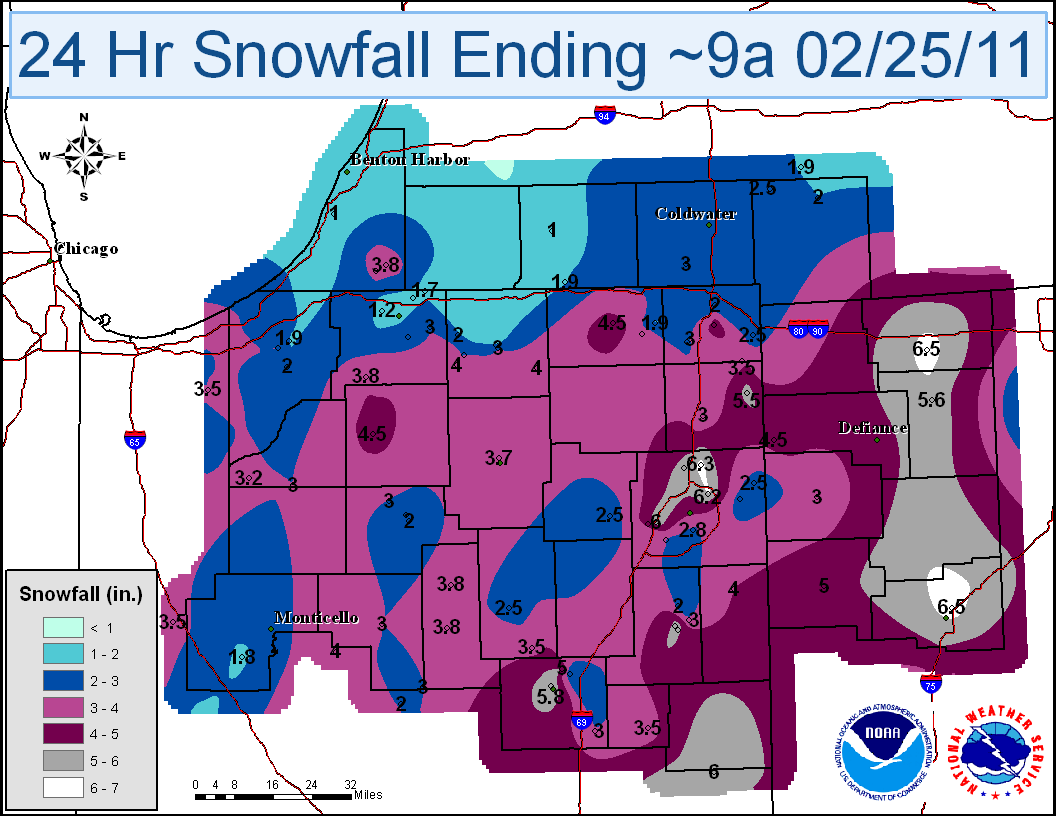
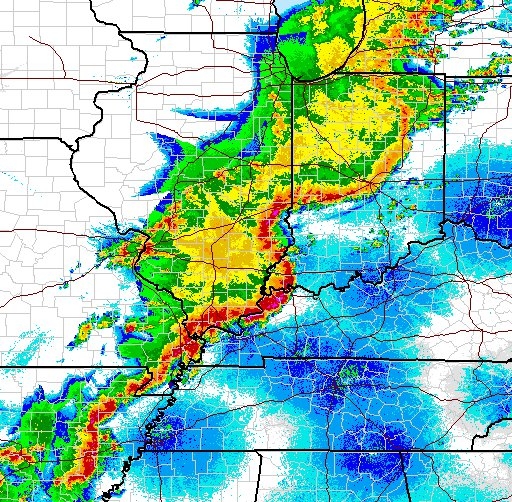
February 24th-25th Snow StormLow pressure, tracking from Arkansas the evening of the 24th, to southwestern Pennsylvania the morning of the 25th, brought a large area of snow to the forecast area. Several bands of moderate to locally heavy snow formed with snowfall rates of an inch or more per hour. The snow quickly ended by mid morning of the 25th. |
 |
|
March 2011 was a roller coaster month temperature wise, with stretches of above and below normal temperatures across the region. However, the average temperature for the month was slightly above normal at Fort Wayne and below normal at South Bend. Snowfall for the month was below normal, while precipitation was slightly above normal at Fort Wayne and below normal at South Bend. |
|
An active weather pattern brought above normal precipitation to the region during April 2011, with 7.23 inches of precipitation at South Bend ranking as the 4th wettest April on record. Average temperatures were near normal for the month across the area. The active weather pattern ushered in the return of severe weather across the region, with a severe weather event on April 19th-20th that produced 8 tornadoes across the NWS Northern Indiana CWA. |
April 19th-20th Severe WeatherA strong upper level system developed over the south central Plains on the afternoon of Tuesday, April 19th. This helped to intensify a strong surface low pressure system over Missouri that moved northeast into central Indiana during the evening hours. Storms, in the form of supercells, began to fire near the surface low in the afternoon in western Illinois and quicky merged a large line known as a LEWP (line echo wave pattern) with bowing segments. |
 |
|
May 2011 was a very wet month across the region. Fort Wayne received 10.17 inches of precipitation, making it the wettest May on record, and the second wettest month overall on record, behind 11.00 inches of precipitation in July 1986. South Bend received 7.59 inches of precipitation, making May 2011 the second wettest May on record, behind 8.09 inches of precipitation in May 2009. Average temperatures were generally above normal for the month across the area. |
May 25th Isolated TornadoesAn impressive upper low pressure system moved across the area on May 25th. Several upper level disturbances and a warm front trigged multiple rounds of severe thunderstorms that produced two tornadoes. |
 |
May 29th Severe WeatherThunderstorms developed across southern Iowa during the morning hours on Sunday. These storms intensified as they crossed the Mississippi River toward midday producing widespread wind damage. |
 |
|
Although June 2011 was a seasonable start to summer, with average temperatures across the area a degree or two above normal, the warmest temperatures in nearly a decade were observed across the area early in the month, foreshadowing what would be a very warm summer. The high temperature was 97 on the 4th, 7th and 8th at Fort Wayne, while the high temperature was 97 and 96 on the 7th and 8th respectively. The last time the temperature reached 97 degrees at Fort Wayne was July 31st, 1999. The last time the temperature reached 97 degrees at South Bend was August 21st, 2003. Precipitation was slightly below normal at Fort Wayne and slightly above normal at South Bend. |
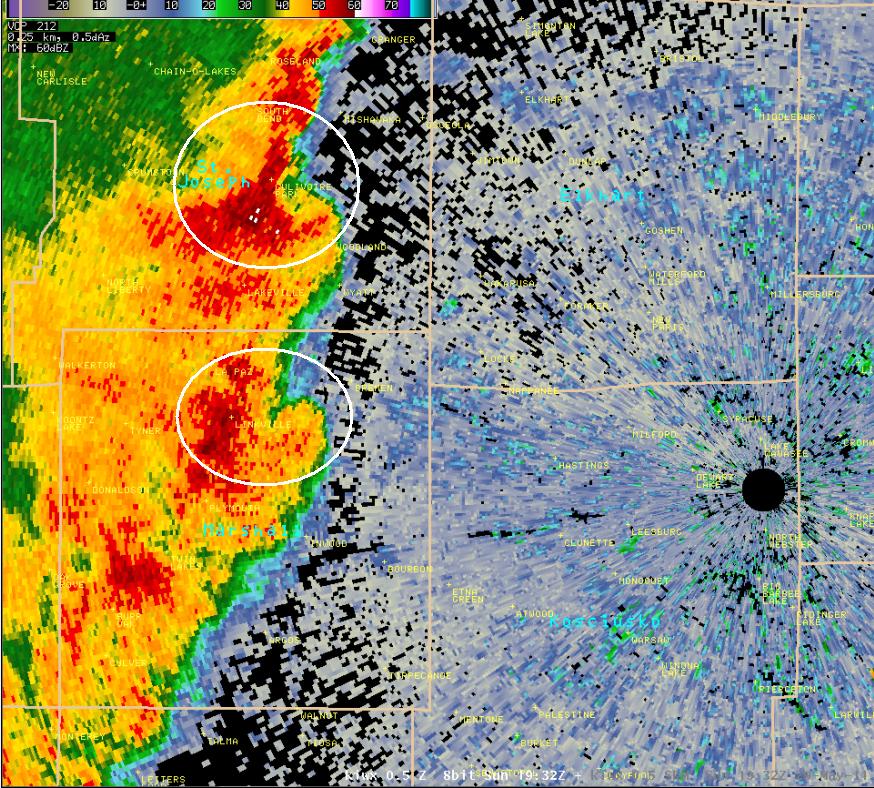
June 4th Severe WeatherSevere thunderstorms moved through the southwestern and southeastern portions of the forecast area during the afternoon and evening hours on June 4th. Many wind damage and hail reports were received. |
 |
June 10th Heavy Rain and Severe WeatherShowers and thunderstorms developed rapidly on the June 10th producing very heavy rainfall in excess of 3 inches across portions of the area as a low level warm front lifted northward across the area. |
.jpg) |
|
July 2011 will be remembered as one of the warmest months in recent memory across the area. A semi-active weather pattern early in the month gave way to a large ridge of high pressure across the central and eastern US during the last half of the month. This brought a heat wave across the region, with July becoming the warmest month on record at Fort Wayne, and the 8th warmest July on record at South Bend. The heat wave played a large part in keeping precipitation below normal across the area, becoming the 5th driest July on record at Fort Wayne, with only 0.98 inches of precipitation. |
July 2nd Severe WeatherA very warm and humid airmass overspread the region on July 2nd allowing for a very unstable air mass to be in place across the local area. An upper level disturbance from the upper Midwest combined with an advancing cool front and very high instability to produce severe thunderstorms across the area. |
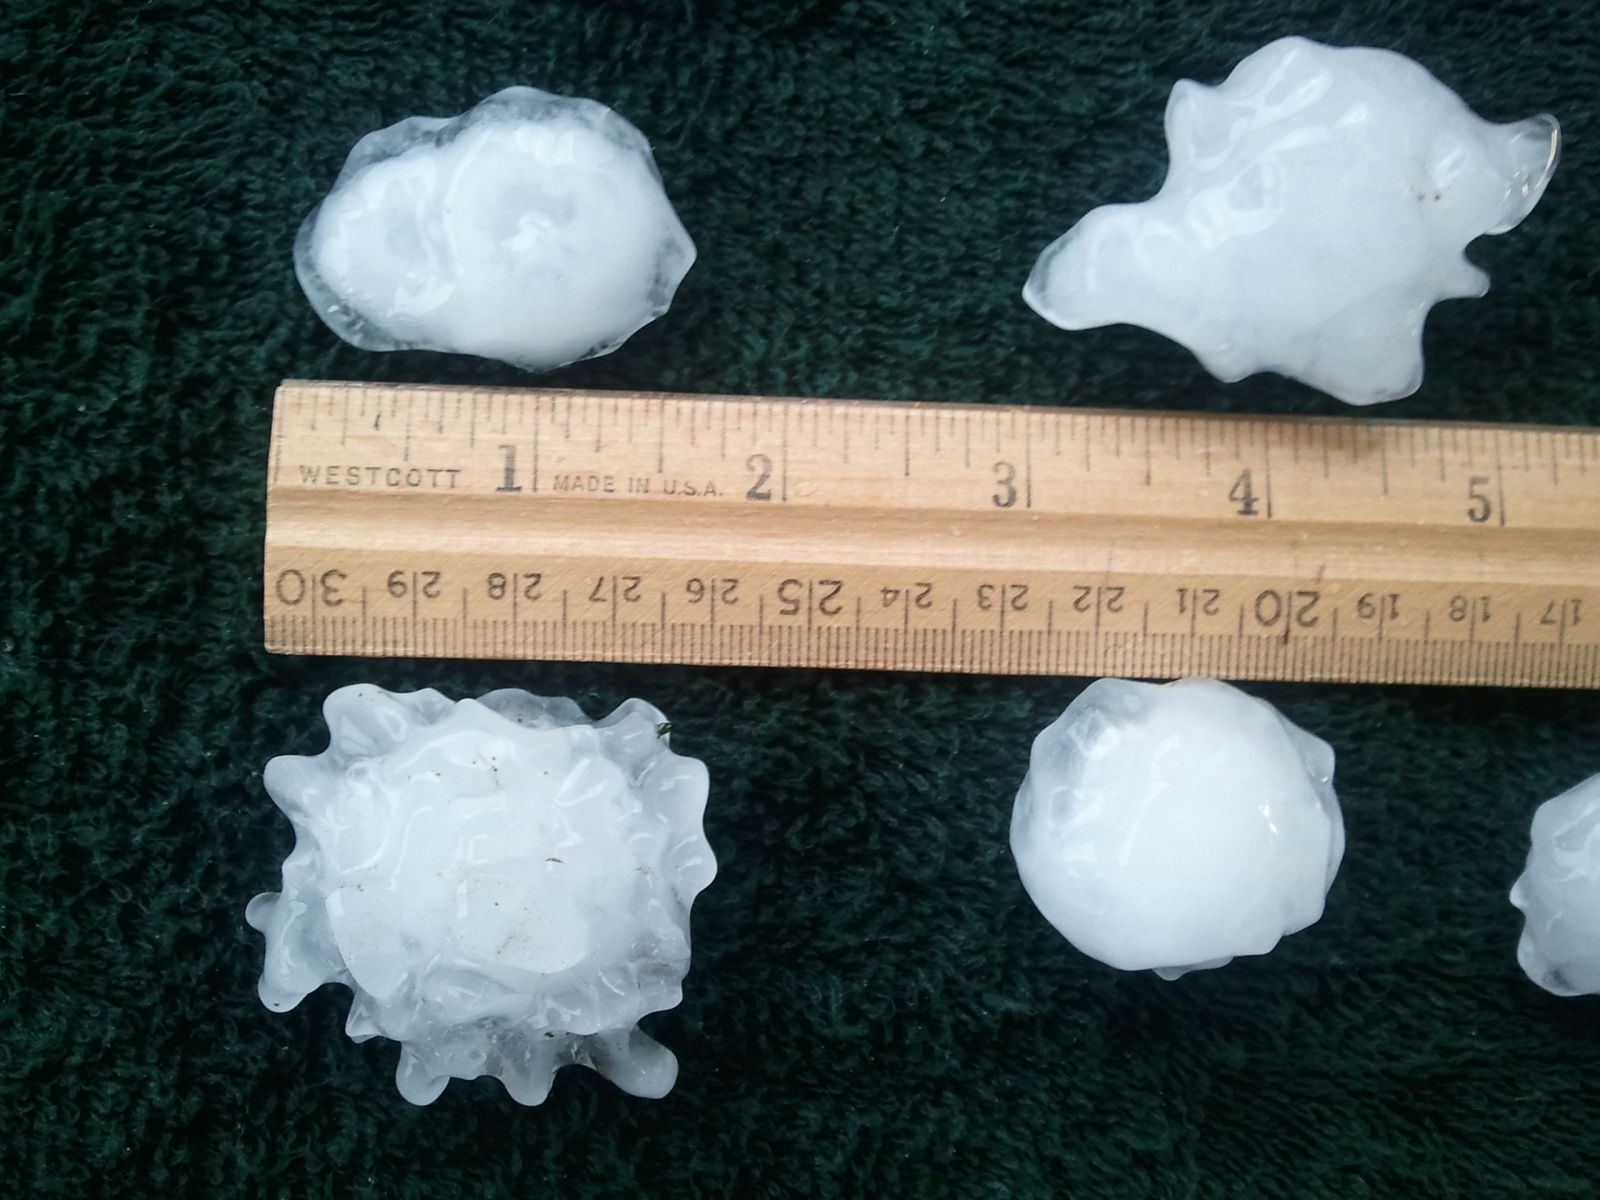 |
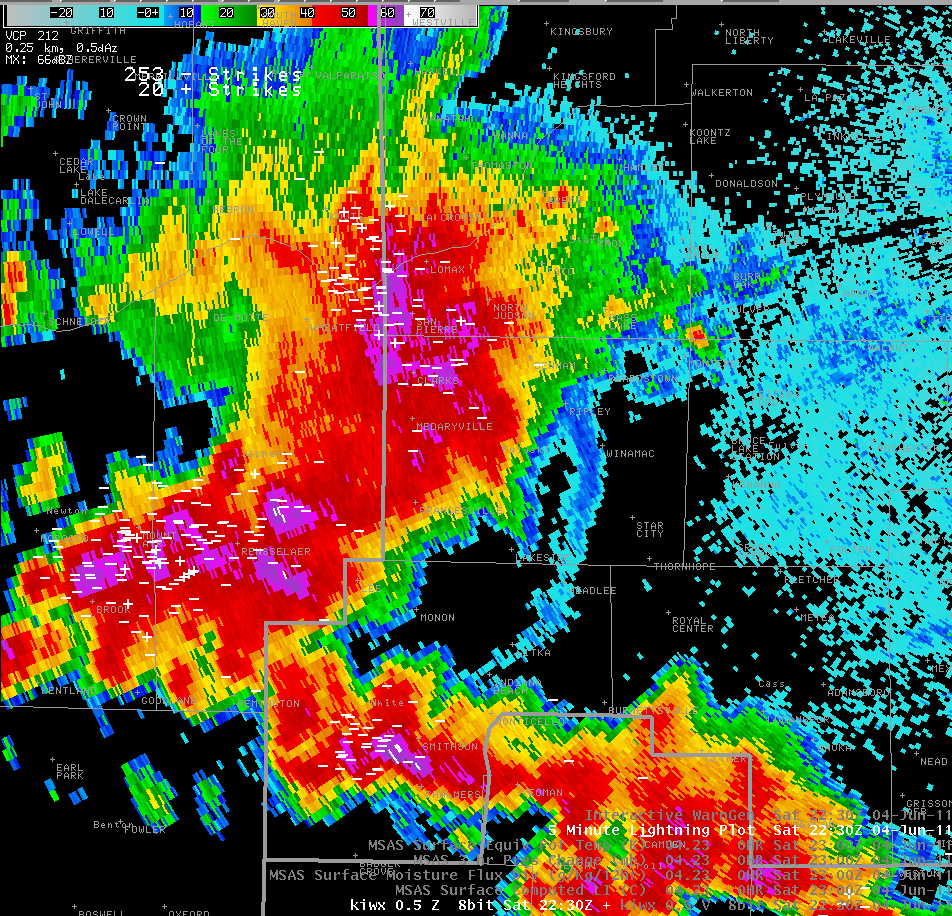
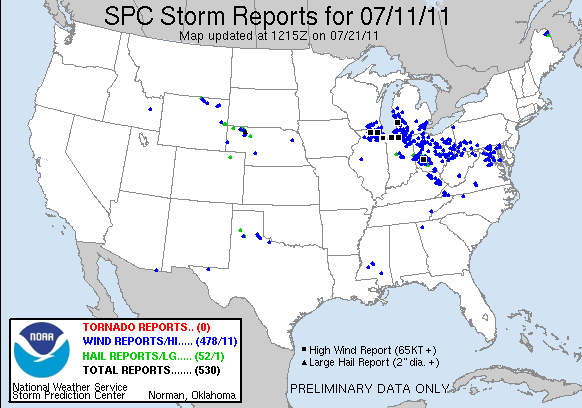
July 11th DerechoA complex of severe thunderstorms raced across the region on July 11, producing widespread wind damage in portions of northern Indiana, southern Michigan, and northwest Ohio. Winds gusted as high as 85 mph, with damage to structures and trees. The hardest hit part of the local area was along the Indiana and Michigan state line. |
 |
Late July Heat WaveA prolonged period of hot and humid conditions became entrenched across the region by late July. A large ridge of high pressure built across the Central United States and slowly drifted eastward through the Mississippi Valley into the Lower Great Lakes, causing well-above normal temperatures. |
 |
July 22nd Severe StormsAn outflow boundary from morning convection was the focus for thunderstorm development across it moved from Illinois into the area by the early afternoon hours. Daytime heating allowed for moderate instability to develop across the area. This combined with an area of convergence was enough to develop scattered thunderstorms, some of which became severe rather rapidly. These storms produced heavy rainfall and wind damage across the area. |
|
August 2011 was a rather quiet end to summer. Average temperatures were a degree or two above normal across the area, with precipitation below normal for the month. August 2011 brought change to climate keeping records. Climate normals are calculated using a 30 year period, with the previous normals from a 1971-2000 period. These climate normals were recalculated using data from a 1981-2010 period, and became the new normals used in our climate products. You can read more about climate normals by visiting the National Climatic Data Center website. |
August 24th Severe StormsA late summer cold front sparked thunderstorms across the area. The main reports of damage were from strong to severe winds and lightning in NW Ohio. |
 |
|
After a very warm start to September 2011, temperatures cooled considerably, and average temperatures ended up below normal across the area. Much needed precipitation fell across the area throughout the month, after a significantly dry July and August. Precipitation totals for the month ended up above normal at both Fort Wayne and South Bend. This was largely due to the return of La Nina conditions across the equatorial eastern Pacific Ocean. |
September 27th Weak Tornado/Cold Air FunnelA National Weather Service survey team confirmed EF-0 tornado damage on the east side of Nappanee. The tornado touched down approximately 2 miles east of downtown between county roads 7 and 9 along US 6 at approximately 12:56 P.M on Tuesday, September 27th. Fall tornadoes are not uncommon in Northern Indiana although the environmental conditions under which this tornado formed are actually quite rare. |
 |
|
October 2011 was a tale of two months across the area. After dry conditions and a warm spell during the first part of the month, a more active weather pattern brought wet conditions and more seasonable temperatures. Average temperatures ended up above normal for the month across the area, and precipitation was above normal at Fort Wayne and South Bend. |
|
October 2011 was a quiet month for severe weather, however past Octobers have yielded some of the most significant severe weather outbreaks that our area has ever seen. Last October, a strong cold front pushed through the region on the 26th, bringing a line of severe thunderstorms through the area producing 13 tornadoes. 10 year earlier, a deadly tornado outbreak impacted the region on the 24th, with several strong tornadoes across the area. For more information about this event and previous October outbreaks, visit this webpage. |
|
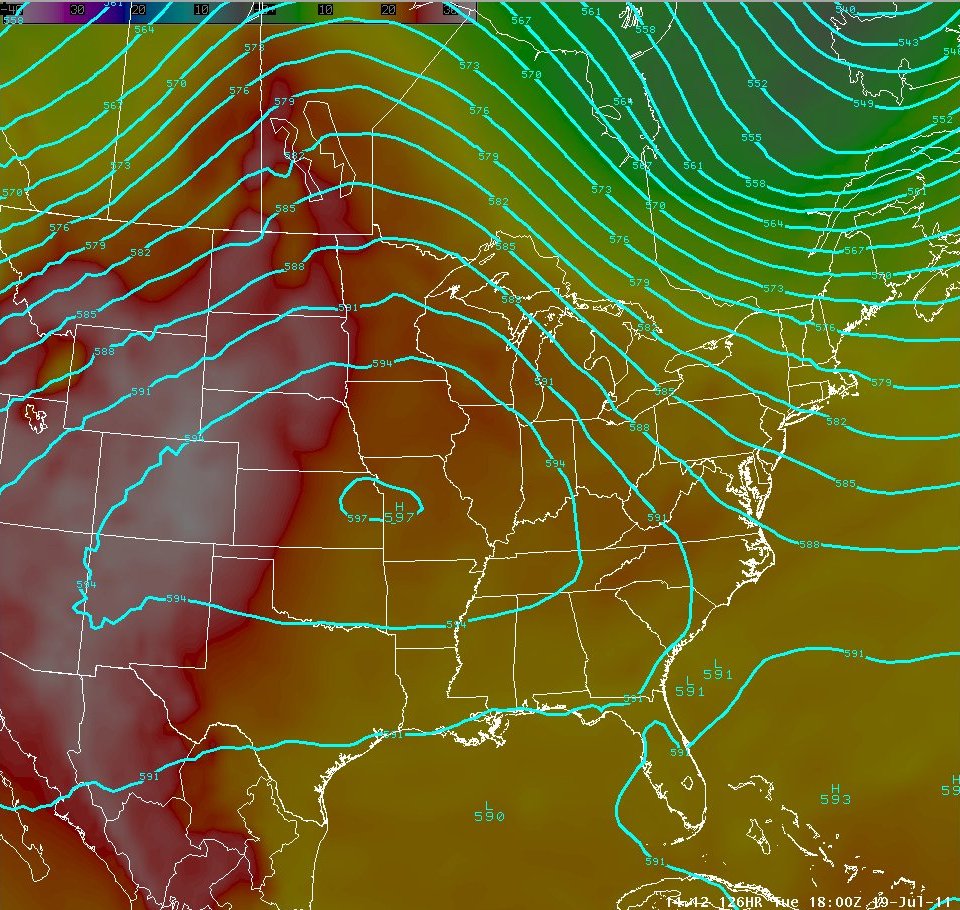
November 2011 was not only a particularly warm month, but also a wet month across the region as La Nina conditions continued to strengthen. Precipitation values and average temperatures were above normal at both Fort Wayne and South Bend, with the T-6th warmest November on record at Fort Wayne and the 9th warmest November on record at South Bend. A late November snowstorm brought up to 10 inches across Northern Indiana and Southwest Lower Michigan, and helped bring snowfall totals above normal for the month at Fort Wayne. Ironically, South Bend was missed by this storm, and only recorded a trace of snowfall for the month. This made 2011 only the 6th year on record with no measurable snowfall before December 1st. |
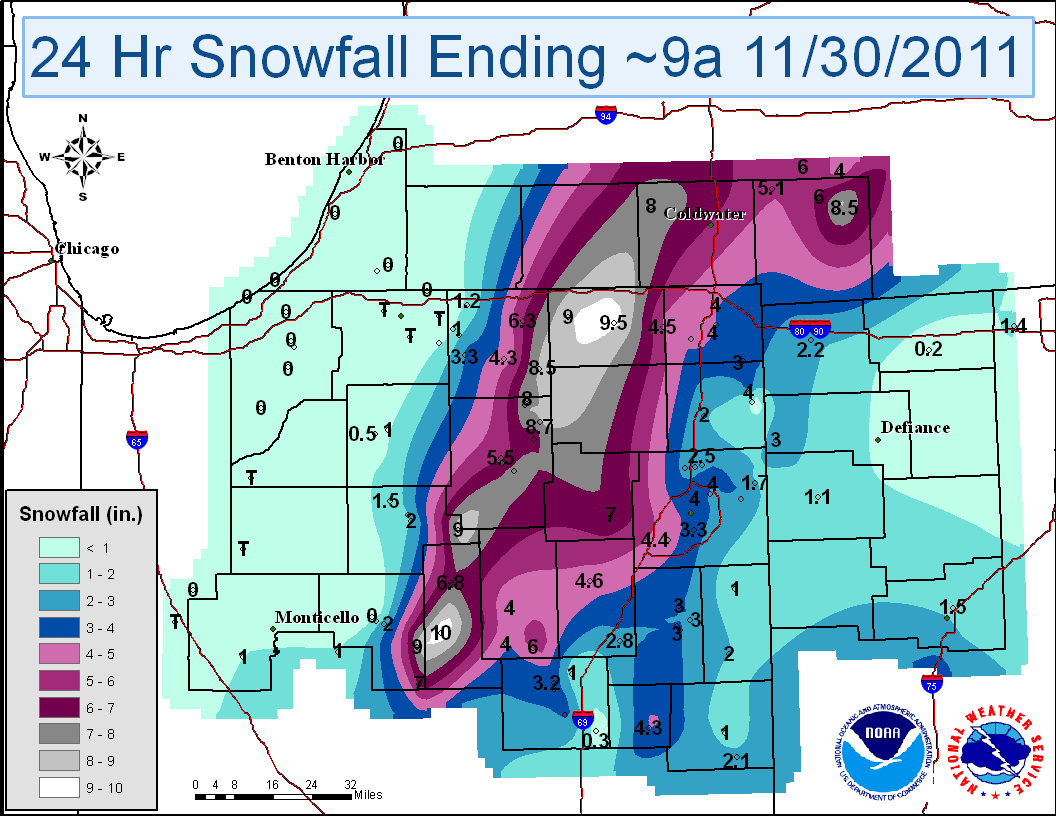
November 29th Snow StormRain changed to snow after a brief period of sleet on the afternoon of November 29th. The snow became heavy during the afternoon before ending Tuesday night. The heaviest snow fell generally along and either side of a Logansport to Angola line, where 6 to as many as 10 inches of snow were reported. Numerous reports of accidents and slide-offs were received with numerous power outages from the wet heavy snow accumulating on power lines and trees. |
 |
|
The winter season had an unusual start in December 2011, as average temperatures were well above normal across the area. South Bend did not receive a measurable snowfall until the 9th of the month, becoming the T-3rd latest measurable snowfall on record. This was mainly due to the lack of any significant cold air which resulted in no lake effect snow. Precipitation was above normal at Fort Wayne and normal at South Bend. Above normal temperatures helped contribute to below normal snowfall at both Fort Wayne and South Bend. |
| Records Tied or Broken in 2011 at Fort Wayne | ||||
| Date | Record Type | New Record | Old Record | Old Date |
| January 11 | Daily Max Snowfall | 5.5 in. | 4.2 in. | 1918 |
| February 1 | Daily Max Snowfall | 4.9 in. | 3.9 in. | 2008 |
| February 17 | Daily Max Low Temperature | 43 | 43 | 1911 |
| April 10 | Daily Max Temperature | 84 | 84 | 1930 |
| May 12 | Daily Max Temperature | 88 | 86 | 1991 |
| May 23 | Daily Max Precipitation | 1.91 in. | 1.56 in. | 1988 |
| May 25 | Daily Max Precipitation | 3.46 in. | 2.31 in. | 1997 |
| May | Wettest May | 10.17 in. | 8.80 in. | 1987 |
| Spring | Wettest Spring (March, April, May) | 18.50 in. | 16.66 in. | 1991 |
| June 4 | Daily Max Temperature | 97 | 96 | 1934 |
| June 7 | Daily Max Temperature | 97 | 97 | 1933 |
| June 8 | Daily Max Temperature | 97 | 96 | 1933 |
| July 21 | Daily Max Low Temperature | 76 | 76 | 1934 |
| July 28 | Daily Max Low Temperature | 78 | 75 | 1921 |
| July | Warmest Monthly Average Temperature | 79.8 | 79.5 | 1955 |
| September 3 | Daily Max Temperature | 95 | 95 | 1898 |
| October 19 | Daily Max Precipitation | 2.19 in. | 0.84 in. | 1989 |
| November 26 | Daily Max Temperature | 65 | 65 | 1908 |
| November 29 | Daily Max Precipitation | 2.53 in. | 1.43 in. | 1919 |
| Records Tied or Broken in 2011 at South Bend | ||||
| Date | Record Type | New Record | Old Record | Old Date |
| January 1 | Daily Max Temperature | 55 | 55 | 1897 |
| January 7 | Daily Max Snowfall | 10.6 in. | 6.0 in. | 1918 |
| January 8 | Daily Max Snowfall | 26.0 in. | 7.9 in. | 1978 |
| January 8 | All Time Single Day Max Snowfall | 26.0 in. | 20.0 in | 1/30/1978 |
| January 8 | All Time Two Day Max Snowfall* | 36.6 in. | 29.0 in. | 1/31/1978 |
| February 1 | Daily Max Snowfall | 4.9 in. | 3.9 in. | 2008 |
| February 17 | Daily Max Low Temperature | 48 | 42 | 1987 |
| February 20 | Daily Max Precipitation | 0.88 in. | 0.78 in. | 1997 |
| April 10 | Daily Max Low Temperature | 59 | 58 | 1922 |
| April 26 | Daily Max Precipitation | 1.25 in. | 0.90 in. | 1904 |
| May 25 | Daily Max Precipitation | 2.25 in. | 1.60 in. | 1950 |
| July 21 | Daily Max Low Temperature | 77 | 76 | 1930 |
| July 28 | Daily Max Low Temperature | 75 | 75 | 1941 |
| September 2 | Daily Max Low Temperature | 75 | 73 | 1961 |
| October 19 | Daily Max Precipitation | 1.81 in. | 1.02 in. | 1923 |
| December 14 | Daily Max Precipitation | 1.30 in. | 1.01 in. | 1975 |
| *Two Day Snowfall Ending This Day | ||||
NG/CEO/SC/SLL

