|
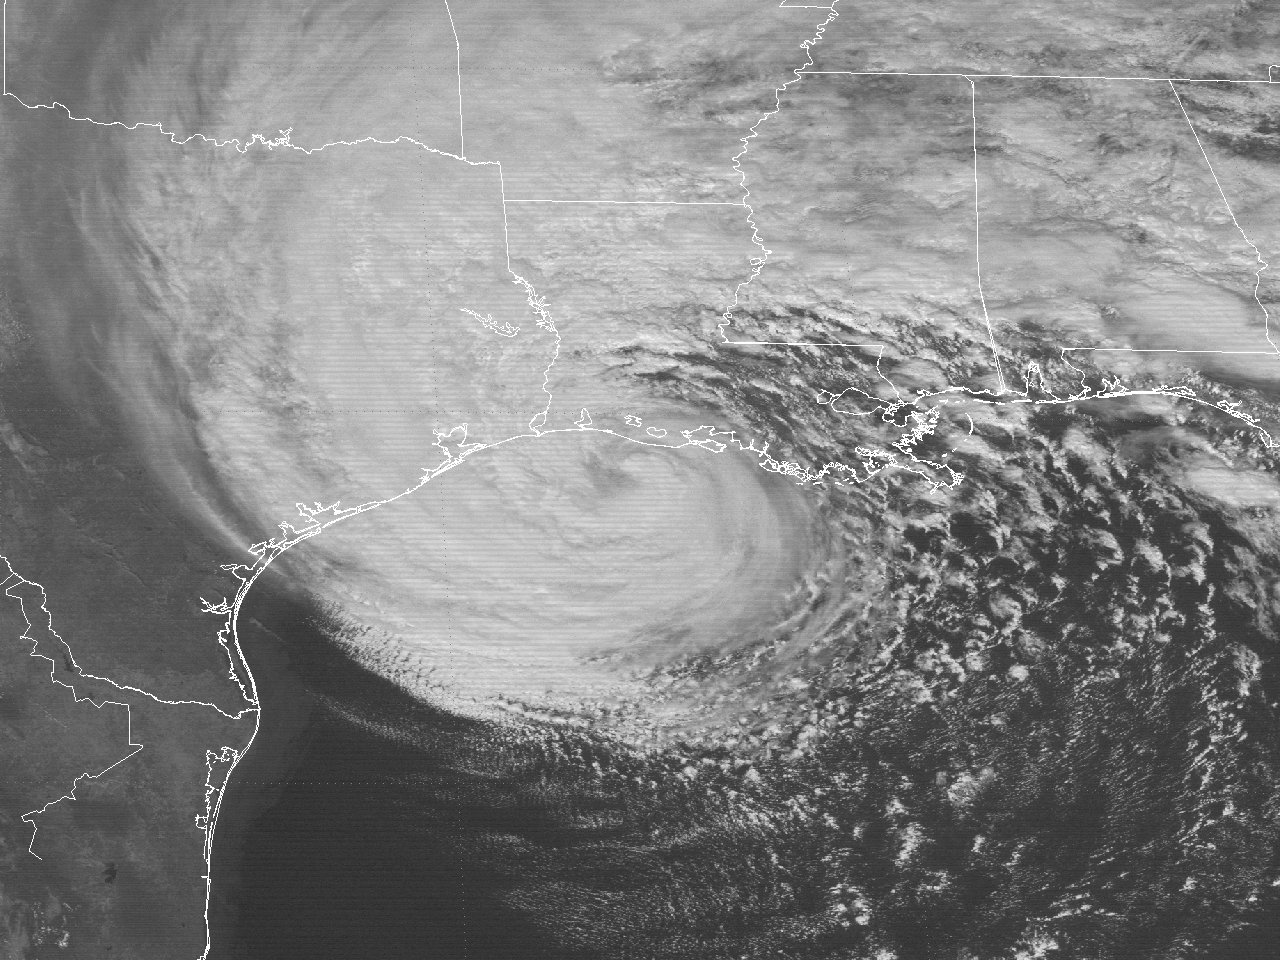
Above: GOES-6 visible satellite image of Hurricane Juan at maximum intensity off the Southwest Louisiana coast at 12:30 PM CST October 28, 1985.
Hurricane Juan originated from a broad surface trough of low pressure over the Central Gulf on October 24th, likely the result of an approaching upper level trough from Texas and a westward moving tropical wave from the Caribbean Sea. Satellite imagery showed a marked increase in showers and thunderstorms on October 25th, with the formation of Tropical Depression #11 later that evening over the Central Gulf.
By daybreak on October 26th, satellite classifications indicated that the depression had strengthened, being upgraded to Tropical Storm Juan at this time. NOAA reconnaissance aircraft investigated Juan later that afternoon and confirmed the upgrade. They also found a large center with light and variable winds and the strongest winds far from the center, exhibiting some characteristics of a subtropical storm. The mid to upper level pattern was generally characterized by a broad and weak low pressure area over the Gulf. Steering currents were very weak over Juan, initially moving erratically to the southwest, and then drifting to the northeast through the morning hours of October 27th. By 2 PM CST, reconnaissance aircraft, along with buoys and oil platforms all confirmed Juan had grown in size and strengthened further to a minimal hurricane, moving northward at 10 to 15 mph towards the Louisiana coast.
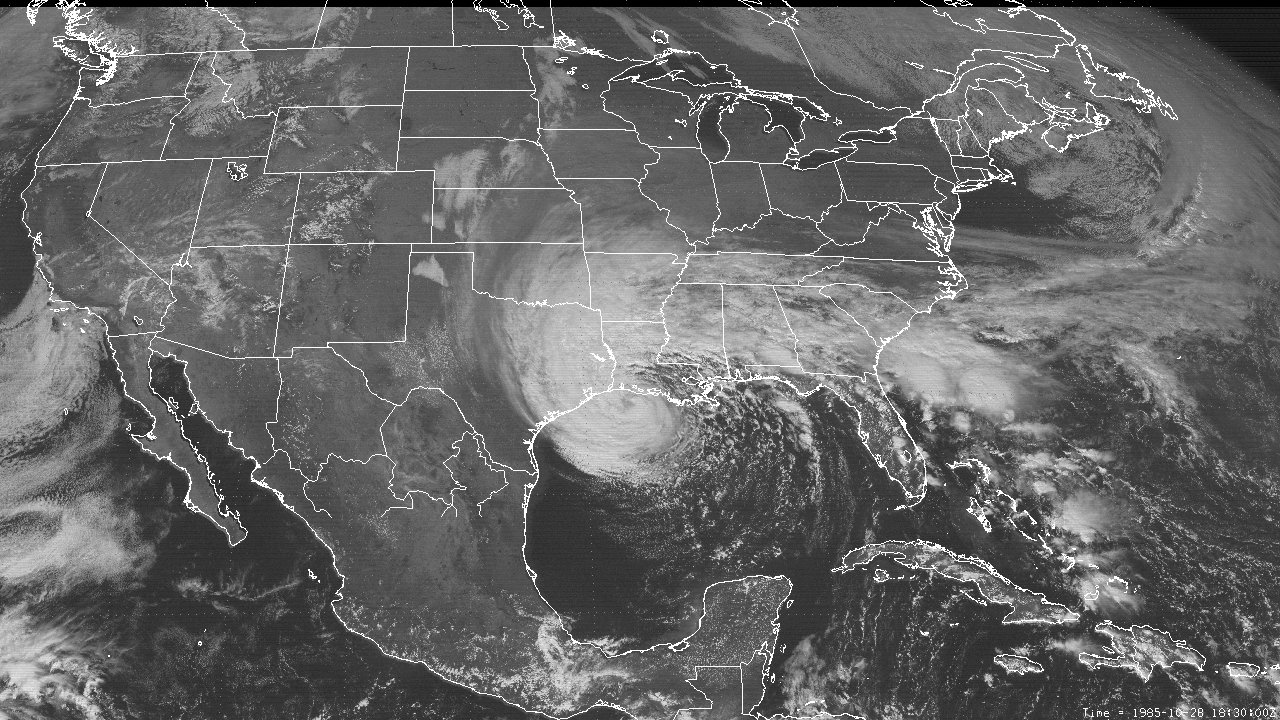
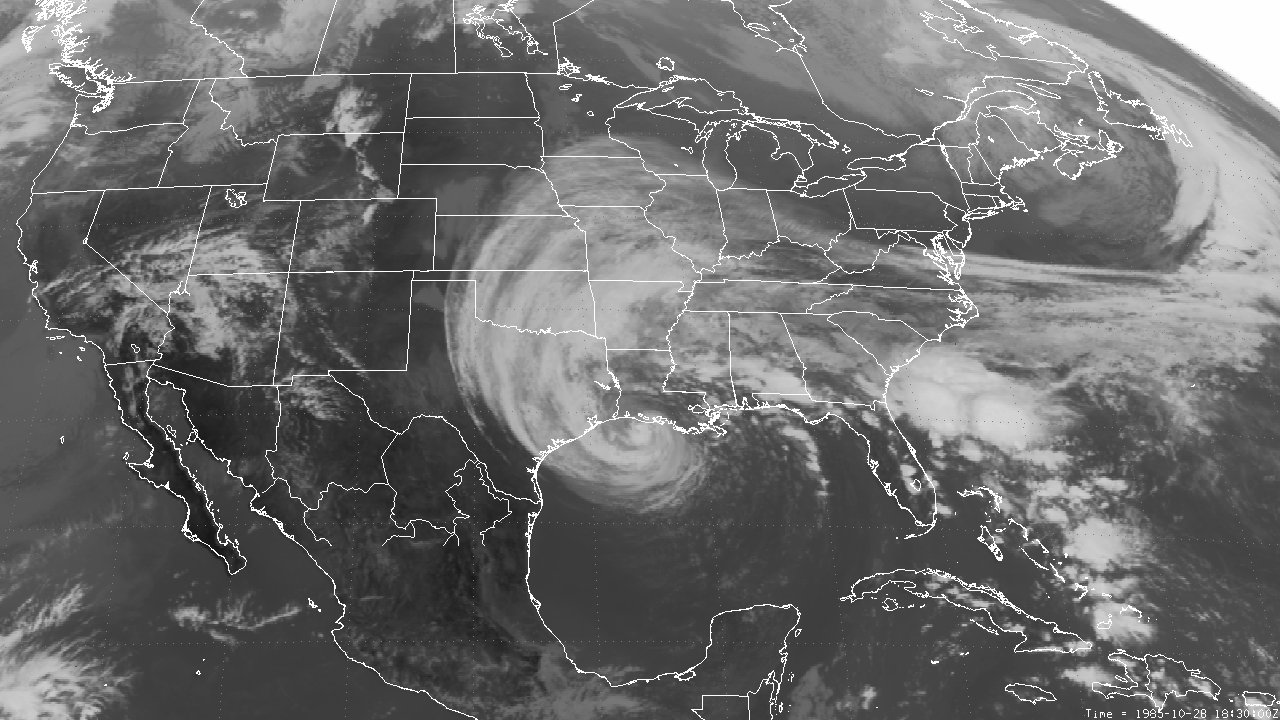
Hurricane Juan continued to slowly intensify the evening of October 26th, reaching an intensity of 85 mph (75 knots), despite being underneath the weak upper level low over the Gulf. Juan began to move north-northwest during the evening hours, and northwest by daybreak on October 27th, just offshore the South-Central Louisiana coast. Juan drifted west just off the Louisiana coast for the remainder of the morning. Hurricane Juan maintained maximum sustained winds of 85 mph (75 knots) and reached a minimum sea level pressure of 971 millibars (28.67 inches) while located just southeast of Cameron, Louisiana. A GOES-6 visible and infrared satellite image at 12:30 PM CST October 28th shows Hurricane Juan just off the Southwest Louisiana coast. This was as far west that Hurricane Juan reached, as it began to drift back to the southeast later that afternoon and east later that evening.
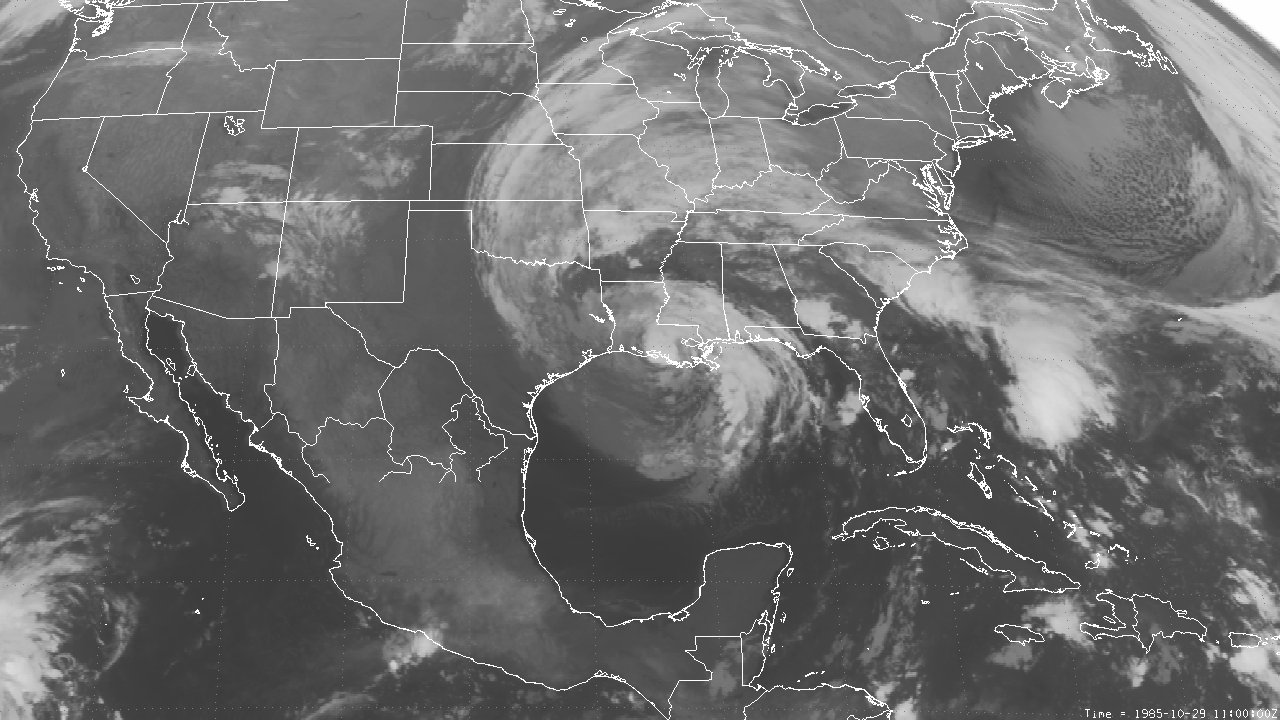
During the early morning hours of October 29th, Juan moved to the northeast, completing the first counterclockwise loop. Slightly weaker, Hurricane Juan finally made landfall across St. Mary Parish south of Patterson, Louisiana around 5 AM CST with maximum sustained winds of 75 mph (65 knots) and a minimum sea level pressure of 974 millibars (28.76 inches), as shown by this GOES-6 infrared satellite image. Shortly after landfall, Juan began to move northward across the Atchafalaya Basin, and northwest towards Lafayette, Louisiana. By the afternoon hours, Juan had weakened to a tropical storm, and was beginning to move westward centered just north of Lafayette. Juan began to drift south later that evening and overnight.
Juan re-emerged back across the Gulf by daybreak on October 30th, and began to drift southeast and east just south of the Southeast Louisiana coast for the remainder of the day, completing the second counterclockwise loop. Juan strengthened slightly to 70 mph (60 knots) by the time it reached the Mouth of the Mississippi River around 5 AM CST October 31st. Moving northeast, Tropical Storm Juan made its final landfall near Gulf Shores, Alabama around Noon that day with maximum sustained winds of 65 mph (55 knots). Tropical Storm Juan slowly weakened as it moved northward across Alabama for the remainder of the day into the early morning hours of November 1st. Juan became extratropical by daybreak as it crossed into Tennessee. Click here for an interactive track of Hurricane Juan.
The slow and erratic motion of Juan, especially making two counterclockwise loops from October 28-30th, as well as the large size of the storm, made for a forecasting nightmare. All of the Gulf coast from Brownsville to the Florida Panhandle had at least Gale Warnings for several days, and areas from Port Arthur, TX to Mobile, Alabama were under Hurricane Warnings for two days. The quick development and interaction with high pressure to the north, even before attaining tropical storm status, increased winds and seas rapidly across the Northern Gulf. This made evacuation of maritime interests very difficult.
Hurricane Juan caused about 1.5 billion in damages and twelve deaths. Most occurred over Southern Louisiana due to storm surge and freshwater flooding of homes, as well as damage to the oil and maritime industry offshore. Nine of the twelve deaths caused by Juan was attributed to the toppled rigs and boats lost at sea transporting the oil workers.
WIND & PRESSURE:
Due to the large size of Juan, tropical storm force gusts occurred across most locations across coastal Texas, Louisiana, Mississippi, Alabama, and the Florida Panhandle, with the highest land-based gust of 63 mph reported at Pensacola, Florida with the final landfall on October 31st. The only hurricane force winds recorded were from oil rigs off the Louisiana coast. The highest wind gust recorded across our region was 52 mph (45 knots) at Cameron, Louisiana around 12:12 PM CST October 28th. Due to the close proximity to the center of Hurricane Juan, minimal sea level pressures recorded at the primary airport observation sites and National Weather Service offices ranged from 982 to 992 millibars. Lower pressure likely occurred along the coast, but were not available due to the lack of observations there. For complete meteorological statistics, see the Wind and Pressure section.
STORM SURGE:
Tides of 4 to 5 feet MSL occurred across the Louisiana coast from the Atchafalaya river westward to the Upper Texas coast. Higher tides of 5 to 8 feet occurred east of the Atchafalaya river across Southeast Louisiana. For other storm surge and high-water marks, see the Storm Surge section.
RAINFALL:
Heavy rainfall and flash flooding were reported due to the slow movement of Juan yielding rainfall for multiple days. Around 10 to 15 inches of rainfall occurred across Central and Southern Louisiana during this period, with the highest total of 15.21 inches recorded at Jennings, Louisiana. Further west across Southeast Texas, around 5 to 10 inches of rainfall was recorded. For complete rainfall totals reported across our region, see the Rainfall section.
TORNADOES:
No tornadoes were reported in Louisiana or Texas.
|


