|

Above: GOES-6 visible satellite image of Hurricane Bonnie south of the Louisiana coast at 5:30 PM CDT June 25, 1986.
Bonnie had its origin as a mid to upper level disturbance along a nearly stationary frontal zone across North Florida and the Northeast Gulf the third week of June. By June 20th, the mid to upper level vortex began to appear across the lower layers of the atmosphere, and by June 22nd, a clear low-level vortex was observed just west of Sarasota, Florida. The low-level center continued to move to the southwest and then west with little convection across the Eastern Gulf through the early morning hours of June 23rd. By daybreak, shower and thunderstorm activity increased significantly, and by that afternoon had enough organization to be classified as Tropical Depression #2. With a mid to upper level high pressure ridge over the Central and Gulf States, the depression moved on a slow west to west northwest motion around 5 mph through June 24th. By the late morning hours of June 24th, an Air Force reconnaissance flight found surface winds of 45 mph (40 knots), thus was upgraded to Tropical Storm Bonnie by 11 AM CDT.
Tropical Storm Bonnie continued to strengthen for the remainder of June 24th into the morning hours of June 25th, aided by the improved upper level outflow over the storm. The mid to upper level ridge over the Central United States to the Northern Gulf began to shift eastward, allowing Bonnie to move towards the west northwest and then northwest around 5-10 mph. By the late morning hours of June 25th, an Air Force reconnaissance flight found surface winds of 75 mph (65 knots), thus was upgraded to Hurricane Bonnie by 11 AM CDT. A GOES-6 visible satellite image at 5:30 PM CDT June 25th shows Hurricane Bonnie about 140 miles south of the South-Central Louisiana coast. Hurricane Bonnie remained a small hurricane with the radius of hurricane force winds only 45 miles wide, and tropical storm force winds extending about 85 miles to the north and east of the center.
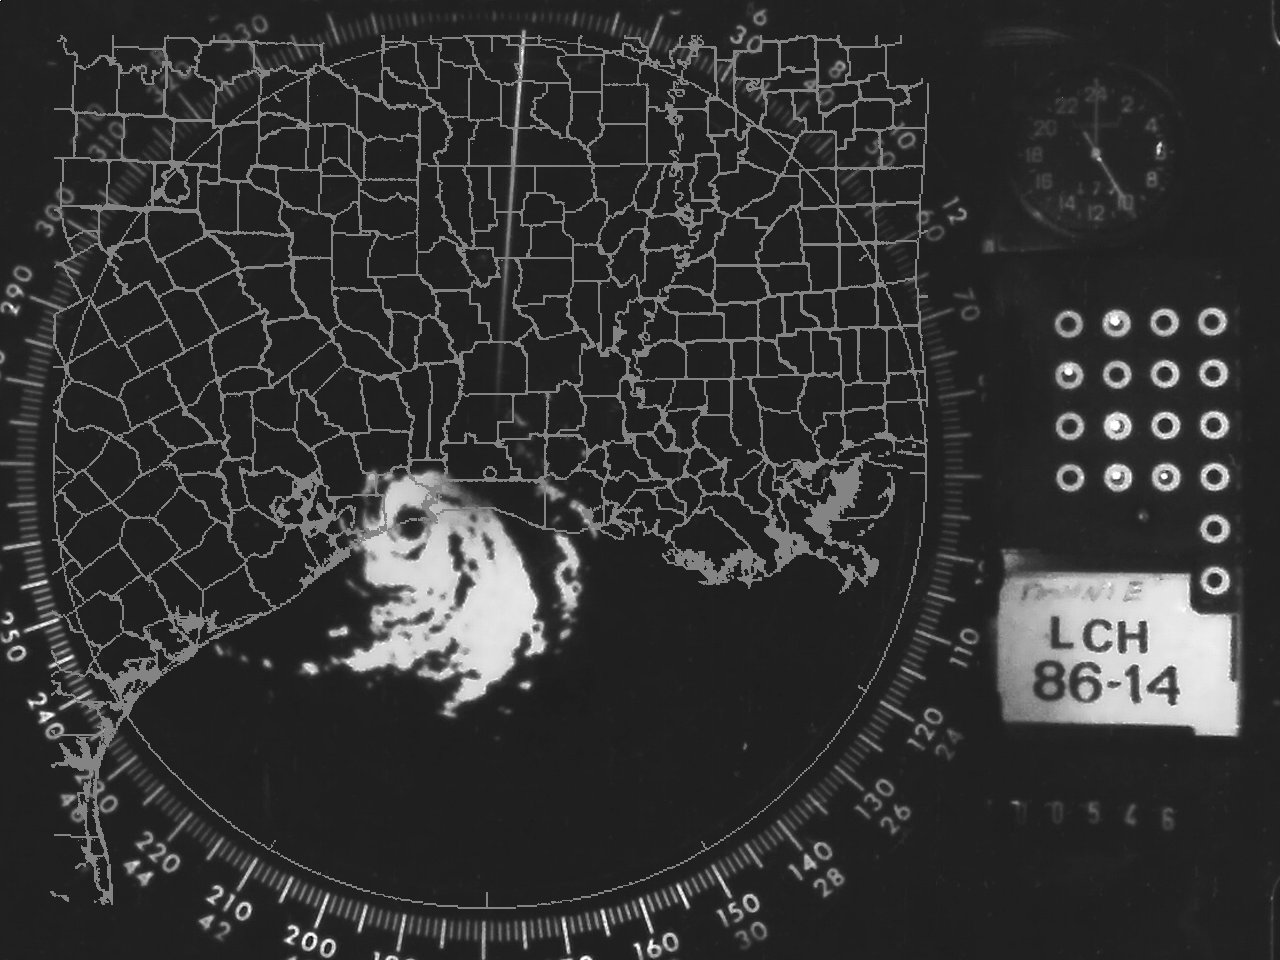
Hurricane Bonnie continued to slowly strengthen the evening of June 25th into the early morning hours of June 26th and moved north northwest around 10 to 15 mph towards the Southwest Louisiana and Southeast Texas coast. Hurricane Bonnie made landfall near Sea Rim State Park in Jefferson County Texas around 5 AM CDT June 26th as a category one hurricane with maximum sustained winds of 85 mph (75 knots) and a minimum central pressure of 990 millibars (29.23 inches). A GOES-6 infrared satellite image at 4:30 AM CDT and the National Weather Service Lake Charles, Louisiana WSR-57 radar image at 5:00 AM CDT June 26th shows Hurricane Bonnie near landfall. After landfall, Bonnie began to move to the north as it weakened across East Texas, being downgraded to a tropical storm by 9 AM CDT just northwest of Beaumont, and a tropical depression by 5 PM CDT near Lufkin. Tropical Depression Bonnie continued to move north across Northeast Texas that evening into the early morning hours of June 27th, and across Arkansas for the remainder of the day before dissipating across Southeast Missouri by daybreak on June 28th. Click here for an interactive track of Hurricane Bonnie.
Even though Hurricane Bonnie was a small hurricane, it managed to cause moderate wind damage across Jefferson and Orange Counties, as well as western Cameron Parish across Southwest Louisiana. Numerous trees were uprooted, powerlines and poles were broken or downed with extended power outages, and extensive tree limb breakage. Signs and billboards were toppled, along with damage to roofs, plate glass, mobile homes, barns and lighter structures.
Across coastal Jefferson County Texas near and east of where the eye made landfall, storm surge and high wave action caused beach erosion and damage to Texas State Highway 87 between High Island and Sabine Pass. Minor beach erosion was noted across Cameron Parish in Southwest Louisiana.
WIND & PRESSURE:
Due to the small size of Bonnie, hurricane force winds were confined over Jefferson and Orange Counties, with tropical storm force winds further north across Southeast Texas and eastward across Cameron and Calcasieu Parishes in Southwest Louisiana. At Sea Rim State Park, Texas, a maximum sustained wind of 77 mph (67 knots), peak gust of 98 mph (85 knots), and a minimum sea level pressure of 990.5 millibars (29.25”) were recorded between 5 and 6 AM CDT June 26th. The National Weather Service in Port Arthur, Texas measured maximum sustained winds of 55 mph (48 knots) and a peak wind gust of 76 mph (66 knots) shortly before 8 AM CDT June 26th. At Sabine Pass, maximum sustained winds of 63 mph (55 knots) was observed, but no gusts were noted. Cameron, Louisiana measured maximum sustained winds of 54 mph (47 knots) and a peak wind gust of 62 mph (66 knots) between 5:30 and 6:30 AM CDT June 26th. Across Central and South-Central Louisiana, no tropical storm force winds were observed. For complete meteorological statistics, see the Wind and Pressure section.
STORM SURGE:
Across coastal Jefferson County Texas near and east of where the eye made landfall, storm tides were estimated to range from 5 to 7 feet MSL, with 5.4 feet MSL measured at Sabine Pass. Further east, a tide of 3.9 feet MSL was measured at Cameron, Louisiana, with tides of 4 to 5 feet MSL experienced from Sabine Pass to Cameron, and 2 to 3 feet MSL eastward along the remainder of the Louisiana Coast. For other storm surge and high-water marks, see the Storm Surge section.
RAINFALL:
Rainfall of 3 to 6 inches was measured across Southeast Texas near and to the right of where Bonnie tracked. The highest rainfall measured across Southeast Texas was 6.10 inches at Warren. Across Central and Southern Louisiana, rainfall varied greatly between less than an inch to just over 5 inches due to the various spiral rain bands associated with Bonnie. Further north across Northeast Texas, Northwest Louisiana, and Southern Arkansas, rainfall ranged from 5 to 13 inches with the highest total of 13 inches reported at Ace, Texas. For complete rainfall totals reported across our region, see the Rainfall section.
TORNADOES:
Several tornadoes were observed across Southeast Texas and Louisiana associated with Bonnie. The strongest tornado was rated an F2 near Springhill, Louisiana in Webster Parish around 7 PM CDT June 27th, causing 5 injuries and a quarter of a million in damages. Details on the tornadoes that occurred across Southeast Texas are unavailable. For complete details on the tornadoes reported across Louisiana, see the Tornadoes section.
Above: NWS Lake Charles, LA WSR-57 radar animation of Hurricane Bonnie from 7:00 AM CDT June 25, 1986 through 1:00 PM CDT June 27, 1986.
|


