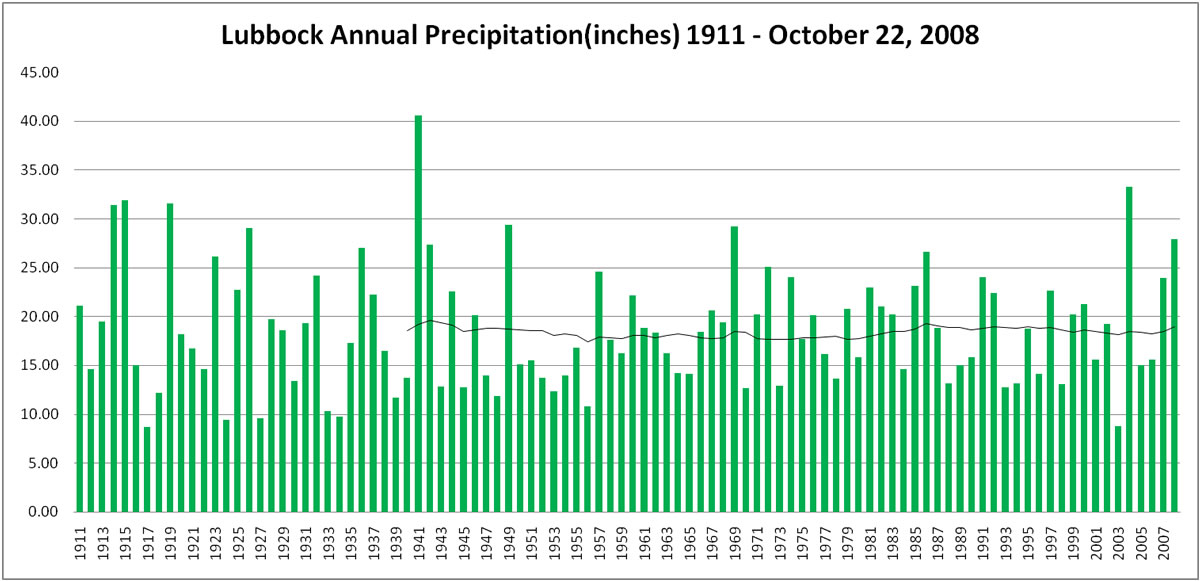
Below is a graph of the official precipitation recorded for Lubbock from 1911 through October 22, 2008. Over this 97 year record, the average annually accumulation of rain, melted snow and ice is about 18.6 inches. The amounts varied from a scant 8.73 inches in 1917 to 40.55 inches in 1941. In recent years, our extremes included the second driest year with 8.81 inches in 2003, followed by the second wettest year of record in 2004 with 33.25 inches. This year, 2008, we’ve already recorded 27.91 inches (as of October 22nd), making it the 9th wettest year on record, but is also noteworthy since it’s the second greatest amount since 1970.
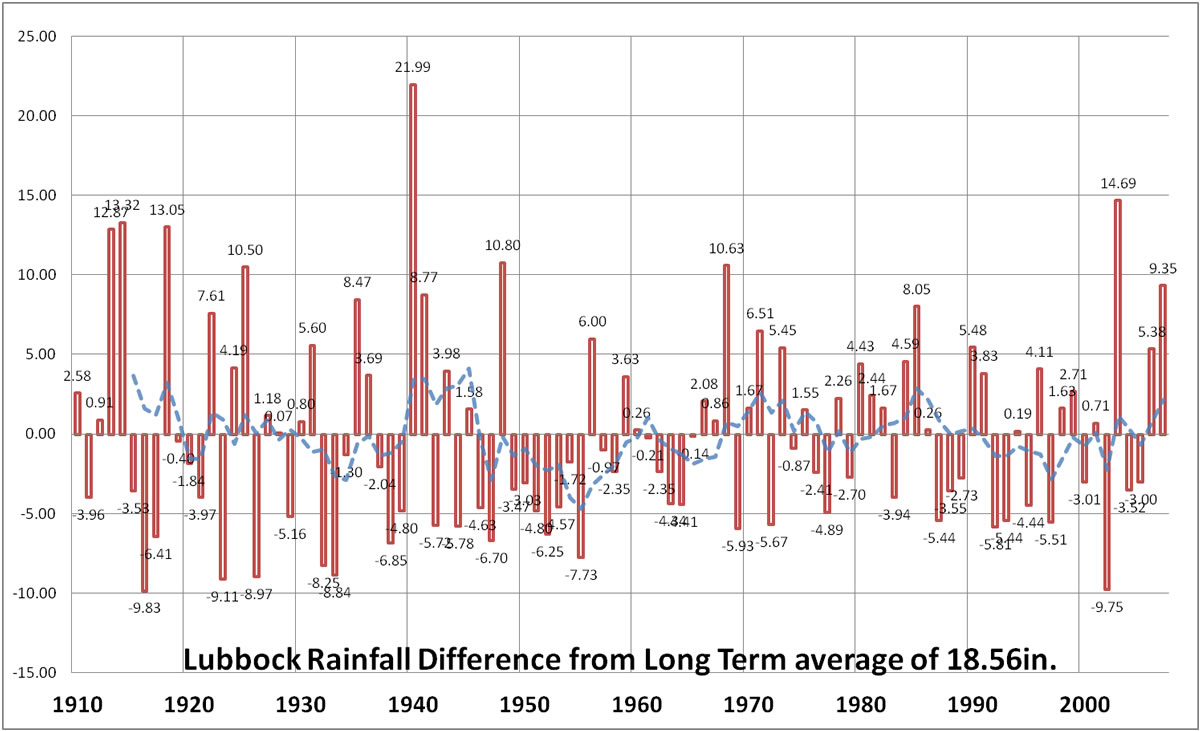
The graph below is a different way of showing the same precipitation data for Lubbock. It shows the annual variance from the long term average, which is 18.56 inches. The dashed blue line is a 6 year moving average. That 6 year moving average reached its most notable low in the 1950s. The largest difference from normal was 21.99 inches above normal in 1941. The greatest negative departures were 9.83 inches below normal in 1917 and 9.75 inches below in 2003. Again, the records show more variability in the early years.
History of Lubbock Rainfall Records: The early years of the record, from 1911 through 1946, were data collected at the Texas A&M Agricultural Research and Extension Service located just north of the airport. In January 1947 the official gage was moved to the new U.S. Weather Bureau office at the Lubbock airport. The original office was described as a lean-to attached to an airplane hangar. Before long the Weather Bureau moved into a more permanent residence in the Terminal Building where it remained until 1965. In 1965, the Weather Bureau and official rain gage moved to the Executive Air Terminal building located east of the current Terminal building. In 1967, the Weather Bureau was renamed the National Weather Service. The official rain gage remained at the Executive Terminal Building until October 1995 when the NWS commissioned its Automated Surface Observing System (ASOS). The ASOS, which is still in use today, is located at the airport, north of the main east-west runway, a short distance west of the FAA Control Tower. |

