 |
| |
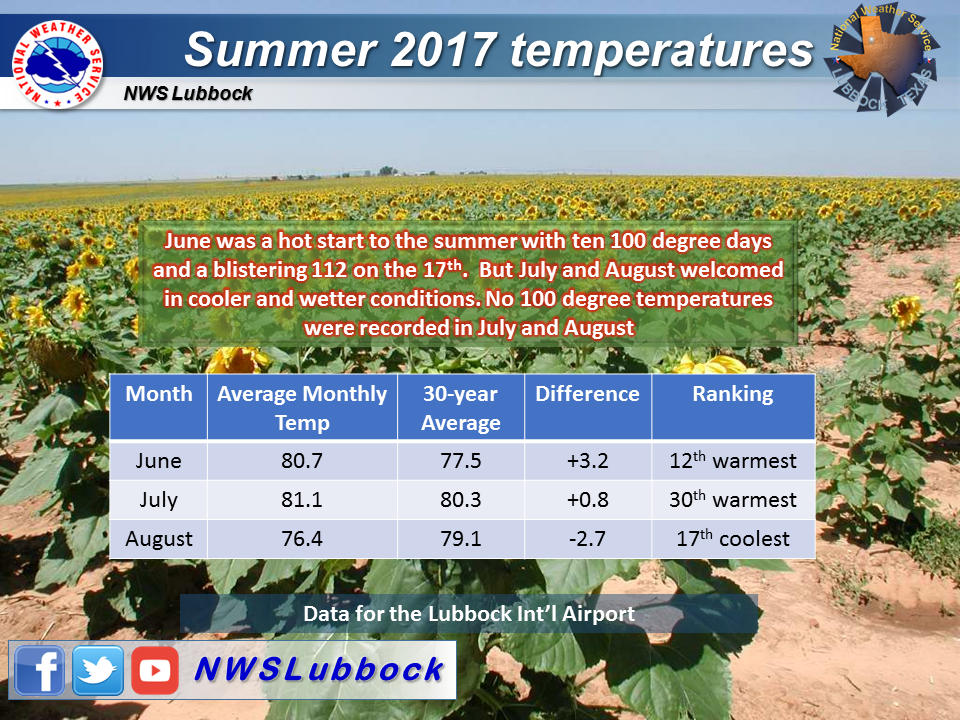
| Looking back at the summer of 2017 (June, July and August) for Lubbock and West Texas, the weather started out on the hot and drier side. High temperatures eclipsed the triple digit mark 10 times in June, including a stretch of eight 100+ degree days during the middle of the month. This included July 17th, when the heat peaked and Lubbock's high reached 112 degrees, just two degrees below the all-time record. Coupled with the heat, precipitation was rather spotty and meager to kick off the summer. Lubbock tallied just 1.78 inches of rain in June, and that included nearly an inch on the 26th. June 2017 finished as the 12th warmest June on record. Thankfully, the tide turned at the beginning of July as more widespread rainfall impacted the region and the temperatures trended downward. July still finished as the 30th warmest on record for Lubbock, but the monthly precipitation jumped to 5.84 inches, the mercury never reached triple digits. |
| |
 |
| |
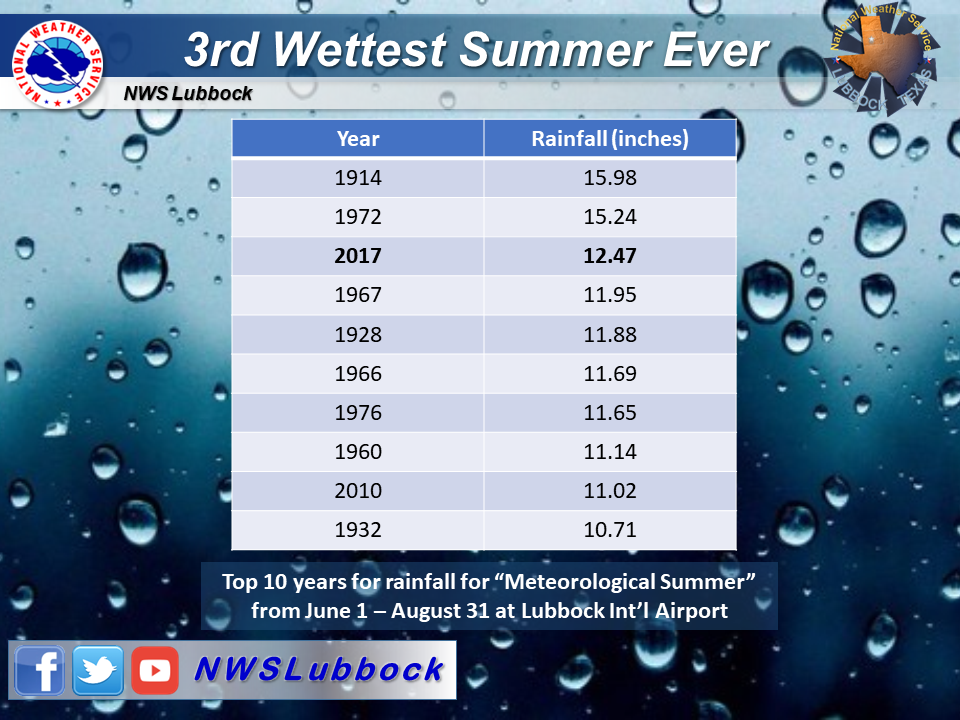
| Even cooler temperatures invaded the region through August, with the month finishing as the 17th coolest August on record. Going along with the cooler temperatures, more widespread rain fell during several stretches throughout the month. At the conclusion of the month Lubbock tallied another 4.85 inches of rain. Combine with the previous two months, the summer of 2017 finished with 12.47 inches, making it the third wettest summer on record at Lubbock. |
| |
 |
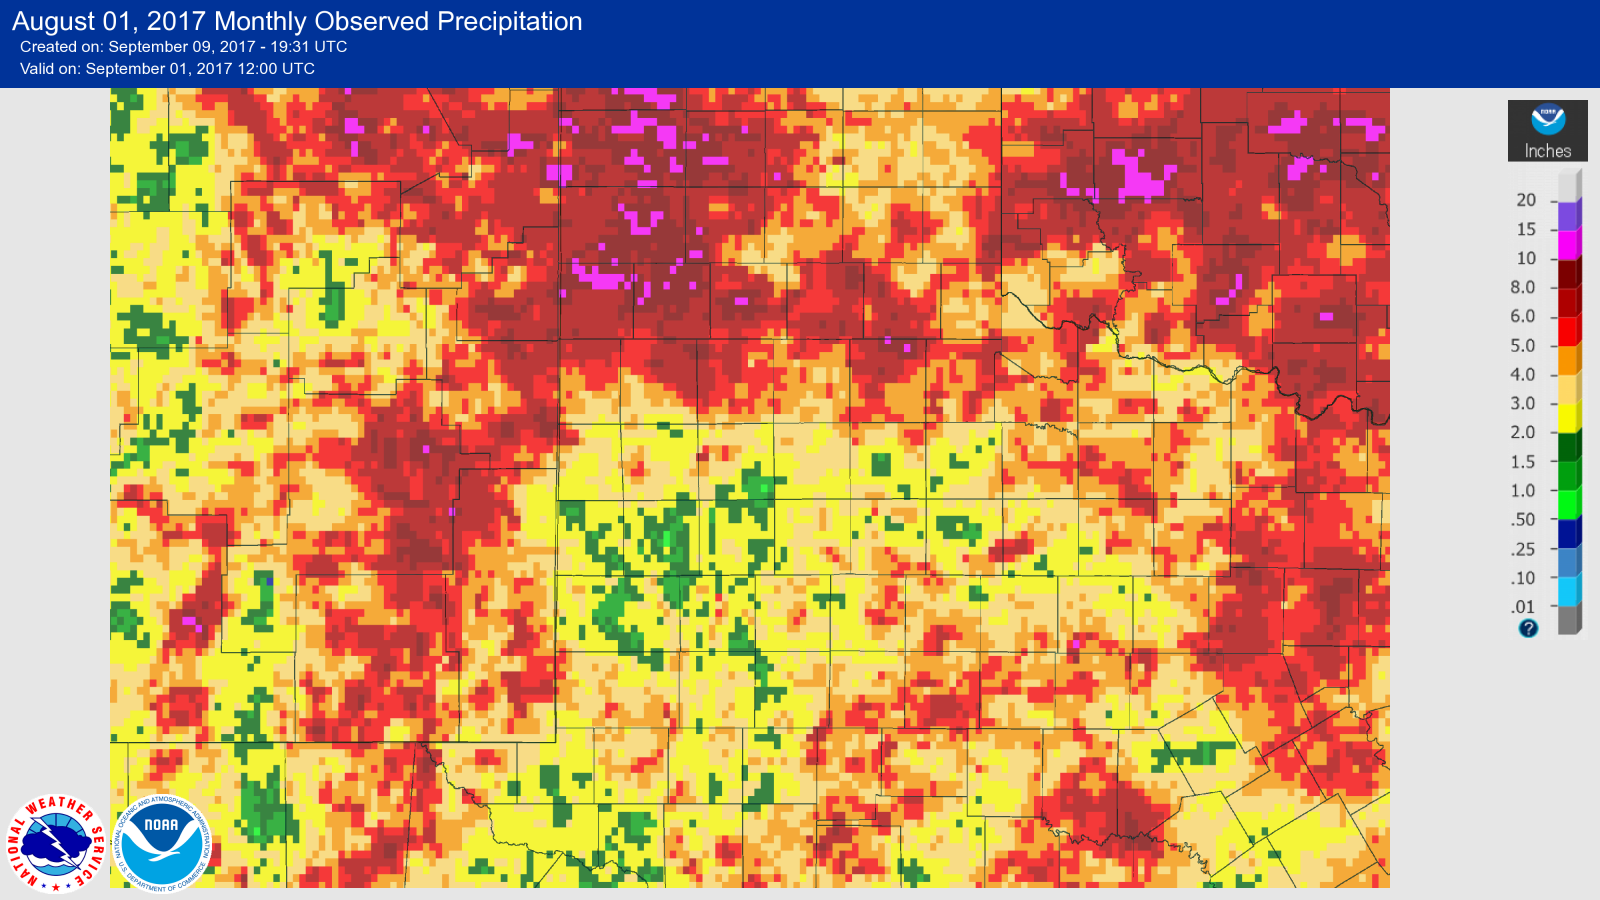 |
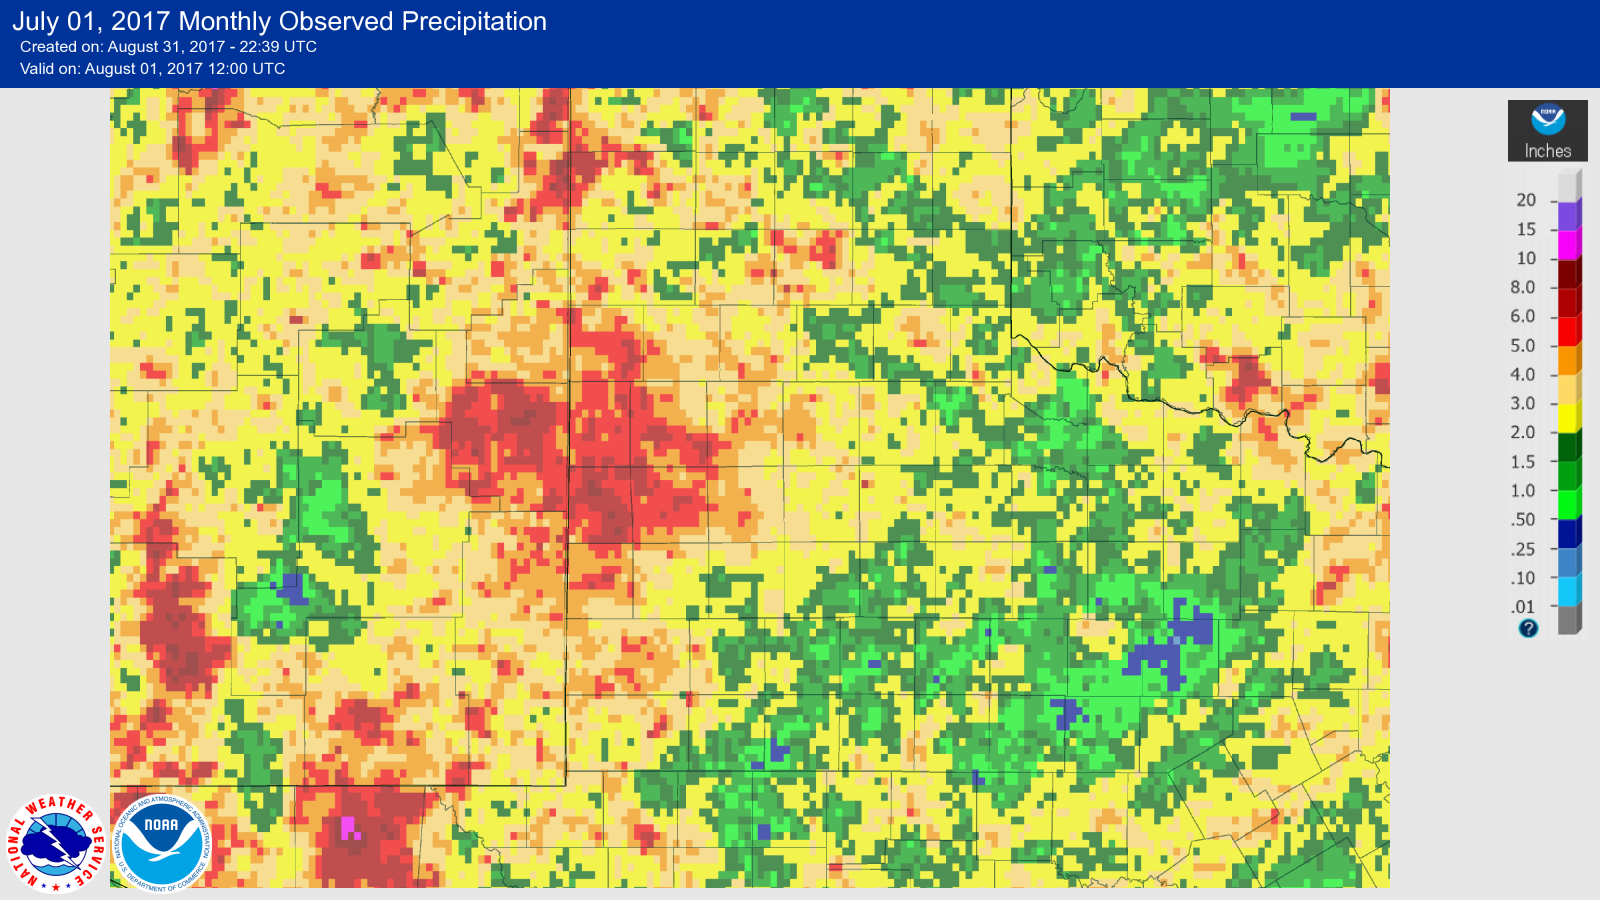
| Radar-estimated and bias-corrected monthly rainfall totals centered on the South Plains region. The left image is for July and right image is August. |
| |
| The above images show how the rainfall was distributed across the region through the months of July and August. The heaviest amounts favored locations near the Texas and New Mexico line in July, then expanded through much of the Panhandles and Oklahoma in August. However, the widespread rain did affect everyone which helped to alleviate a few pockets of drought that had persisted in the Rolling Plains. |
| |
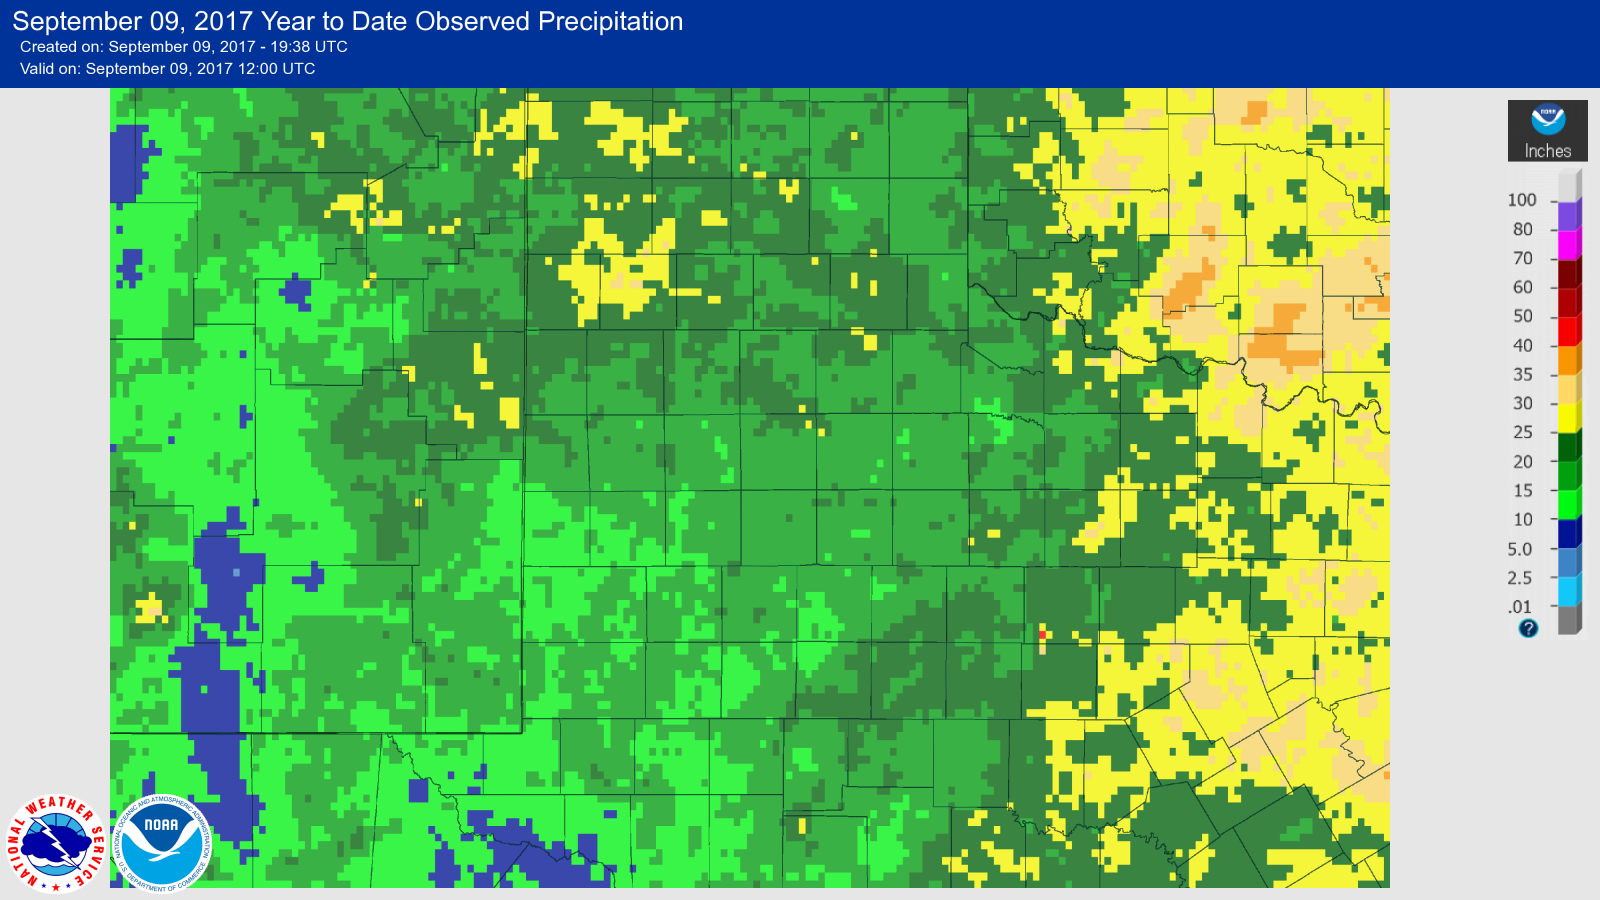 |
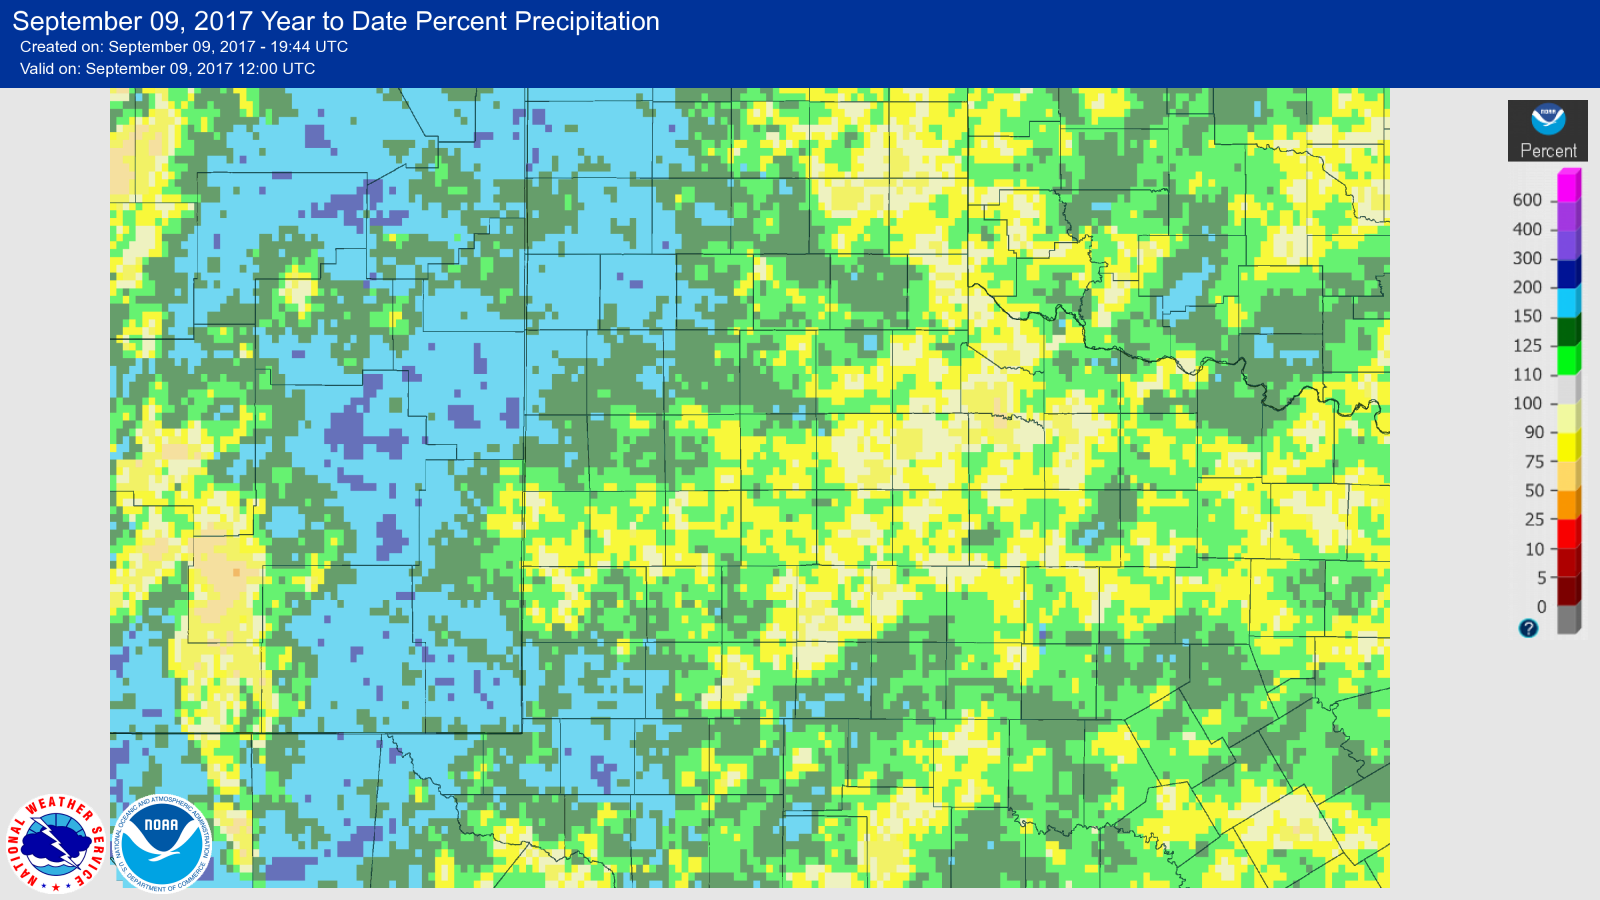
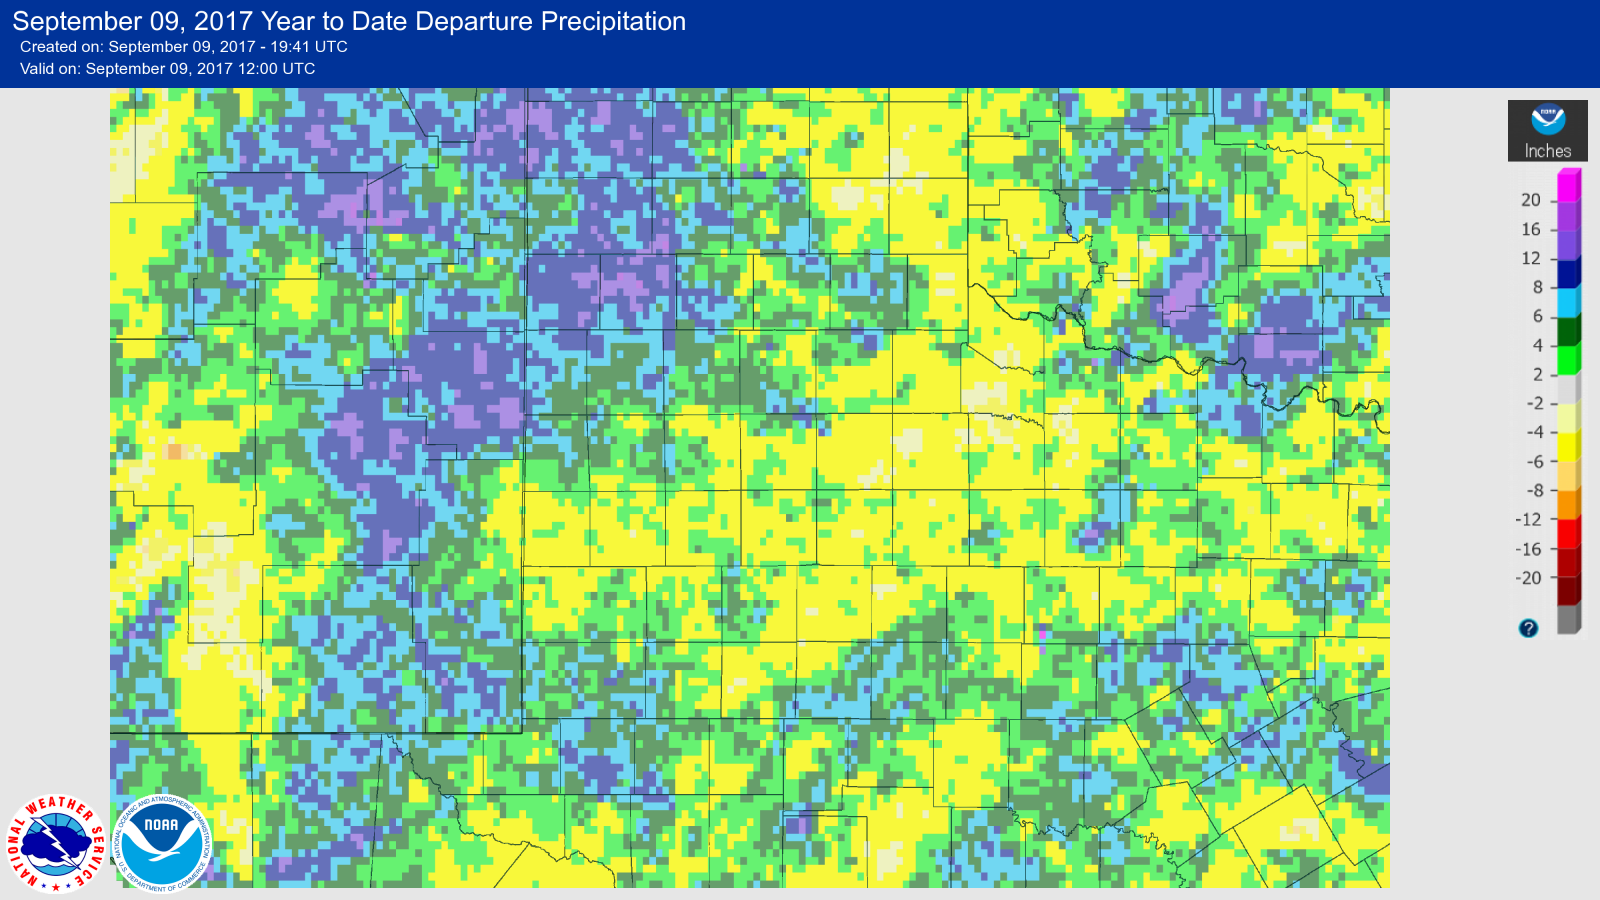
| Radar-estimated and bias-corrected year-to-date (YTD) rainfall totals centered on the South Plains region, valid through 8 September 2017. A similar display showing the YTD rainfall as a percent of normal can be FOUND HERE. To view the YTD rainfall as a departure from average CLICK HERE. |
| |
| As the above map shows, everyone did receive healthy amount of rainfall by the time summer concluded. During the hot and relatively dry stretch in June, Lubbock did briefly fall below the year-to-date average precipitation (see the graph below), but the wet July and August boosted rain totals back well above average. |
| |
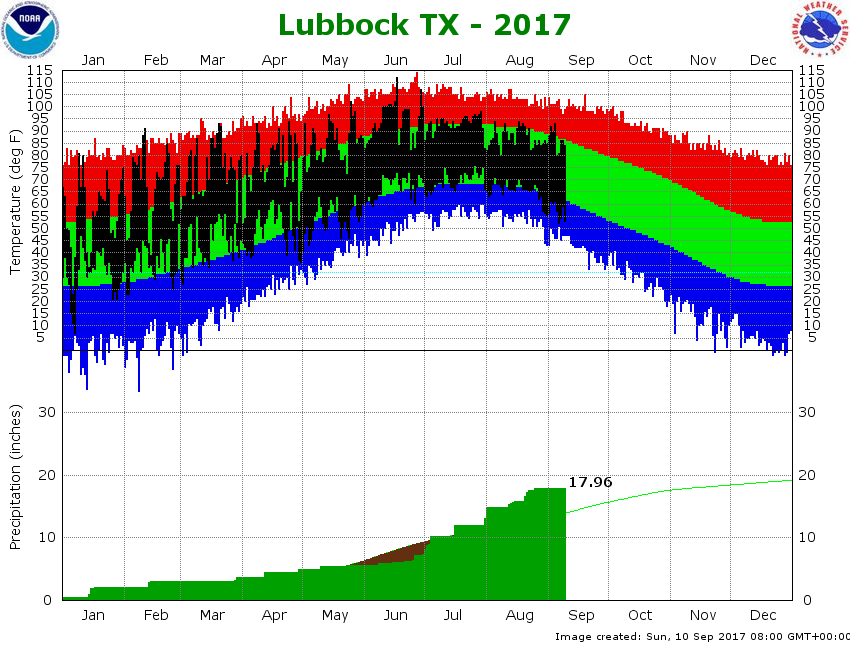 |
| (top) Plot of the observed highs and lows (black line) along with the average highs and lows (green range) and record highs (red) and record lows (blue) for Lubbock through 9 September 2017. (bottom) Plot of the YTD accumulated rainfall at Lubbock. |
| |
| |

