|
Heat and Intensifying Drought |
|||||
 |
|||||
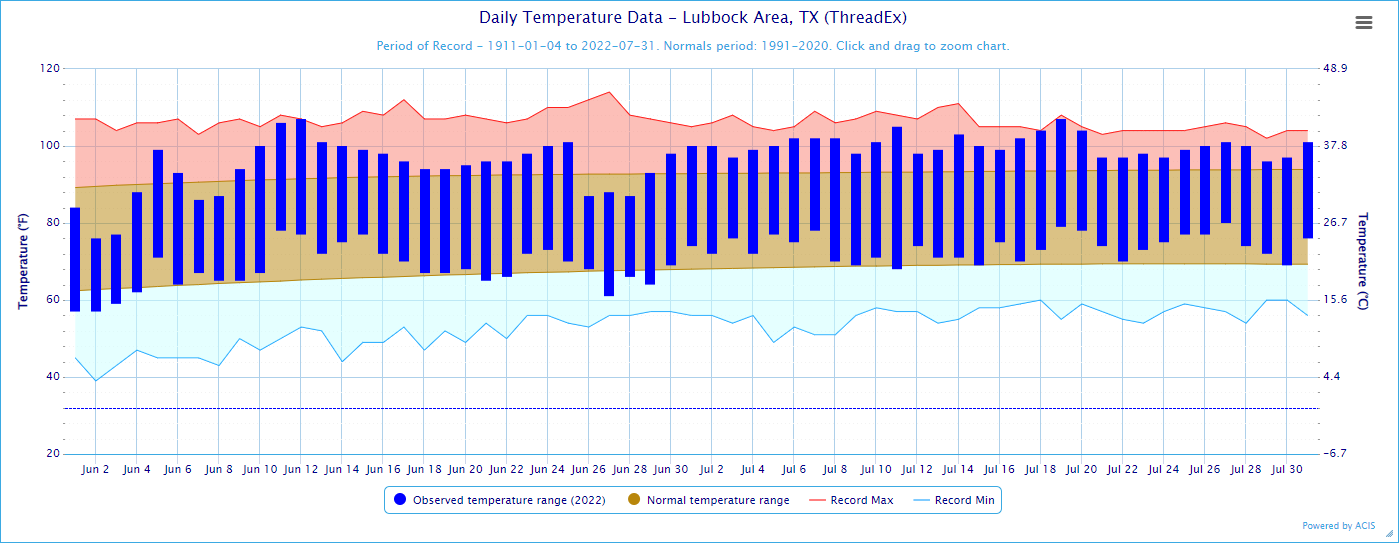
| Daily temperature range for Lubbock from June 1st through July 31st, 2022. Also plotted are the daily record highs (red) and lows (blue). The brown shaded area contains the 30-year average highs and lows. A similar plot for Childress can be VIEWED HERE. | |||||
|
The first two-thirds of summer 2022 (June and July) brought hot and dry weather to West Texas. June actually started out on the cooler side, below average, as spotty showers and thunderstorms occasionally roamed the region. However, the pleasant weather didn't last long as the atmosphere quickly dried out and heated up as upper level ridging built, then persisted, over the region. |
|||||
 |
|||||
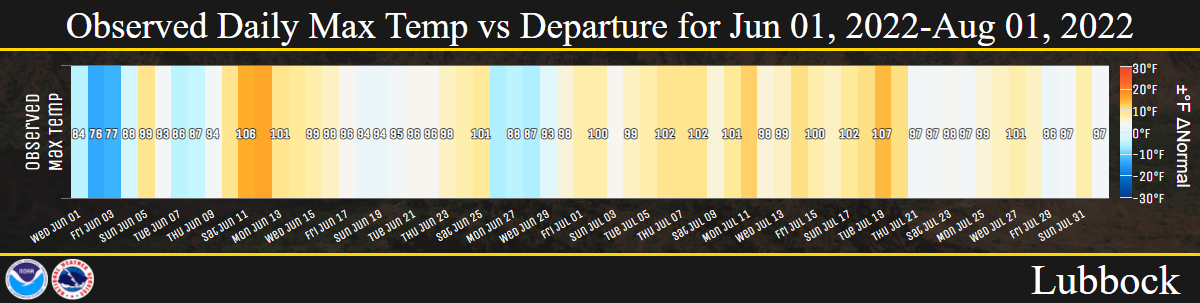
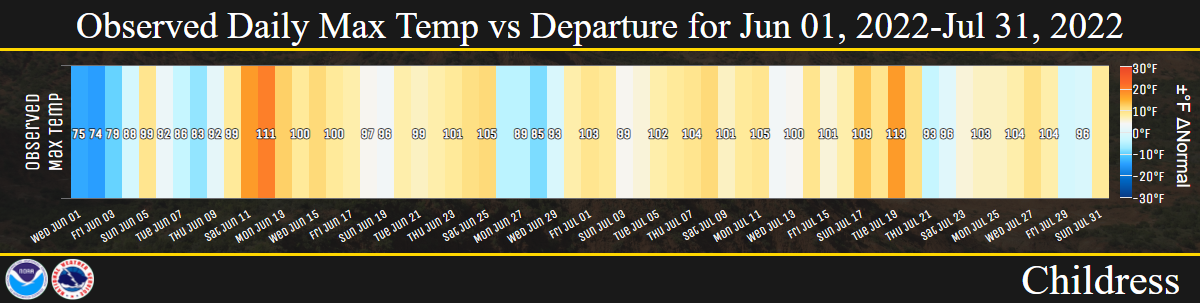
| Lubbock's high temperatures from June 1st through July 31st, 2022. Shaded are the departures from normal (orange is above normal, blue is below normal). To view the same graphic, but for Childress, CLICK HERE. | |||||
|
The above and below graphics nicely show how, after the "cool" start to June, temperatures trended well above average, peaking on the 11th and 12th when Lubbock reached topped out at 106 and 107 degrees, respectively. The end of June did provide a brief reprieve for the persistent heat when a weak cold front slipped through the region. Some locations even recorded rainfall, but it was spotty. The heat aggressively returned just in time for July, then continued to flex its muscles through most of the month. The brutal heat peaked in the middle of the month when several days measured highs near or above 105 degrees. It was even worse off the Caprock where many spots breached 110 degrees. |
|||||
 |
 |
||||
|
|||||
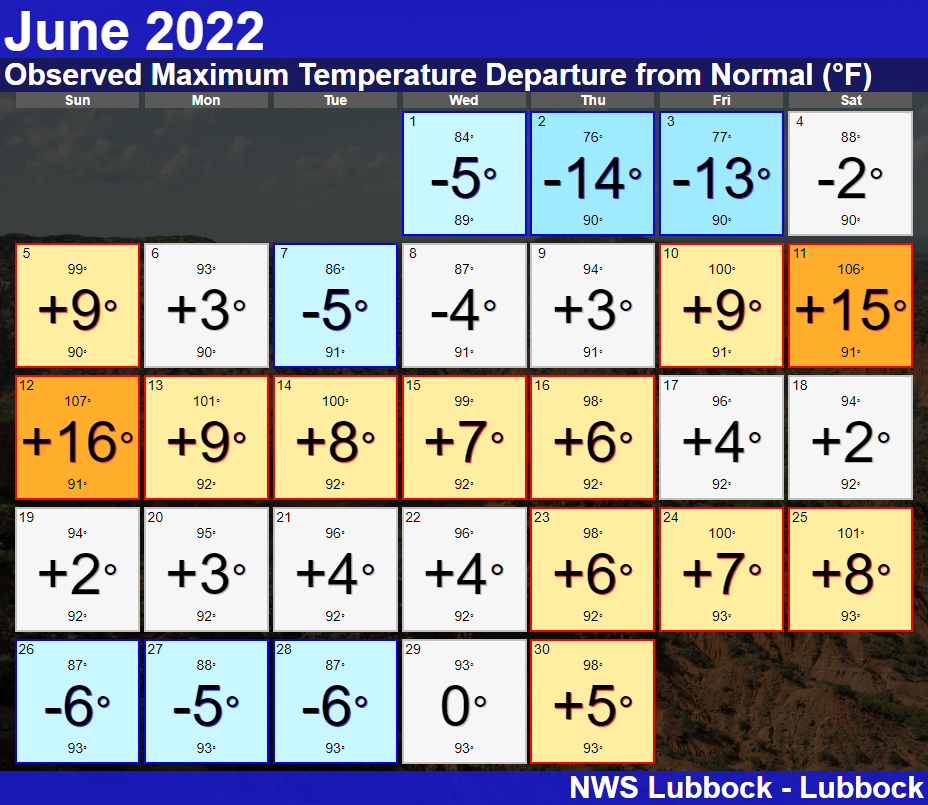
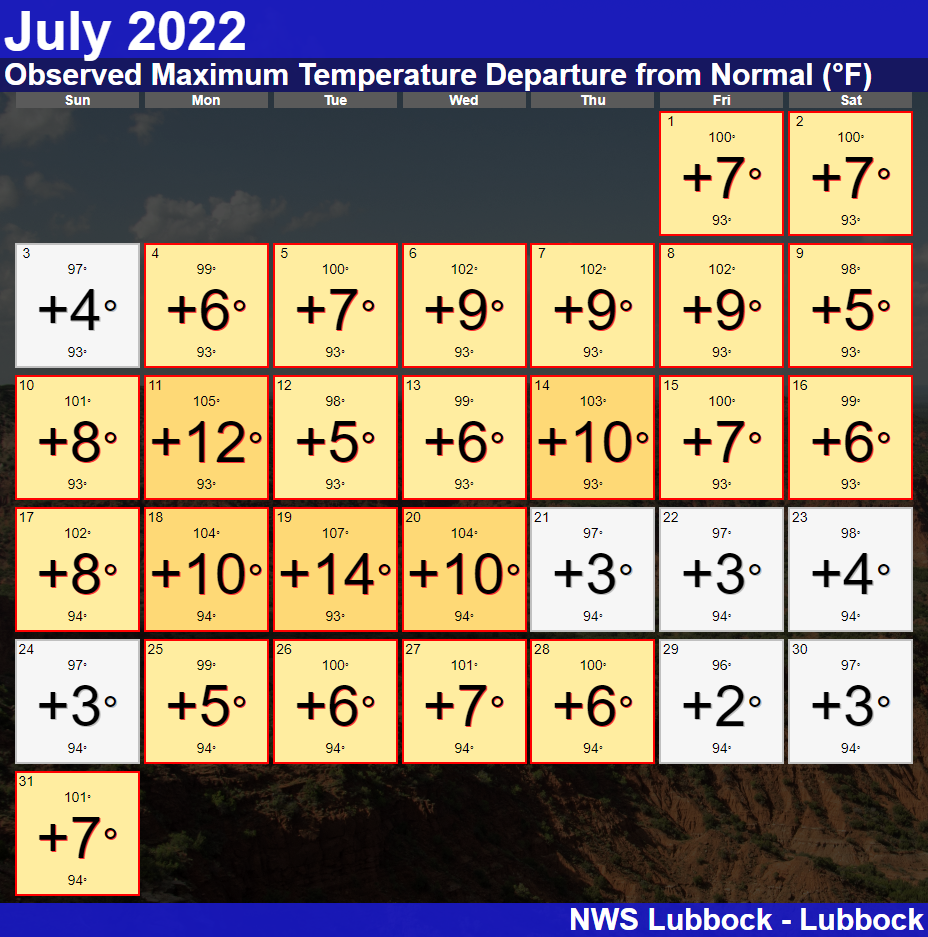
| Through July, Lubbock has recorded 31 100-degree days, including 18 in July alone, which is a new July record (topping 17 days in 1940). This makes 2022 only the second year to record over 30 100-degree days, trailing 2011 which had a ridiculous 48 days. Amazingly, every day of July in Lubbock had a mean and high temperature that was above average, and only one low that was below average (July 11th, when the low dipped to 68 degrees, one below the average). Not surprisingly, altogether, July was the hottest month ever observed in Lubbock. The average high for July was 100.2 degrees, average low was 73.5 degrees, and overall monthly average was 86.8 degrees, which all rank as the highest values ever recorded in July. The two previous hottest months were July and August of 2011, both which recorded a monthly average of 86.0 degrees. Even though it was hot, Lubbock only set one new record high in July (104 degrees on the 18th), but it did tie or set 6 record warm lows, including a low of 80 degrees on the 27th. Over this same stretch, Childress has recorded 49 100-degree days through July, with a peak high of 113 degrees reached on July 19th. | |||||
 |
|||||
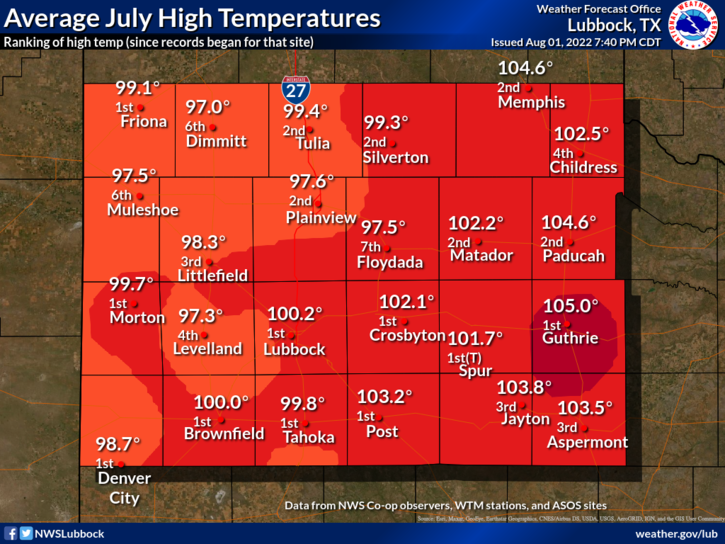
| Here is a look back at just how hot July was across the region. For each site, the average high temperature for the month of July is shown along with the ranking for that value since record keeping began for each station (i.e. 1st means this was the warmest July since records began). Ten sites set or tied their record warmest average July high temperature. | |||||
| The most intense heat was concentrated off the Caprock, where many locations recorded incredible monthly average highs of 102 to 105 degrees. However, the crazy heat wasn't confined to West Texas, as the below graphic illustrates. | |||||
 |
|||||
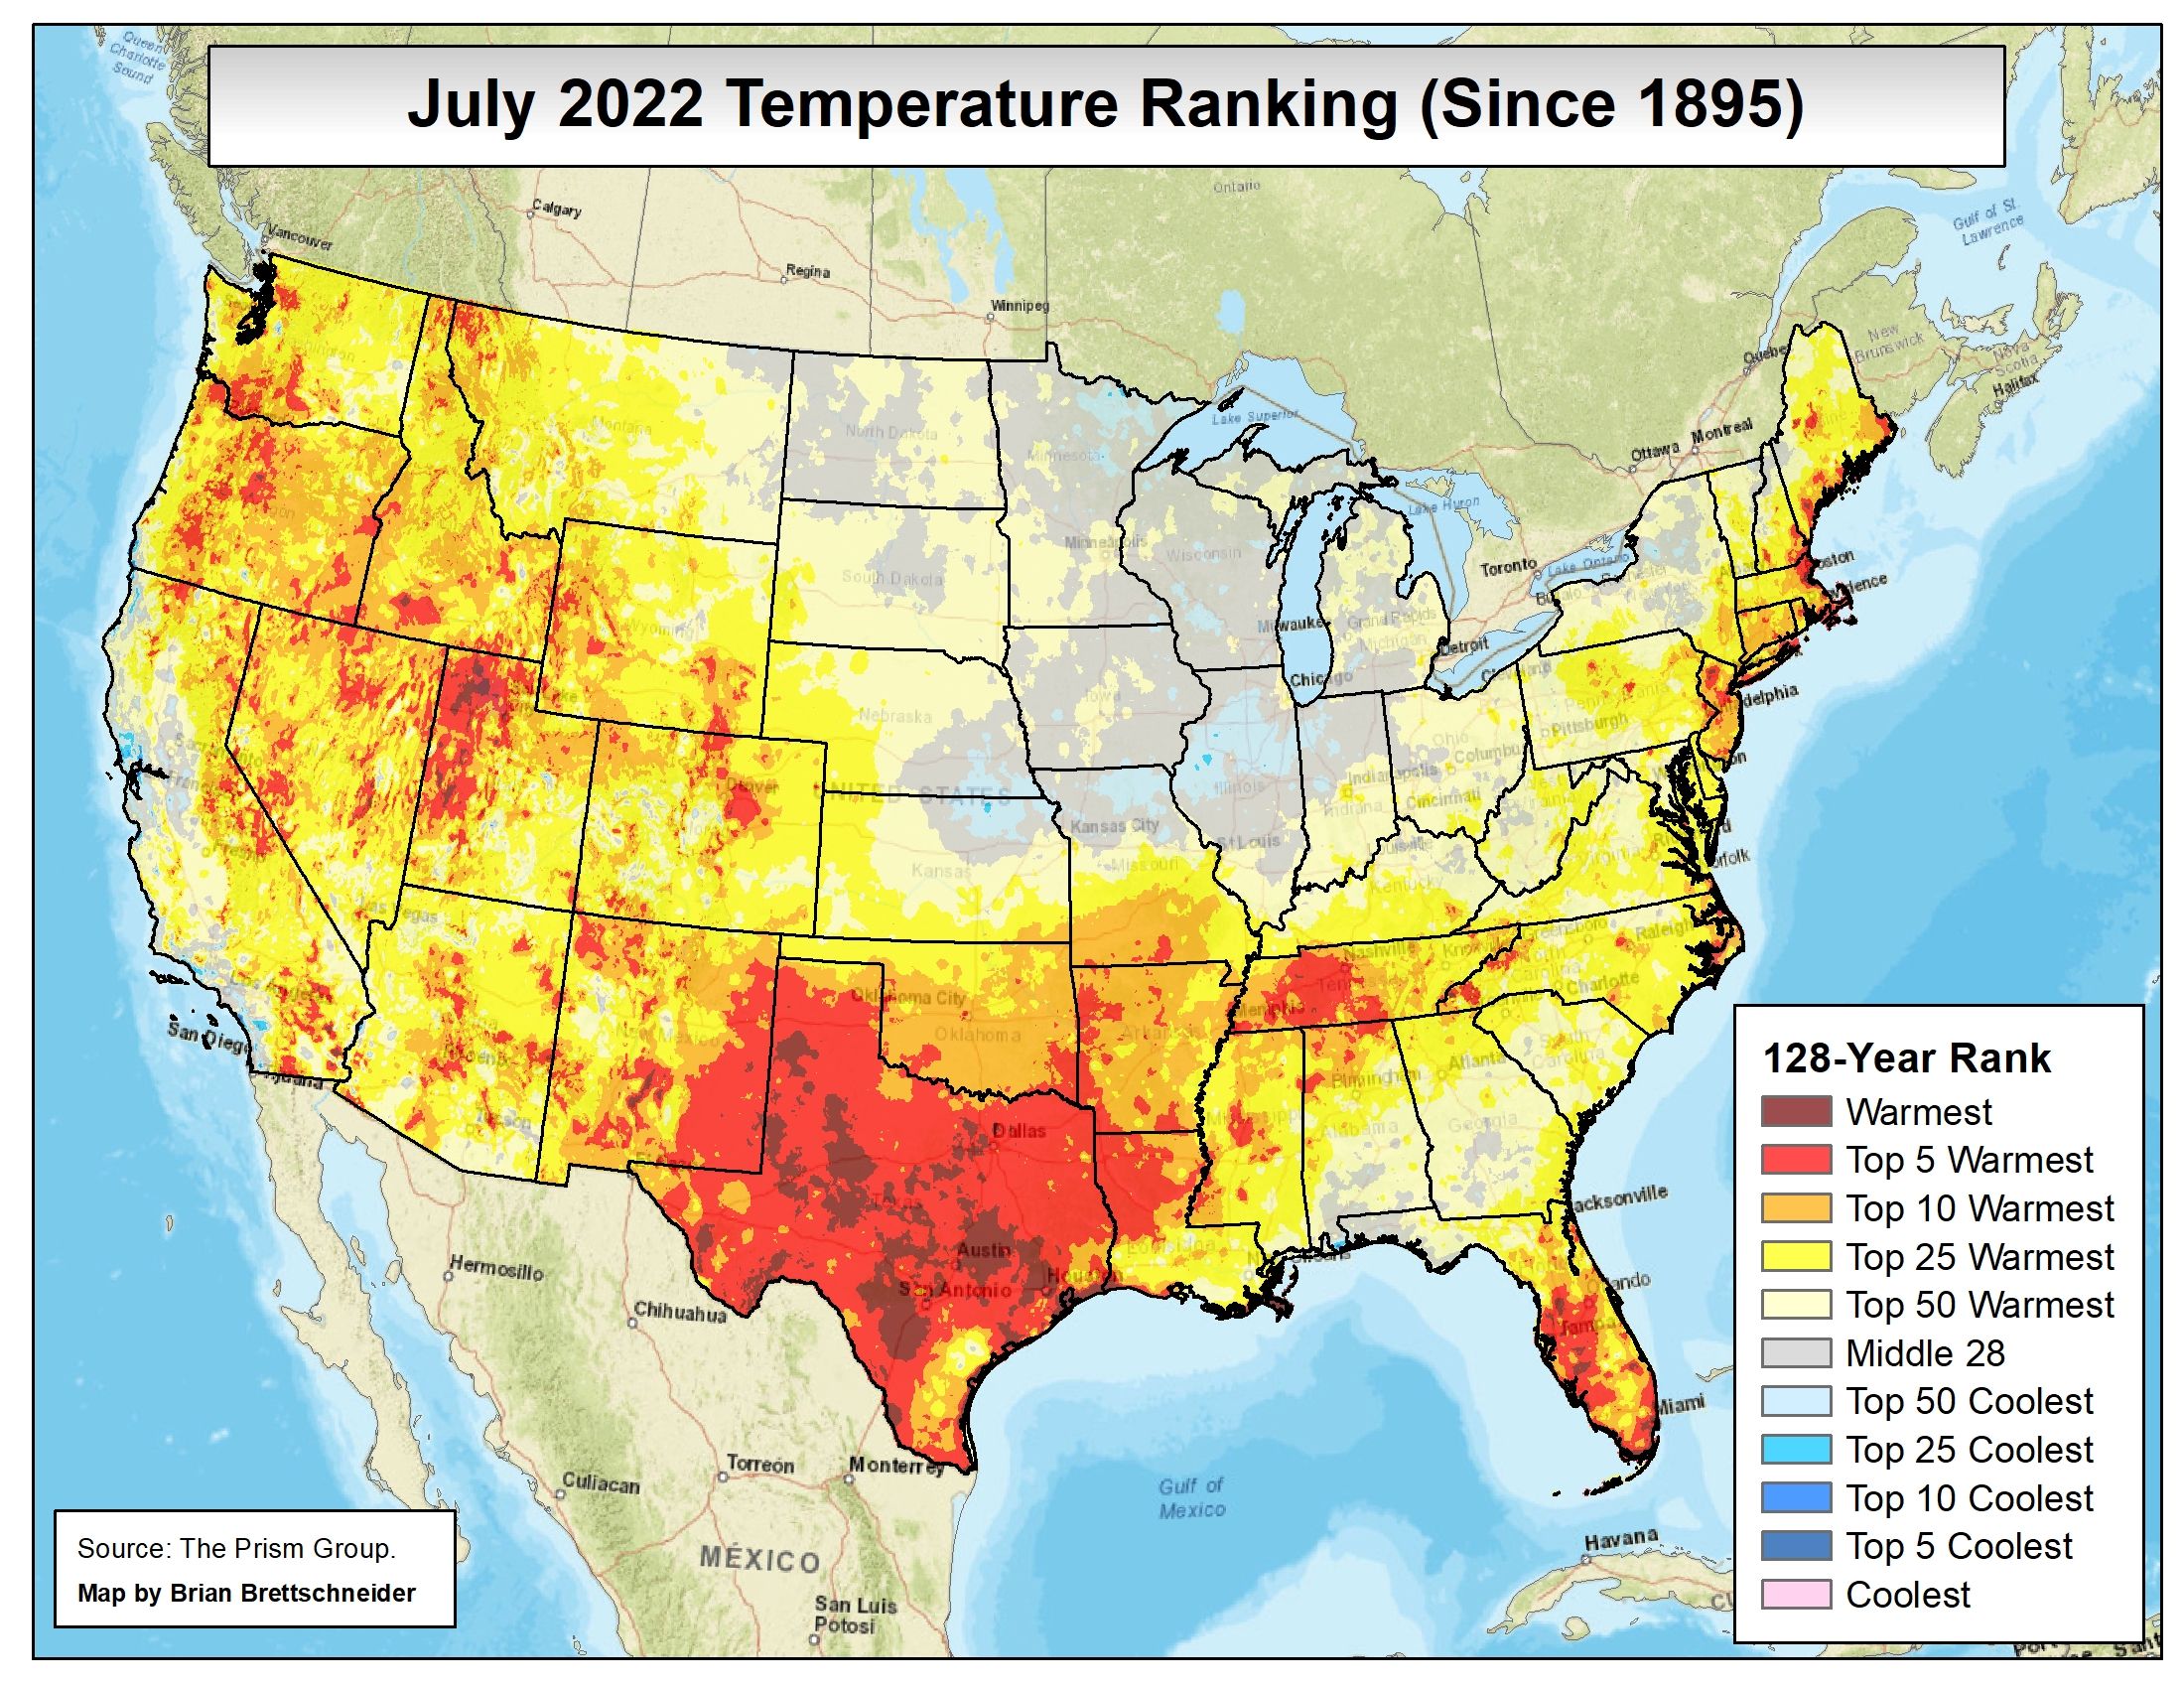
| July 2022 temperature rankings since 1895 for the entire continental United States. | |||||
| Much of Texas was at the epicenter of the heat for July 2022, though many other locations across the southern and western U.S. also experienced some of their warmest/hottest Julys. Only much of the Midwest, Great Lakes and parts of the southeastern states experienced temperatures near or slightly below average for July. | |||||
 |
|||||
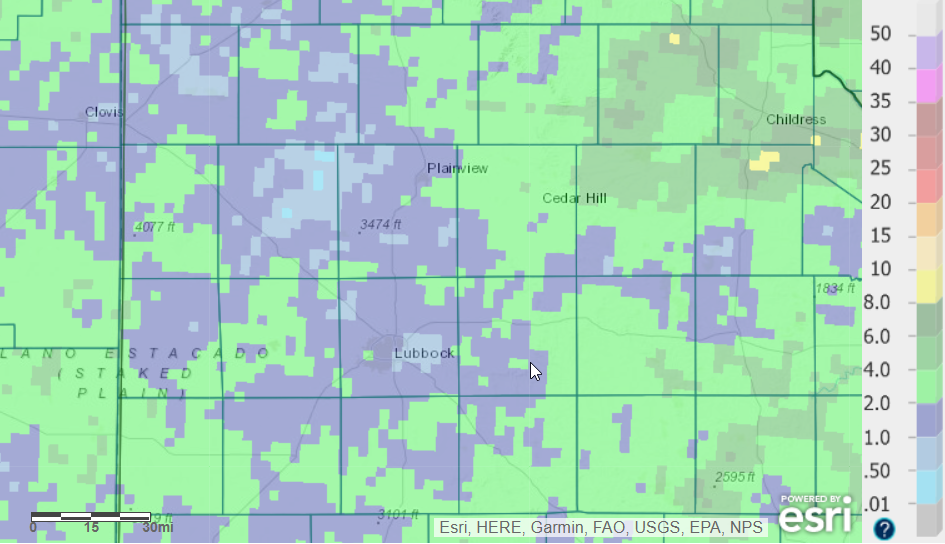
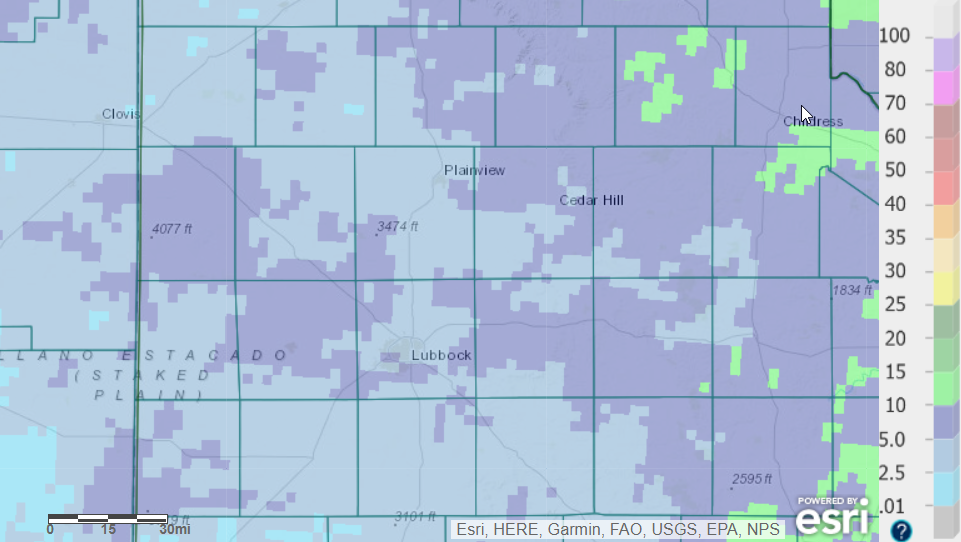
| 60-day radar-estimated and bias-corrected precipitation (inches) ending at 7 am on 29 July 2022. A 180-day precipitation graphic ending at the same time can be FOUND HERE. | |||||
| Well below average precipitation accompanied the sweltering temperatures, as it common. June and July collectively brought less than 4 inches of rain for all but parts of the southeast Texas Panhandle, while a majority of locations on the Caprock received less than 2 inches (and under an inch in spots). | |||||
 |
|||||
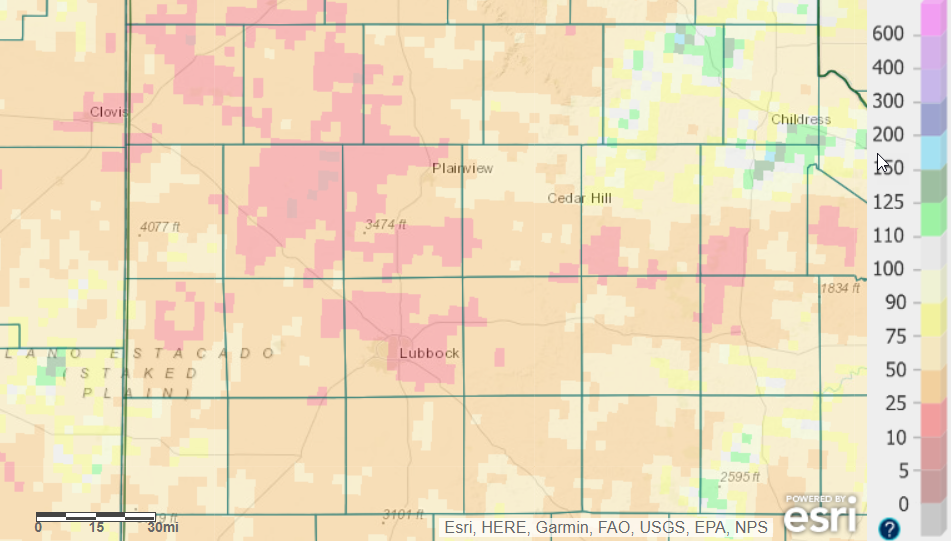
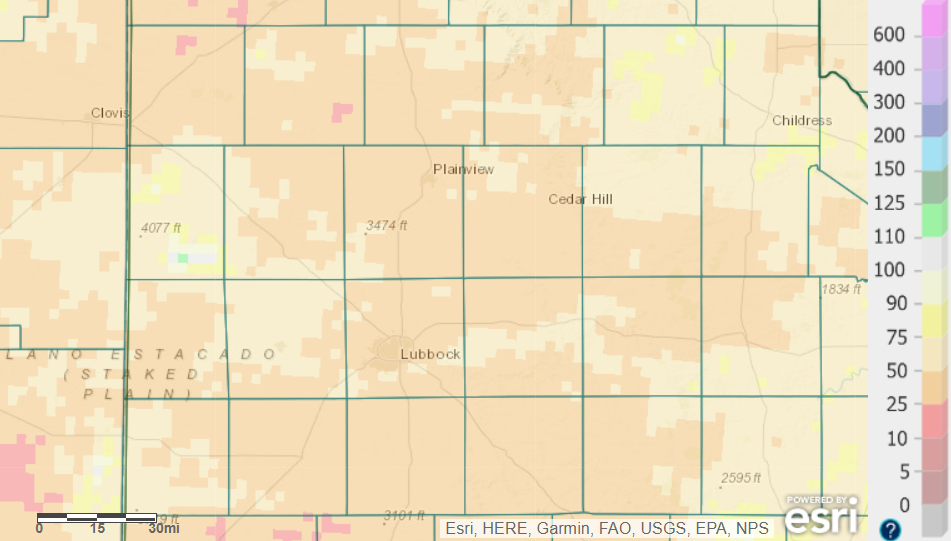
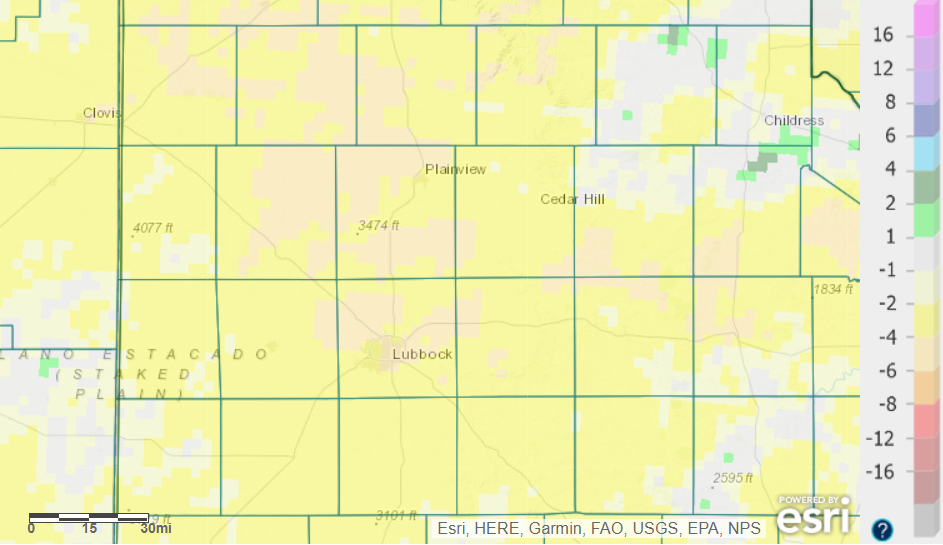
| 60-day radar-estimated and bias-corrected precipitation, as a percent of normal, ending at 7 am on 29 July 2022. The 180-day percent of normal precipitation graphic ending at the same time can be FOUND HERE. The absolute departure from normal (inches) can be found at: 60-day values; and 180-day values. | |||||
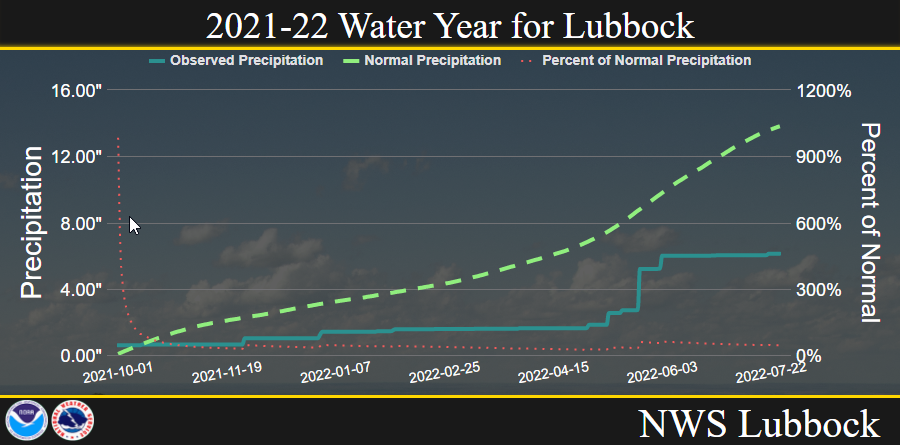
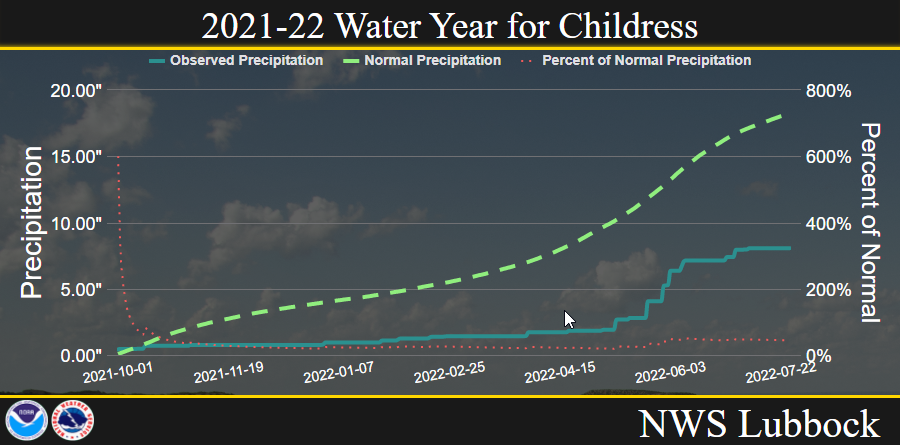
| The below average rainfall has not been limited to June and July. In fact, aside from a brief wet period in late May and early June, below average precipitation has been commonplace for the region since fall of 2021, as the below graph illustrates. | |||||
 |
|||||
|
|||||
|
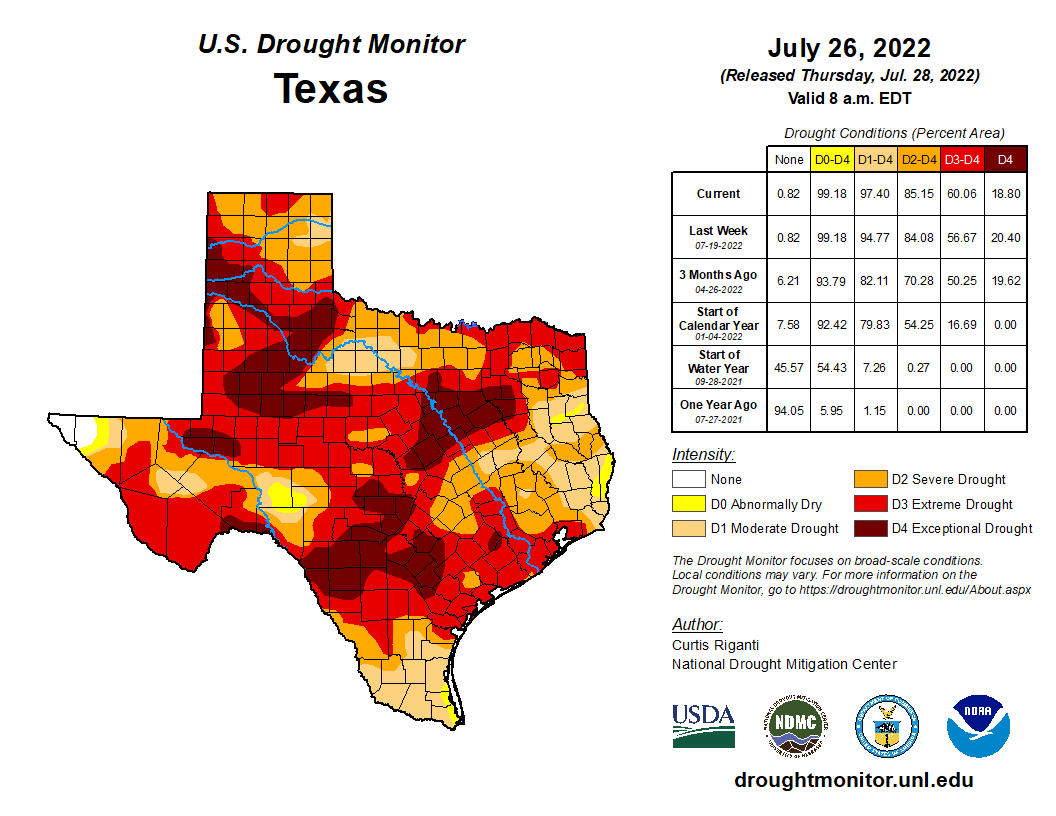
Altogether, the hot temperatures and dearth of rainfall has exacerbated the ongoing drought. Through late July, extreme to exceptional drought covered much of the South and Rolling Plains. Only a few small pockets of somewhat less severe drought existed where localized heavier rains fell. |
|||||
 |
|||||
| Drought monitor for Texas valid on 26 July 2022. | |||||
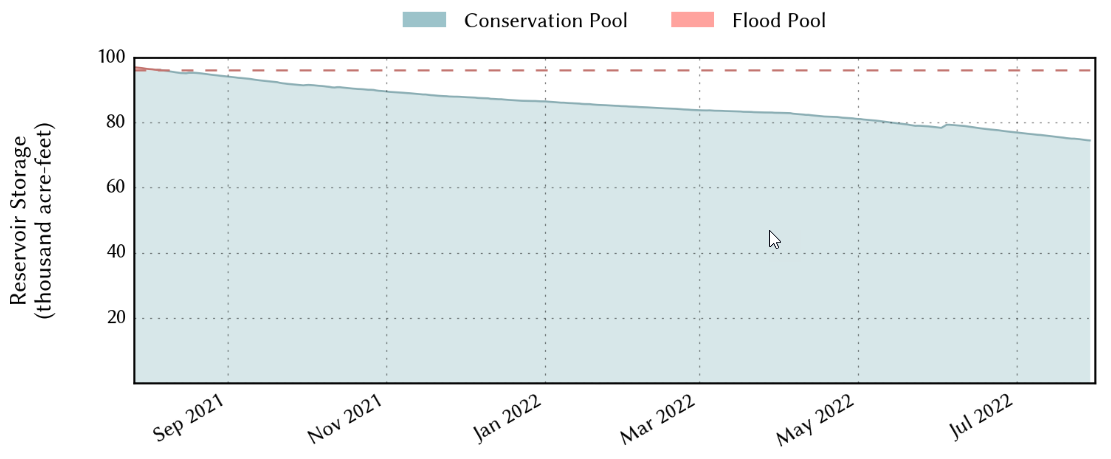
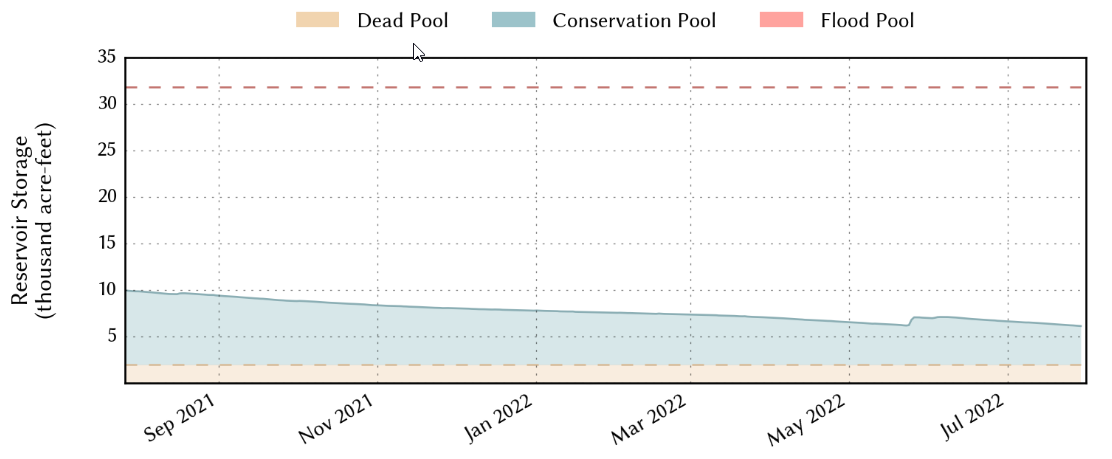
| The lack of rain, excessive heat and increased demand for water have driven area reservoirs downward from late 2021 through summer 2022. This was minimal (to no) recharge in May and June, as the spring stormy season largely failed to produce. | |||||
 |
|||||
| Lake Alan Henry's reservoir level, displayed as a percent of total capacity. Plots can also be viewed for: White River Lake; and Mackenzie Reservoir. | |||||
|
Thankfully, Lake Alan Henry was essentially full going to fall 2021, so it remains at a respectable level (~75%) as of late July, despite the nearly continuous downward trend. Obviously, repeated widespread significant rainfall will be needed to reverse the drought and raise reservoir levels. |
|||||

