Here at the NWS Baltimore/Washington office, we have gone back through all the winter snowfall totals we have available for DC since 1950 to see if there is a correlation between snowfall and years when an El Niño or La Niña is present. We found that it tends to depend more on another index known as the North Atlantic Oscillation (NAO). When this index is negative, it indicates a more amplified, colder and snowier pattern over our area. El Niño adds more moisture and storminess, but sometimes brings milder air as well. La Niña typically brings drier and milder conditions.
Below are two scatter plot diagrams showing wintertime snowfall vs. El Niño, La Niña and NAO.
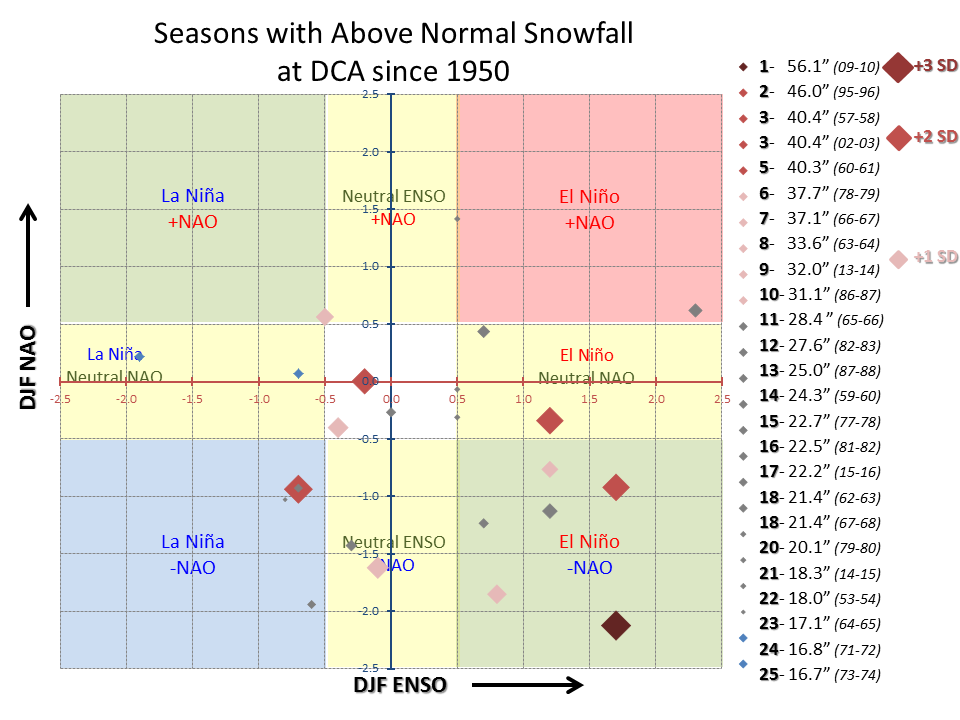
This first scatterplot shows a cluster of above normal snowfall occurring in winters when the NAO was predominantly neutral to negative. There was only one winter with above normal snowfall since 1950 when DJF La Niña was moderate or strong, and only one winter when the DJF NAO was positive.
The historic 2009-10 winter snowfall (56.1”) was attributed to a unique combination of a moderately strong El Niño and strongly negative NAO.
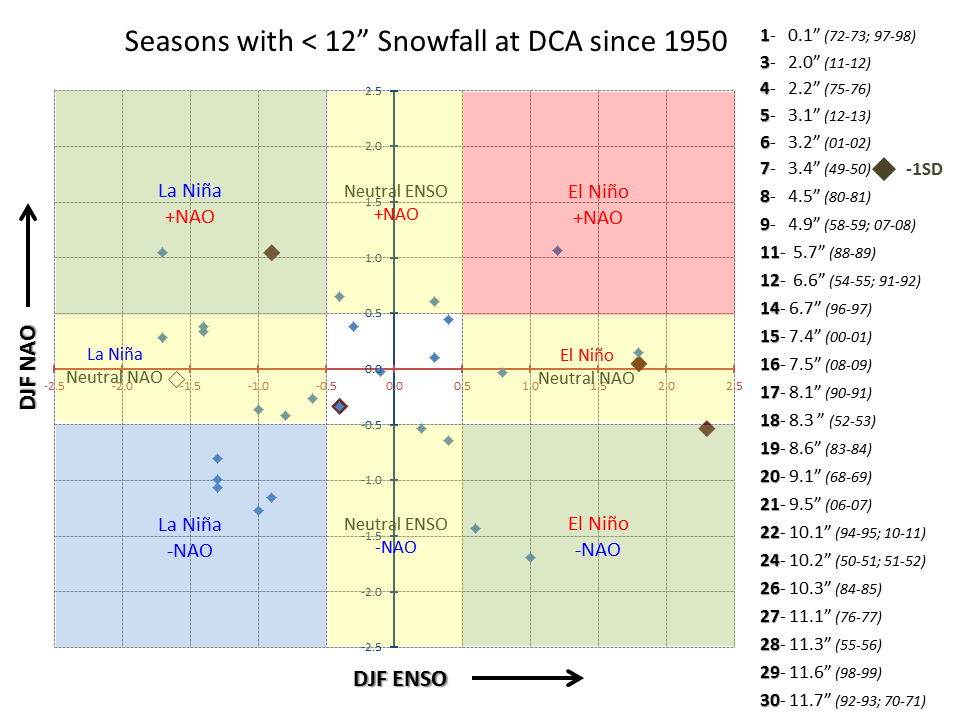
This second scatterplot diagram is a little less clear, but shows there is a bit of a tendency for below normal season snowfall of less than a foot when a moderately strong La Niña is present.
For more information on El Niño, La Niña and long range seasonal forecasts, please visit NOAA's Climate Prediction Center website at www.cpc.noaa.gov.



 Radar
Radar Current Weather
 Rivers & Lakes
 Satellite
 Forecast Maps
 Hour by Hour Forecast
 Tropical Weather
 Graphical Hazards
 Marine Forecasts
 Forecaster's Discussion
 Text Bulletins
 Fire Weather
 Weather Hazard Briefing
 Climate Plots
 Coastal Flood
 Skywarn
 Submit Storm Report
 FAQ
FAQ Follow us on X
 Follow us on Facebook
 Follow us on YouTube
 LWX RSS Feed