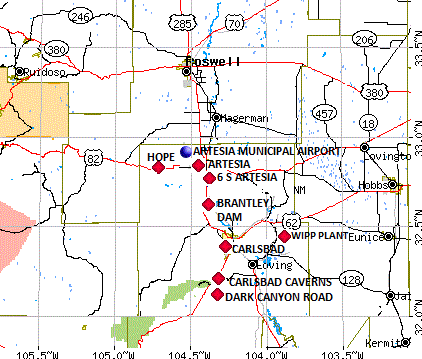
| Month | Jan | Feb | Mar | Apr | May | Jun | Jul | Aug | Sep | Oct | Nov | Dec | Ann | |||
|---|---|---|---|---|---|---|---|---|---|---|---|---|---|---|---|---|
| Maximum | 57.3 | 62.5 | 69.7 | 78.0 | 86.6 | 93.9 | 94.1 | 92.6 | 86.4 | 77.4 | 66.4 | 56.8 | 76.8 | |||
| Minimum | 22.7 | 26.8 | 34.0 | 41.2 | 52.1 | 61.0 | 64.6 | 63.2 | 55.2 | 43.3 | 31.2 | 22.8 | 43.2 | |||
| Precipitation | 0.45 | 0.43 | 0.38 | 0.61 | 1.30 | 1.60 | 1.67 | 1.95 | 1.84 | 1.21 | 0.83 | 0.65 | 12.92 | |||
| Snowfall | 2.2 | 0.8 | 0.3 | 0.5 | 0.0 | 0.0 | 0.0 | 0.0 | 0.0 | 0.1 | 0.9 | 2.1 | 6.9 | |||
| Heating Degree Days | 768 | 569 | 398 | 182 | 31 | 1 | 0 | 0 | 22 | 166 | 480 | 773 | 3392 | |||
| Cooling Degree Days | 0 | 0 | 3 | 28 | 172 | 377 | 448 | 405 | 199 | 29 | 1 | 0 | 1662 | |||
| Year | Jan | Feb | Mar | Apr | May | Jun | Jul | Aug | Sep | Oct | Nov | Dec | Ann | |||
|---|---|---|---|---|---|---|---|---|---|---|---|---|---|---|---|---|
| 2020 | 0.22 | 0.30 | 2.16 | 0.07 | 0.00 | 0.48 | 0.66 | 0.36 | 0.02 | 0.03 | 0.14 | 0.00 | 4.44 | |||
| 2019 | 0.00 | 0.05 | 0.41 | 0.18 | 0.04 | 1.51 | 0.21 | 0.34 | 2.13 | 1.33 | 1.02 | 0.00 | 7.22 | |||
| 2018 | 0.01 | 0.25 | 0.10 | 0.00 | 0.54 | 1.30 | 0.40 | 0.76 | 0.69 | 1.62 | 0.01 | 0.46 | 6.14 | |||
| 2017 | 0.78 | 0.20 | 0.02 | 0.76 | 0.03 | 0.23 | 0.76 | 0.86 | 1.39 | 0.24 | 0.10 | 0.00 | 5.37 | |||
| 2016 | 0.00 | 0.18 | 0.01 | 0.37 | 0.59 | 0.40 | 0.02 | 5.54 | 1.96 | 0.34 | 0.17 | 0.25 | 9.83 | |||
| 2015 | 0.63 | 0.17 | 0.09 | 0.58 | 0.31 | 0.86 | 0.76 | 1.48 | 0.76 | 4.81 | 0.13 | 0.05 | 10.63 | |||
| 2014 | 0.00 | 0.03 | 0.06 | 0.28 | 0.19 | 0.93 | 0.57 | 0.28 | M | M | M | 0.11 | 2.45i | |||
| 2013 | 0.35 | 0.00 | 0.03 | 0.00 | 0.21 | 0.15 | 1.18 | 0.00 | 1.91 | 0.00 | 0.39 | 0.07 | 4.29 | |||
| 2012 | 0.04 | 0.09 | 0.00 | 0.00 | 1.21 | 0.03 | 1.76 | 0.38 | 1.32 | 0.00 | 0.05 | 0.17 | 5.05 | |||
| 2011 | 0.00 | 0.00 | 0.00 | 0.00 | 0.00 | 0.40 | 0.60 | 0.14 | 0.65 | 0.25 | 0.00 | 0.28 | 2.32 | |||
| 2010 | 0.19 | 0.63 | 0.17 | 0.19 | 0.22 | 2.37 | 0.60 | 0.23 | 0.92 | 0.05 | 0.00 | 0.02 | 5.59 | |||
| 2009 | 0.00 | 0.00 | 0.12 | 0.00 | 0.51 | 0.36 | 2.54 | 0.01i | 0.30 | 0.82 | 0.02 | 0.56 | 5.24i | |||
| 2008 | 0.00 | 0.00 | 0.04 | 0.00 | 0.22 | 1.80 | 1.99 | 1.75 | 0.75 | 1.26 | 0.00 | 0.01 | 7.82 | |||
| 2007 | 0.26 | 0.05 | 0.11 | 0.02 | 1.86 | 0.06 | 0.44 | 0.25 | 0.00 | 0.00 | 0.00 | 0.08 | 3.13 | |||
| Year | Jan | Feb | Mar | Apr | May | Jun | Jul | Aug | Sep | Oct | Nov | Dec | Ann | |||
| 2006 | 0.00 | 0.12 | 0.00 | 0.00 | 0.07 | 0.17 | 0.19 | 0.31 | 0.33 | 0.52 | 0.00 | 0.02 | 1.66 | |||
| 2005 | 0.08 | 0.10 | 0.06 | 0.00 | 0.01 | 0.00 | 0.00 | 0.15 | 0.00 | 0.00 | 0.00 | 0.00 | 0.40 | |||
