Wildfire smoke will push into the Midwest, worsening air quality. A frontal system brings severe storms from the Northern Plains to the Mid‑Atlantic the next few days. Heavy Gulf Coast rain is possible as Tropical Depression Two has formed, while monsoonal storms persist in the Southwest with heavy rainfall. Hazardous heat expands from the Plains into the Lower Mississippi Valley. Read More >
Greg Murdoch and Jim Deberry
1. Introduction
West Texas weather has many intriguing meteorological circumstances that make weather forecasting a challenge. Some forecasters prefer to base their forecast on model guidance while others prefer to base their forecast on recognition of synoptic patterns. In this paper we will apply conventional meteorological concepts along with local climatology to pattern recognition in forecasting unusually strong west winds. Finally, we will apply a theoretical concept to see how it may support the potential for a significant west wind event.
Significant west wind events in this case study are defined as events with wind gusts over 35 knots (kts). We will use two high wind events in this case study (17 January 1996 and 21 January 1999) to illustrate patterns which favor significant west wind events across west Texas and southeast New Mexico. Since wind and blowing dust are closely related in Midland's County Warning Forecast Area (CWFA) we will also investigate favored wind directions for blowing dust.
2. Synoptic Pattern Analysis
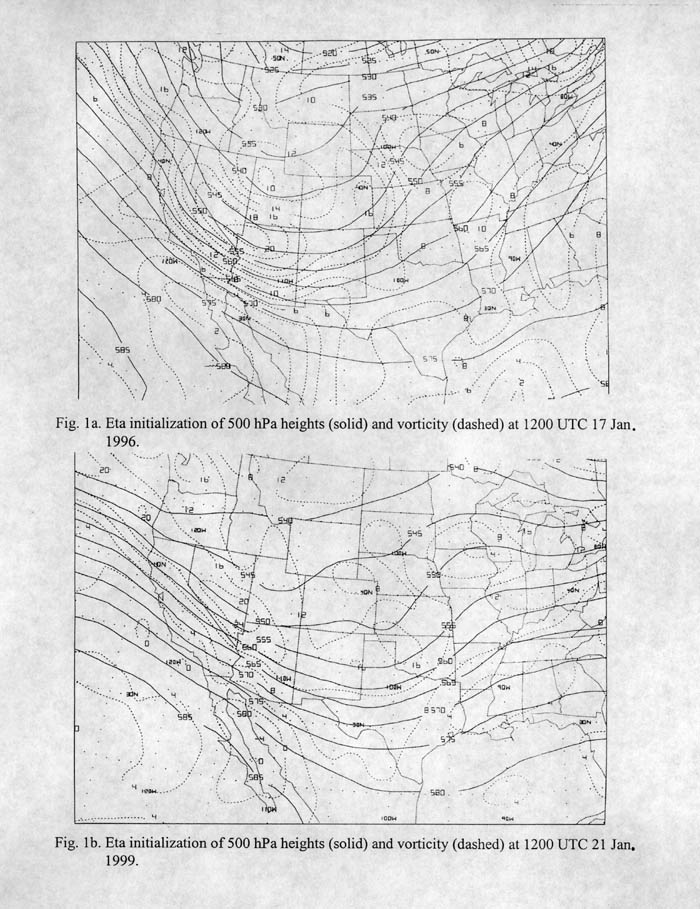
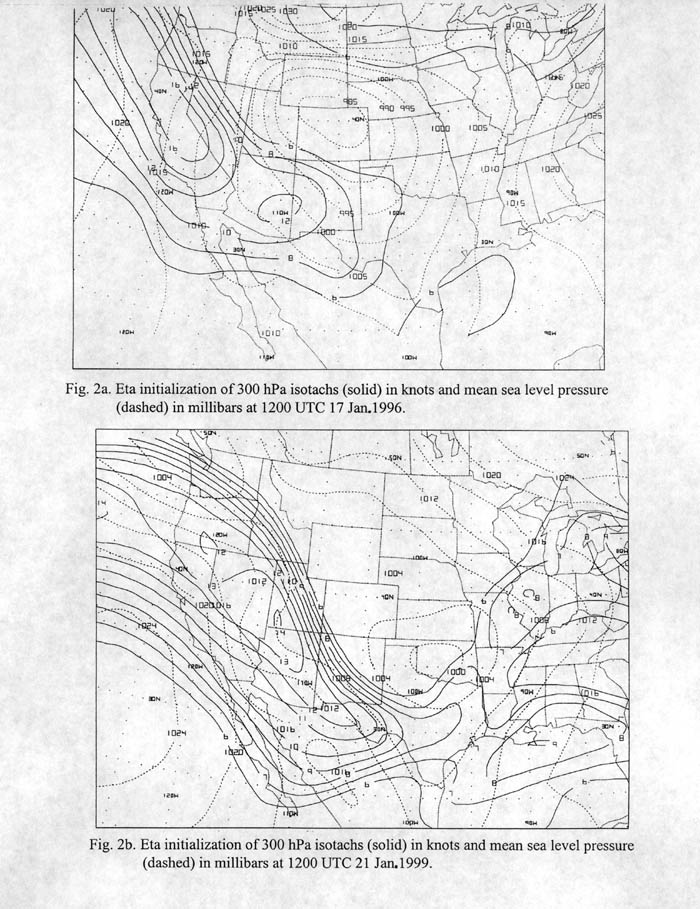
Analysis of the 1200 UTC 17 January 1996 and the 1200 UTC 21 January 1999 data indicates broad mid-level cyclonic patterns across the western continental U.S. with a strong lead shortwave trough in the Great Basin Region (Figs. 1a, b). At 300 hPa isotachs show a strong jet stream diving southeast into the base of the troughs. A surface low pressure center has already developed in the Southern Plains with a significant pressure gradient approaching 4 hPa / 100 nm across west Texas and southeast New Mexico (Figs. 2a, b).
Figure 1
Figure 2 3. Evolution of the Synoptic Pattern and Conventional Indicators of Significant Wind
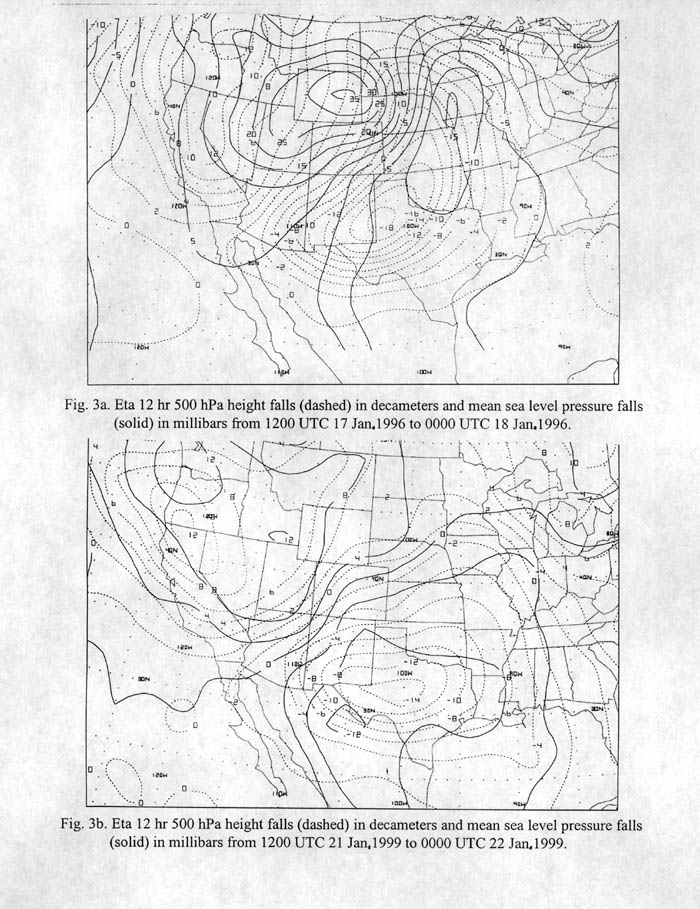
In both cases a 300 hPa jet maximum in excess of 150 kts was moving southeast into the base of the broad trough, which points to an amplifying upper air pattern and possibly a rapidly deepening surface cyclone. This is evident in 140-180 meter 12 hour 500 hPa height falls and attendant surface pressure falls of 10-15 hPa / 12 hours (Figs. 3a, b). These surface pressure falls were located on the poleward side of the 300 hPa polar jet. In fact, 12 hour surface pressure falls were large enough to be classified as a Rapidly Deepening Cyclone (RDC) (Oravec and Grumm 1993). Note that maximum 12 hour surface pressure falls are not located in the study area in the 17 January 1996 case. However, for the 21 January 1999 case the surface pressure fall maxima was in southwest Texas. Based on the pattern aloft and position of the surface low, a westerly surface wind potentially of 20-35 kts sustained was expected.
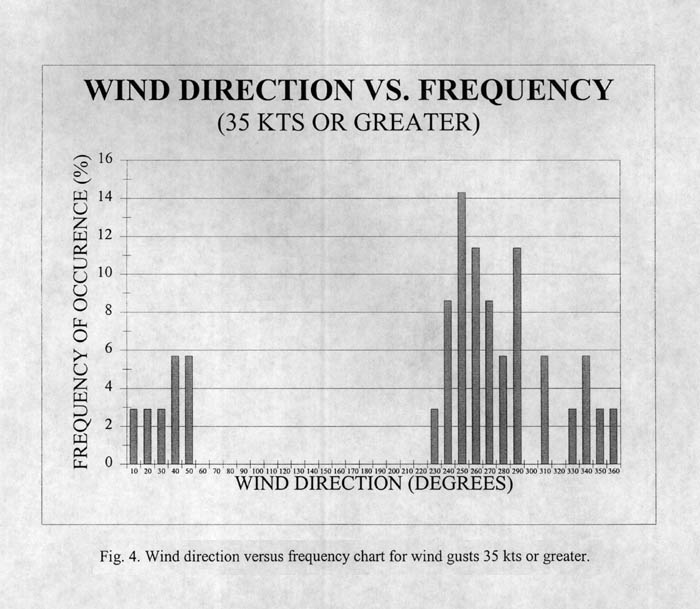
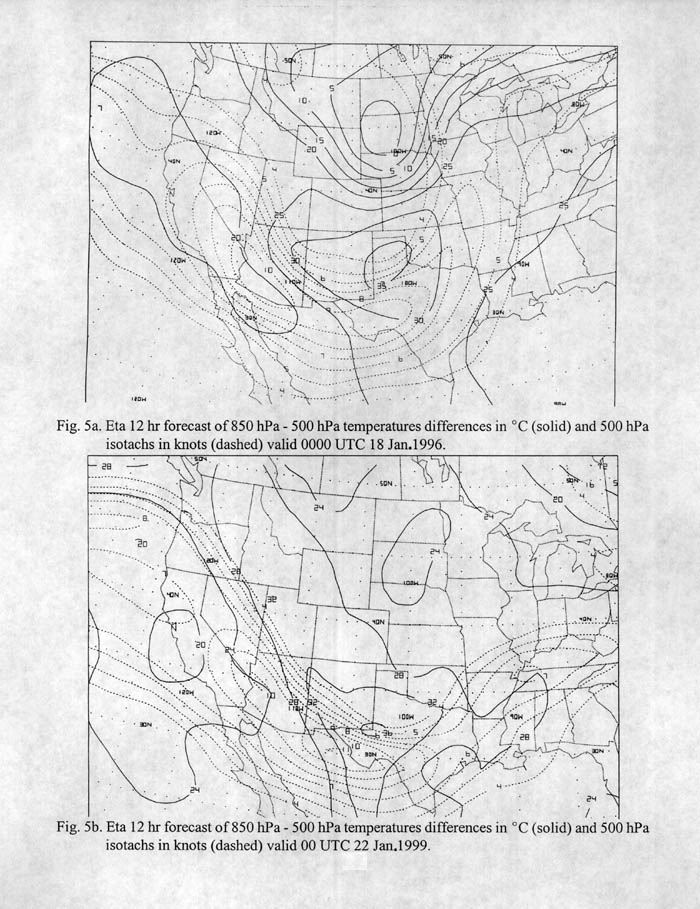
Figure 3 Incorporating local climatology into the forecast process can prove to be valuable. Since blowing dust and significant winds tend to occur concomitantly across west Texas and southeast New Mexico, we will use a local wind and blowing dust study (Shea 1990) to represent the significant wind climatology (gusts 35 kts or greater) for Midland's CWFA. This study indicates that during significant wind events the most common wind direction is from the southwest through west (Fig. 4). This wind direction is different from the most common wind direction associated with blowing dust (northwest to northeast). Since west wind days are usually warm and dry, even in winter, the approach of cold air aloft will result in large vertical temperatures differences. This favors the downward transport of momentum from the strong mid level winds to the surface. In both cases the 500 hPa jet is juxtaposed with the area of largest vertical temperature differences between 850 hPa and 500 hPa (Figs. 5a, b).
Figure 4
Figure 5 Various source regions for dust exist across west Texas and southeast Mexico. The most obvious is from cotton fields across the northern Permian Basin and South Plains. However, west winds do not usually result in dust across the western and central Permian Basin since there is little agriculture to the west of the city of Midland. Still, in significant west wind events suspended dust can advect into the Permian Basin from a source region in northern Mexico (Fig. 6). By recognizing a significant west wind event pattern (amplifying upper trough and 500 hPa jet juxtaposition with the area of largest 850 hPa and 500 hPa temperature differences) one can apply local climatology to the pattern providing a valuable forecast.
Figure 6 4. Applying the Decision Tree for High Winds
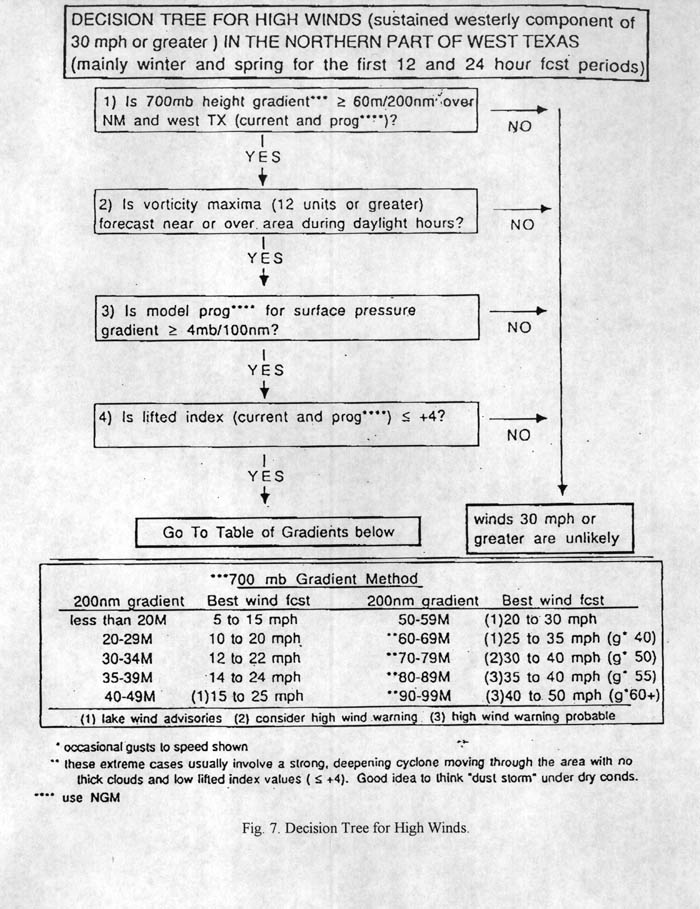
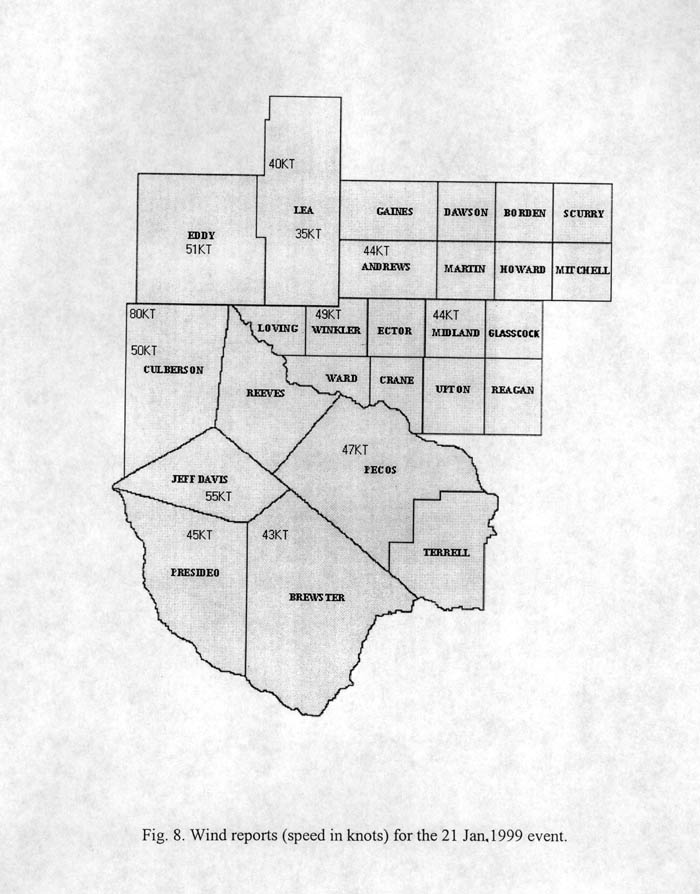
Several years ago forecasters at the National Weather Service in Lubbock, Texas developed a decision tree for forecasting high winds (Fig. 7). An assumption was that through repetitive wind events, forecasters were able to recognize patterns favorable for the development of high winds across west Texas. Parameters recognized to be important were: 1)700 hPa gradient; 2) presence of a vorticity maxima; 3) surface pressure gradient; 4) and lifted index </= 4. Since the 700 hPa gradient is directly related to the strength of the wind at that level and since west wind events tend to occur on warm days (west downslope winds), mixing to and momentum transfer from the 700 hPa level impact the surface. The presence of a vorticity maximum is usually associated with a speed max and surface pressure falls which tend to favor increased surface winds per a tightening pressure gradient. Finally, a general indication of the potential for mixing is used via the lifted index. Contemporary forecasters are probably more familiar inferring the mixing potential by looking at lapse rates or vertical temperature differences from near the surface to mid levels (i.e. 850 hPa and 500 hPa). Applying data from 21 January 1999 to the decision tree supports sustained winds 35 kts with gusts to 48 kts. This verified well across the area with several measured gusts in the 45-50 kt range (Fig. 8).
Figure 7
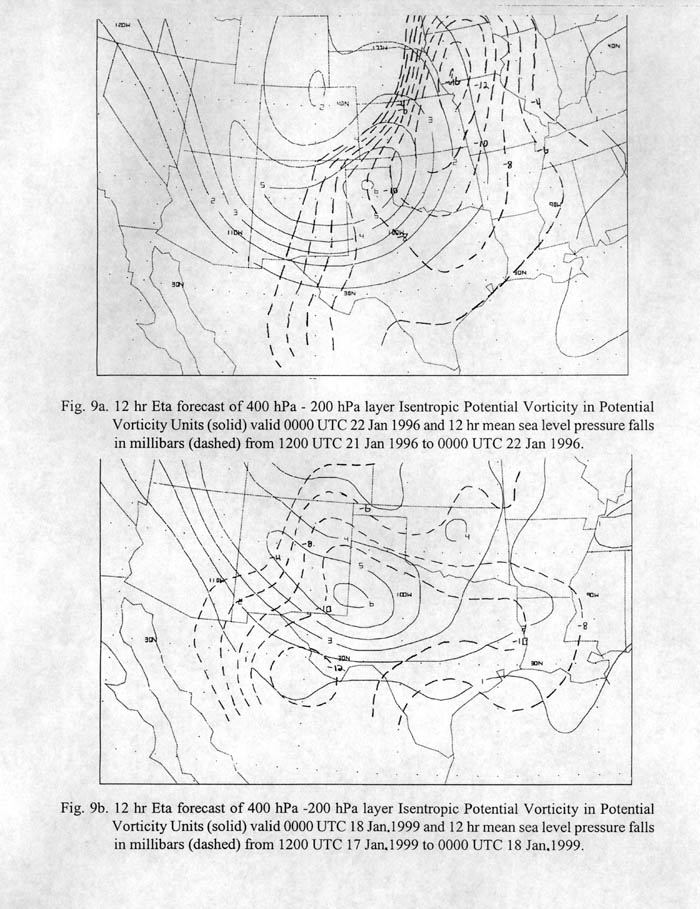
Figure 8 5. Non-Conventional Indicators - Isentropic Potential Vorticity (IPV)
The new Advanced Weather Interactive Processing System (AWIPS) allows the forecaster a means to interrogate the atmosphere using non-conventional techniques and methods. One such method is the Isentropic Potential Vorticity concept. Strong upper level systems can tap into the stratosphere's source of high potential vorticity (PV). Since PV along isentropic surfaces is conserved, for frictionless adiabatic flow (Rossby, 1940), the absolute vorticity must increase if the static stability decreases, so the PV can be conserved. Areas where this occurs may be associated with the deepening of surface cyclones. Positive IPV advection at upper levels when combined with favorable low level parameters like low static stability can subsequently lead to favored regions of more rapid cyclogenesis. Bluestein (1993) indicates that IPV values of 1.5 Potential Vorticity Units and higher are typically associated with stratospheric air. Figures 9a and 9b show an intrusion of stratospheric air which was generally located upstream from the center of maximum pressure falls. Since the IPV concept has been applied to only these two cases, forecasters will have to apply IPV to similar events, especially in the short term, to see if there is a consistent trend for surface cyclogenesis to occur more rapidly in these areas.
Figure 9
6. Conclusion
Pattern recognition is an important tool for forecasting significant wind events. However, other aspects (e.g. cloud cover) still have to be taken into account. Experience suggests that these potent systems capable of producing significant west winds tend to have mid and upper level moisture associated with them. Forecasters must be leery of the development of lee-enhanced clouds, which can quickly increase in areal coverage, greatly inhibiting the mixing process and resulting in a missed wind forecast. Perhaps not surprising is that this pattern recognition scheme is going to be most successful in the short-term or first period of a forecast. Real time data sets like the wind profiler at White Sands, surface observations, and satellite imagery can be incorporated into the forecast. The discussion in this study does illustrate that local familiarity and pattern recognition can be meshed to provide a more valuable forecast.
These two cases suggest that the most important elements to recognize for significant west wind events are an amplifying upper air pattern along with a potent 500 hPa jet that is juxtaposed with an area of large vertical temperature differences from near the surface to mid levels. Rapidly Deepening Cyclones are a tribute to the strength of a system; however it is evident in these two events that the maximum pressure falls need not necessarily be in the CWFA. Proven decision trees, like those designed for high winds have a place in the operational setting. Decision trees help determine if the event will occur and may even be able to quantify the event in some manner. In the case of high west wind events, forecasters can quantify their wind forecasts from general wind categories through advisory and warning criteria. Use of modern forecast equipment may further facilitate the forecast process by applying techniques like IPV. Until further research is done using IPV across west Texas and southeast New Mexico, it is suggested that pattern recognition skills be used to diagnose high west wind events.
7. Acknowledgments
The authors thank Brian Francis, Science and Operations Officer at Midland, Texas and Loren Phillips, Science and Operations Officer at Lubbock, Texas for their helpful comments and review of this paper.
8. References
Bluestein, H., 1993: Synoptic-Dynamic Meteorology in Midlatitudes, Volume II, Observations and Theory of Weather Systems, Oxford University Press, pg. 182.
Gerand, A., C. Mead, S. Miller, R. Pfost and P. Wolf, 1998: Surprise Snow Storm Socks Louisiana, Mississippi, and Alabama, U.S. Dept of Commerce, National Oceanic and Atmospheric Administration, National Weather Service, NOAA Technical Attachment NWS SR/SSD 98-5.
Oravec, R.J. and R.H. Grumm, 1993: The prediction of rapidly deepening cyclones by NMC's Nested Grid Model: Winter 1989-Autumn 1991. Wea And Forecasting, 8, 248-270.
Rossby, C.G., 1940: Planetary Flow Patterns in the Atmosphere, Quart. J. Roy. Meteor. Soc., 66, Suppl., 68-87.
Shea, T., 1990: Blowing Dust Climatology for Midland, TX. Local publication.
U.S. Dept. of Commerce, National Oceanic and Atmospheric Administration, National Weather Service Training Center Forecaster's Development Course booklet, 1996: Potential Vorticity.