January 1, 2021 Spring and Summer Streamflow Forecasts
Upper Missouri Basin
The high elevation snow pack in the Upper Missouri Basin as of January 1
was near to above average. The snow pack in the St. Mary Basin was 110 percent, and the
Milk River Basin was 145 percent.
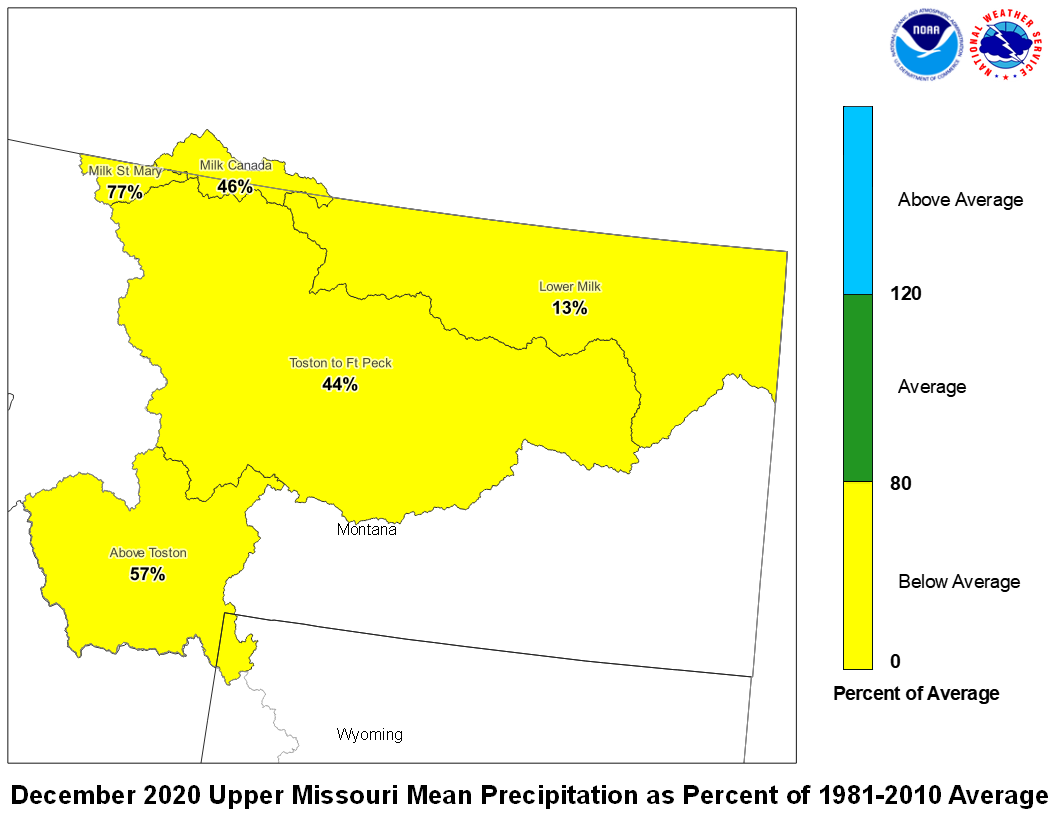
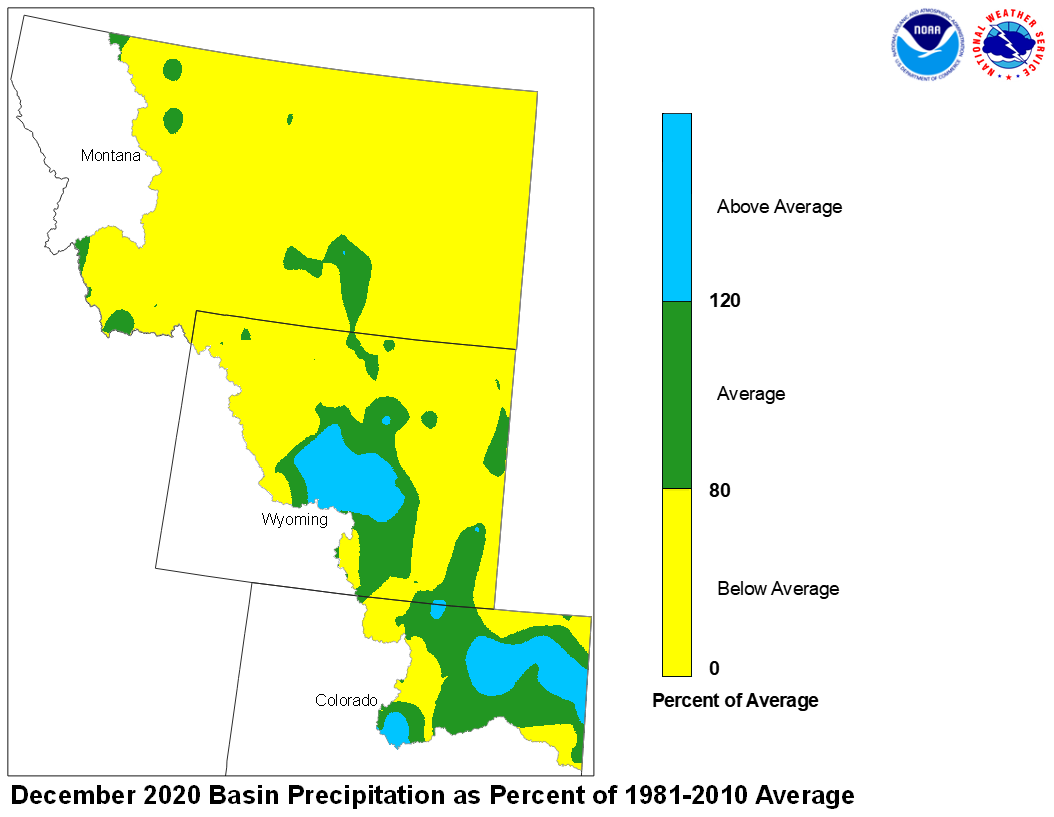
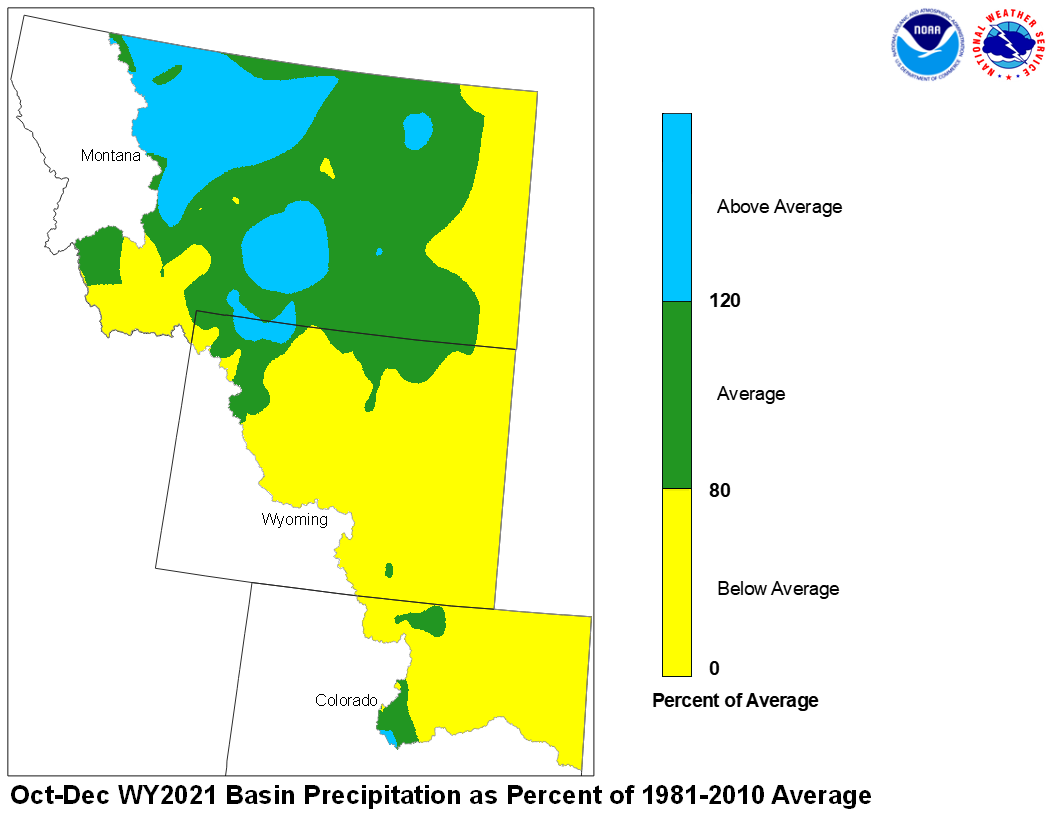
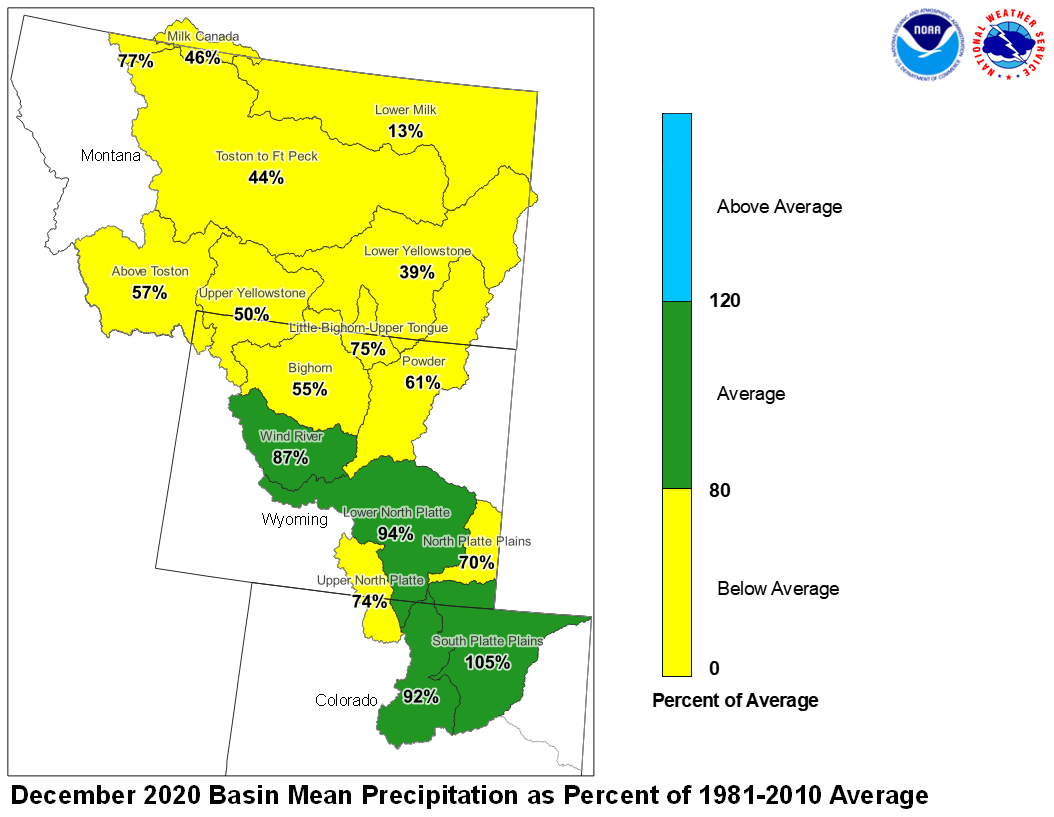
December precipitation across the Upper Missouri Basin was below average.
Basin precipitation summaries for the Missouri Basin include: Milk St. Mary,
77 percent; Milk Canada, 46 percent; Lower Milk, 13 percent; above Toston,
57 percent; Toston to Ft. Peck, 44 percent.
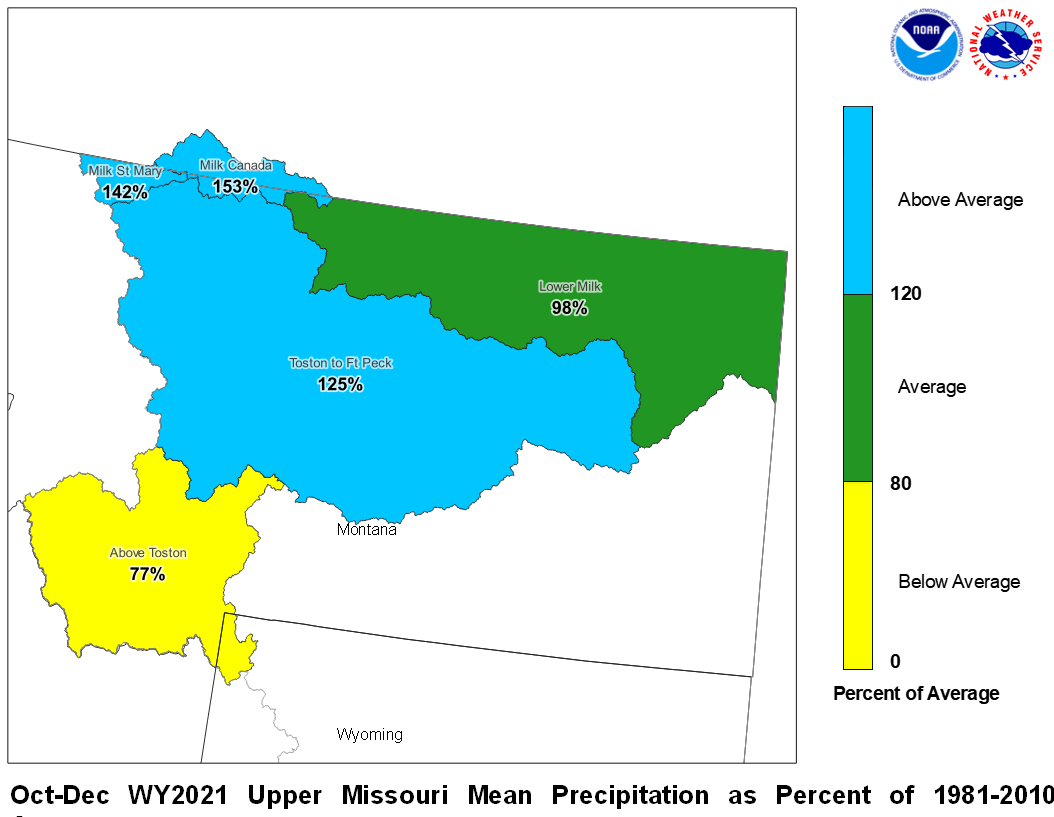
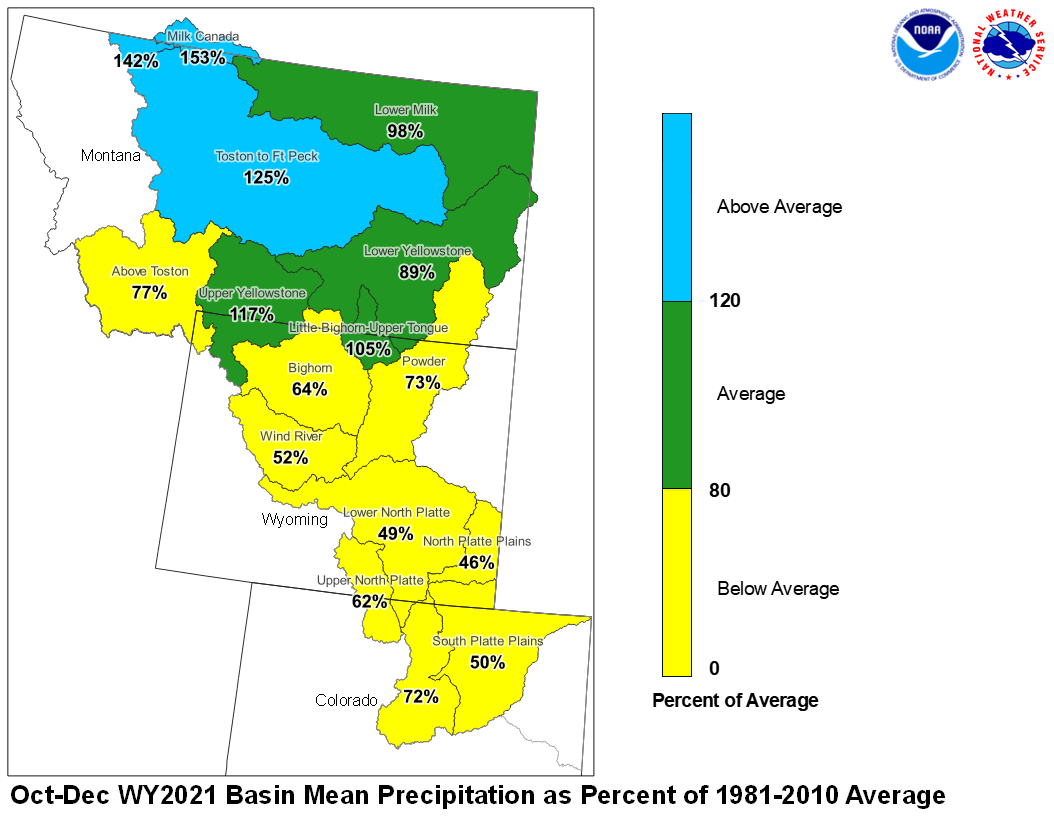
December 2020 Upper Missouri Mean Precip Oct-Dec WY2021 Upper Missouri Mean Precip
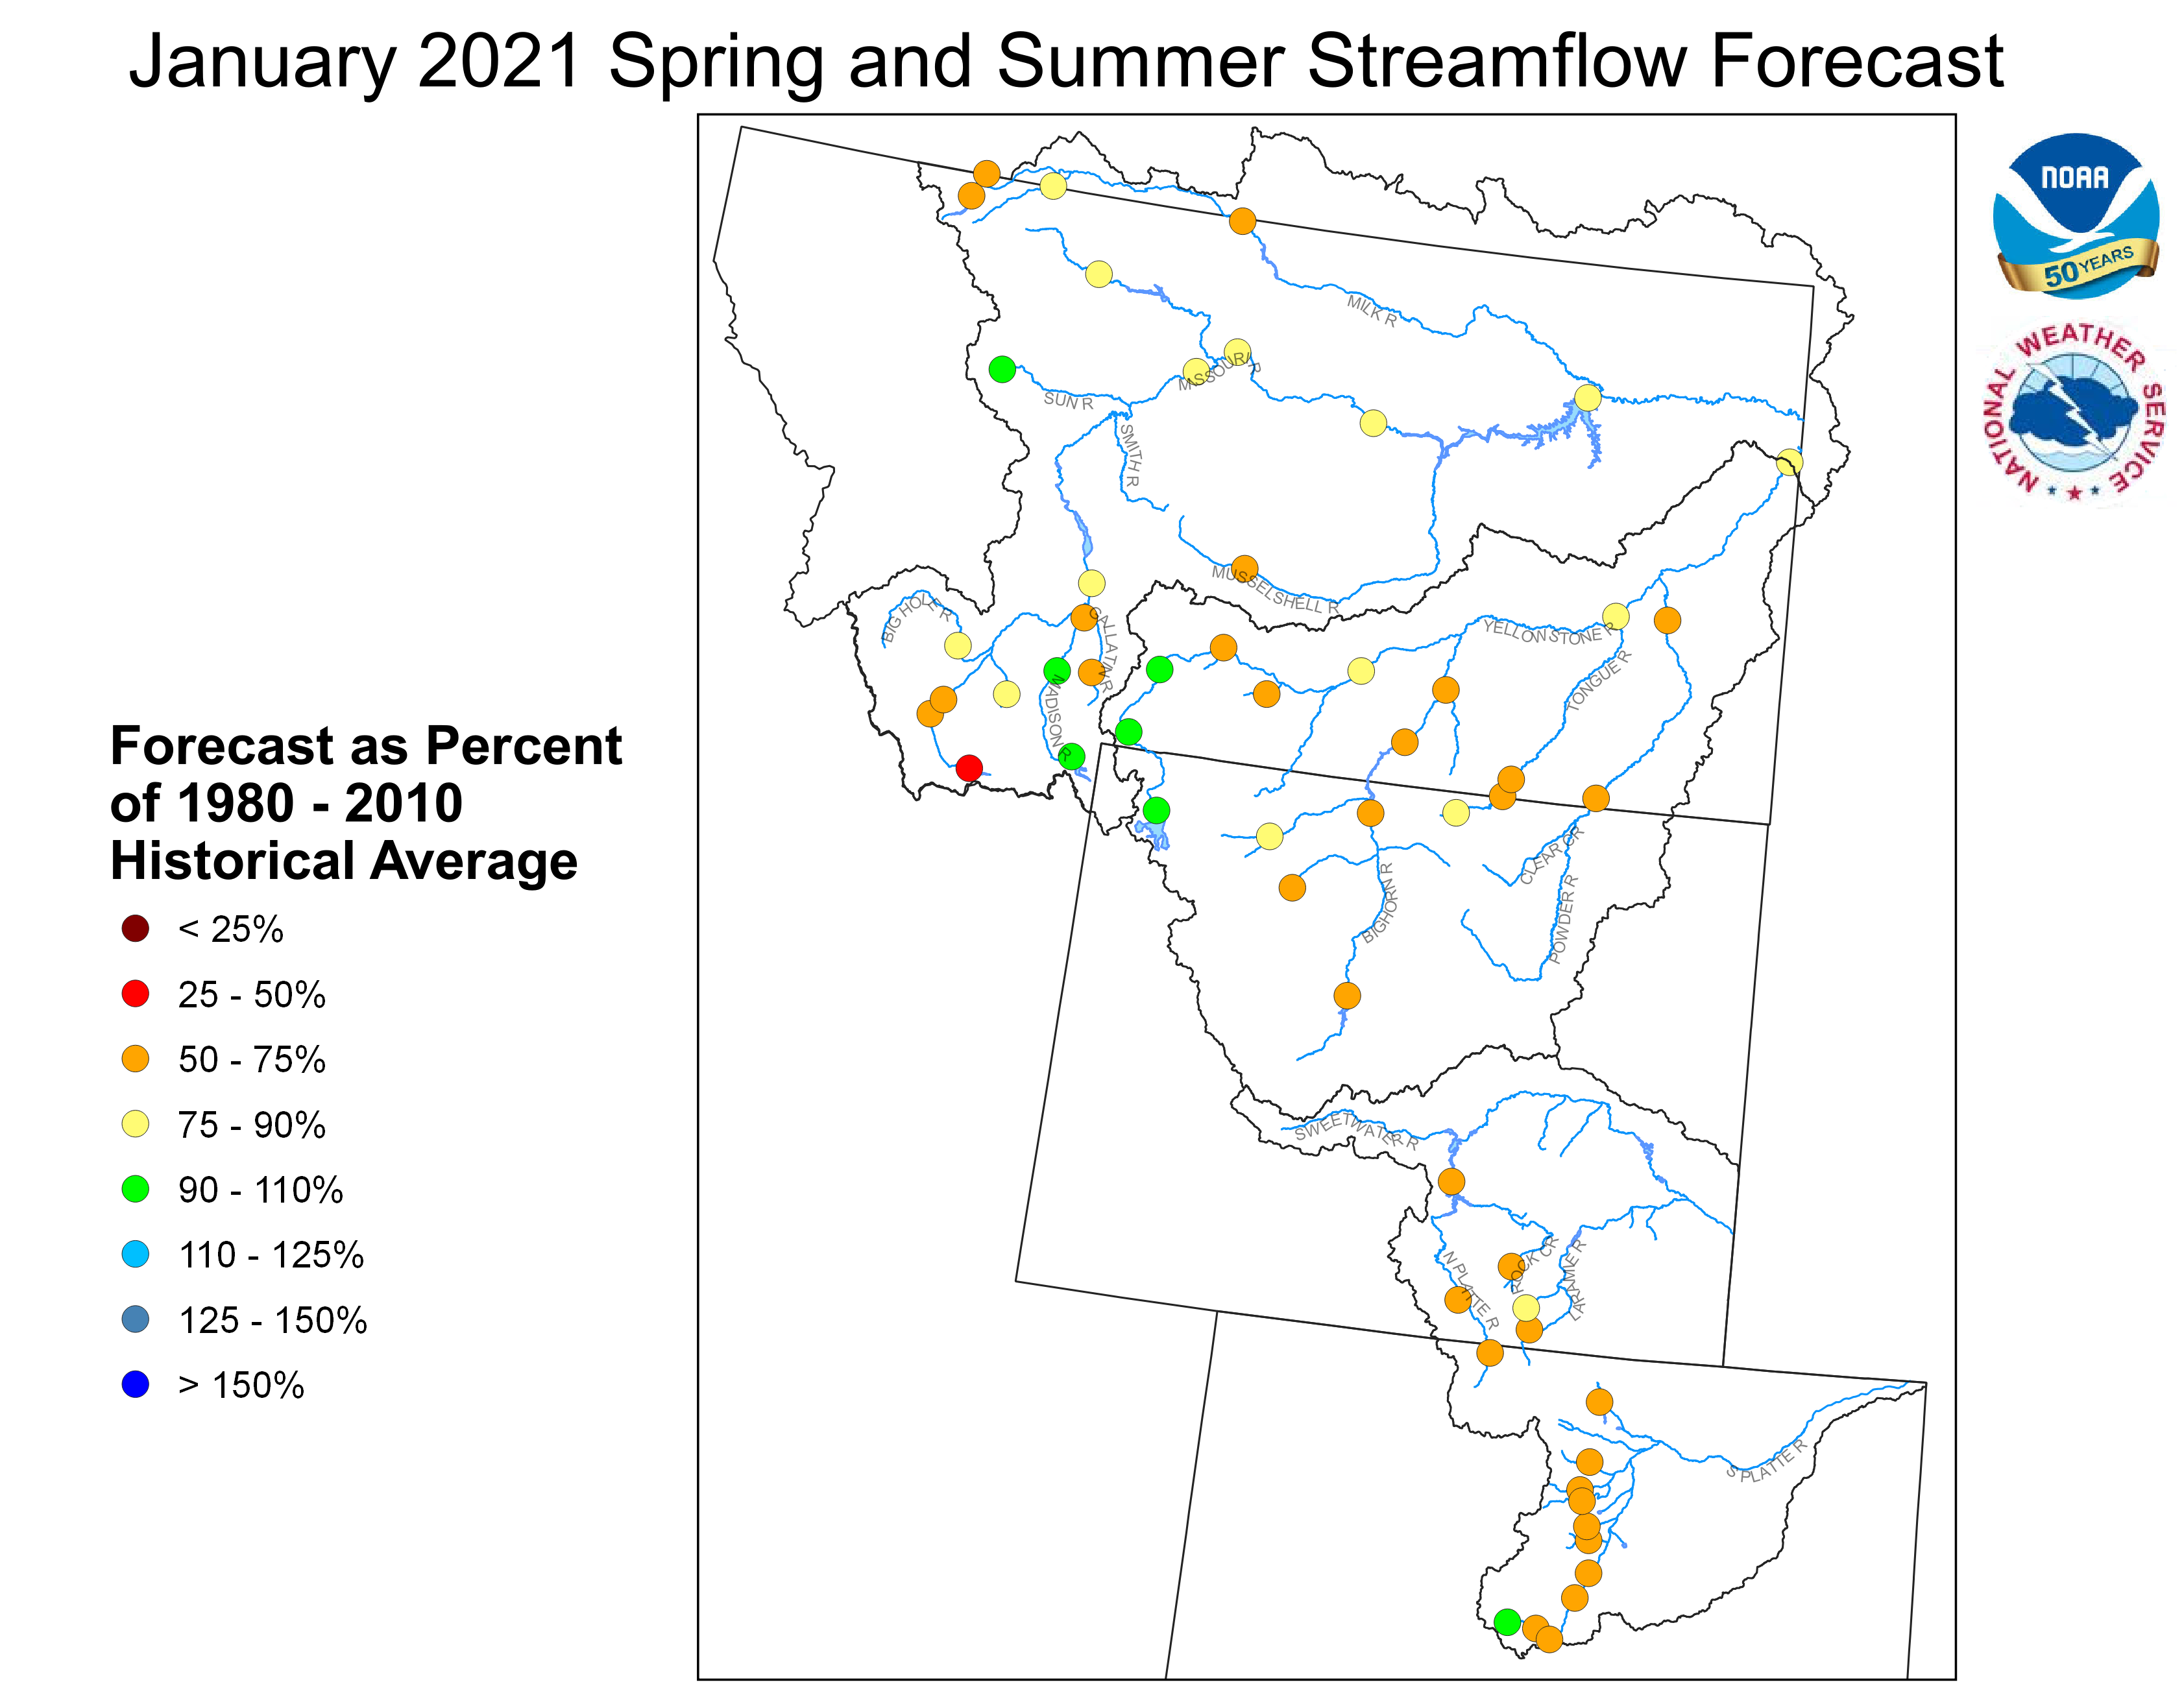
Stream flow in the Upper Missouri Basin is forecast to be
below average during the upcoming Spring and Summer.
The St. Mary River is forecast to have 65 percent of average
April-September flows. Runoff is expected to range around
85 percent of average for the Missouri Basin above Fort Peck,
Montana.
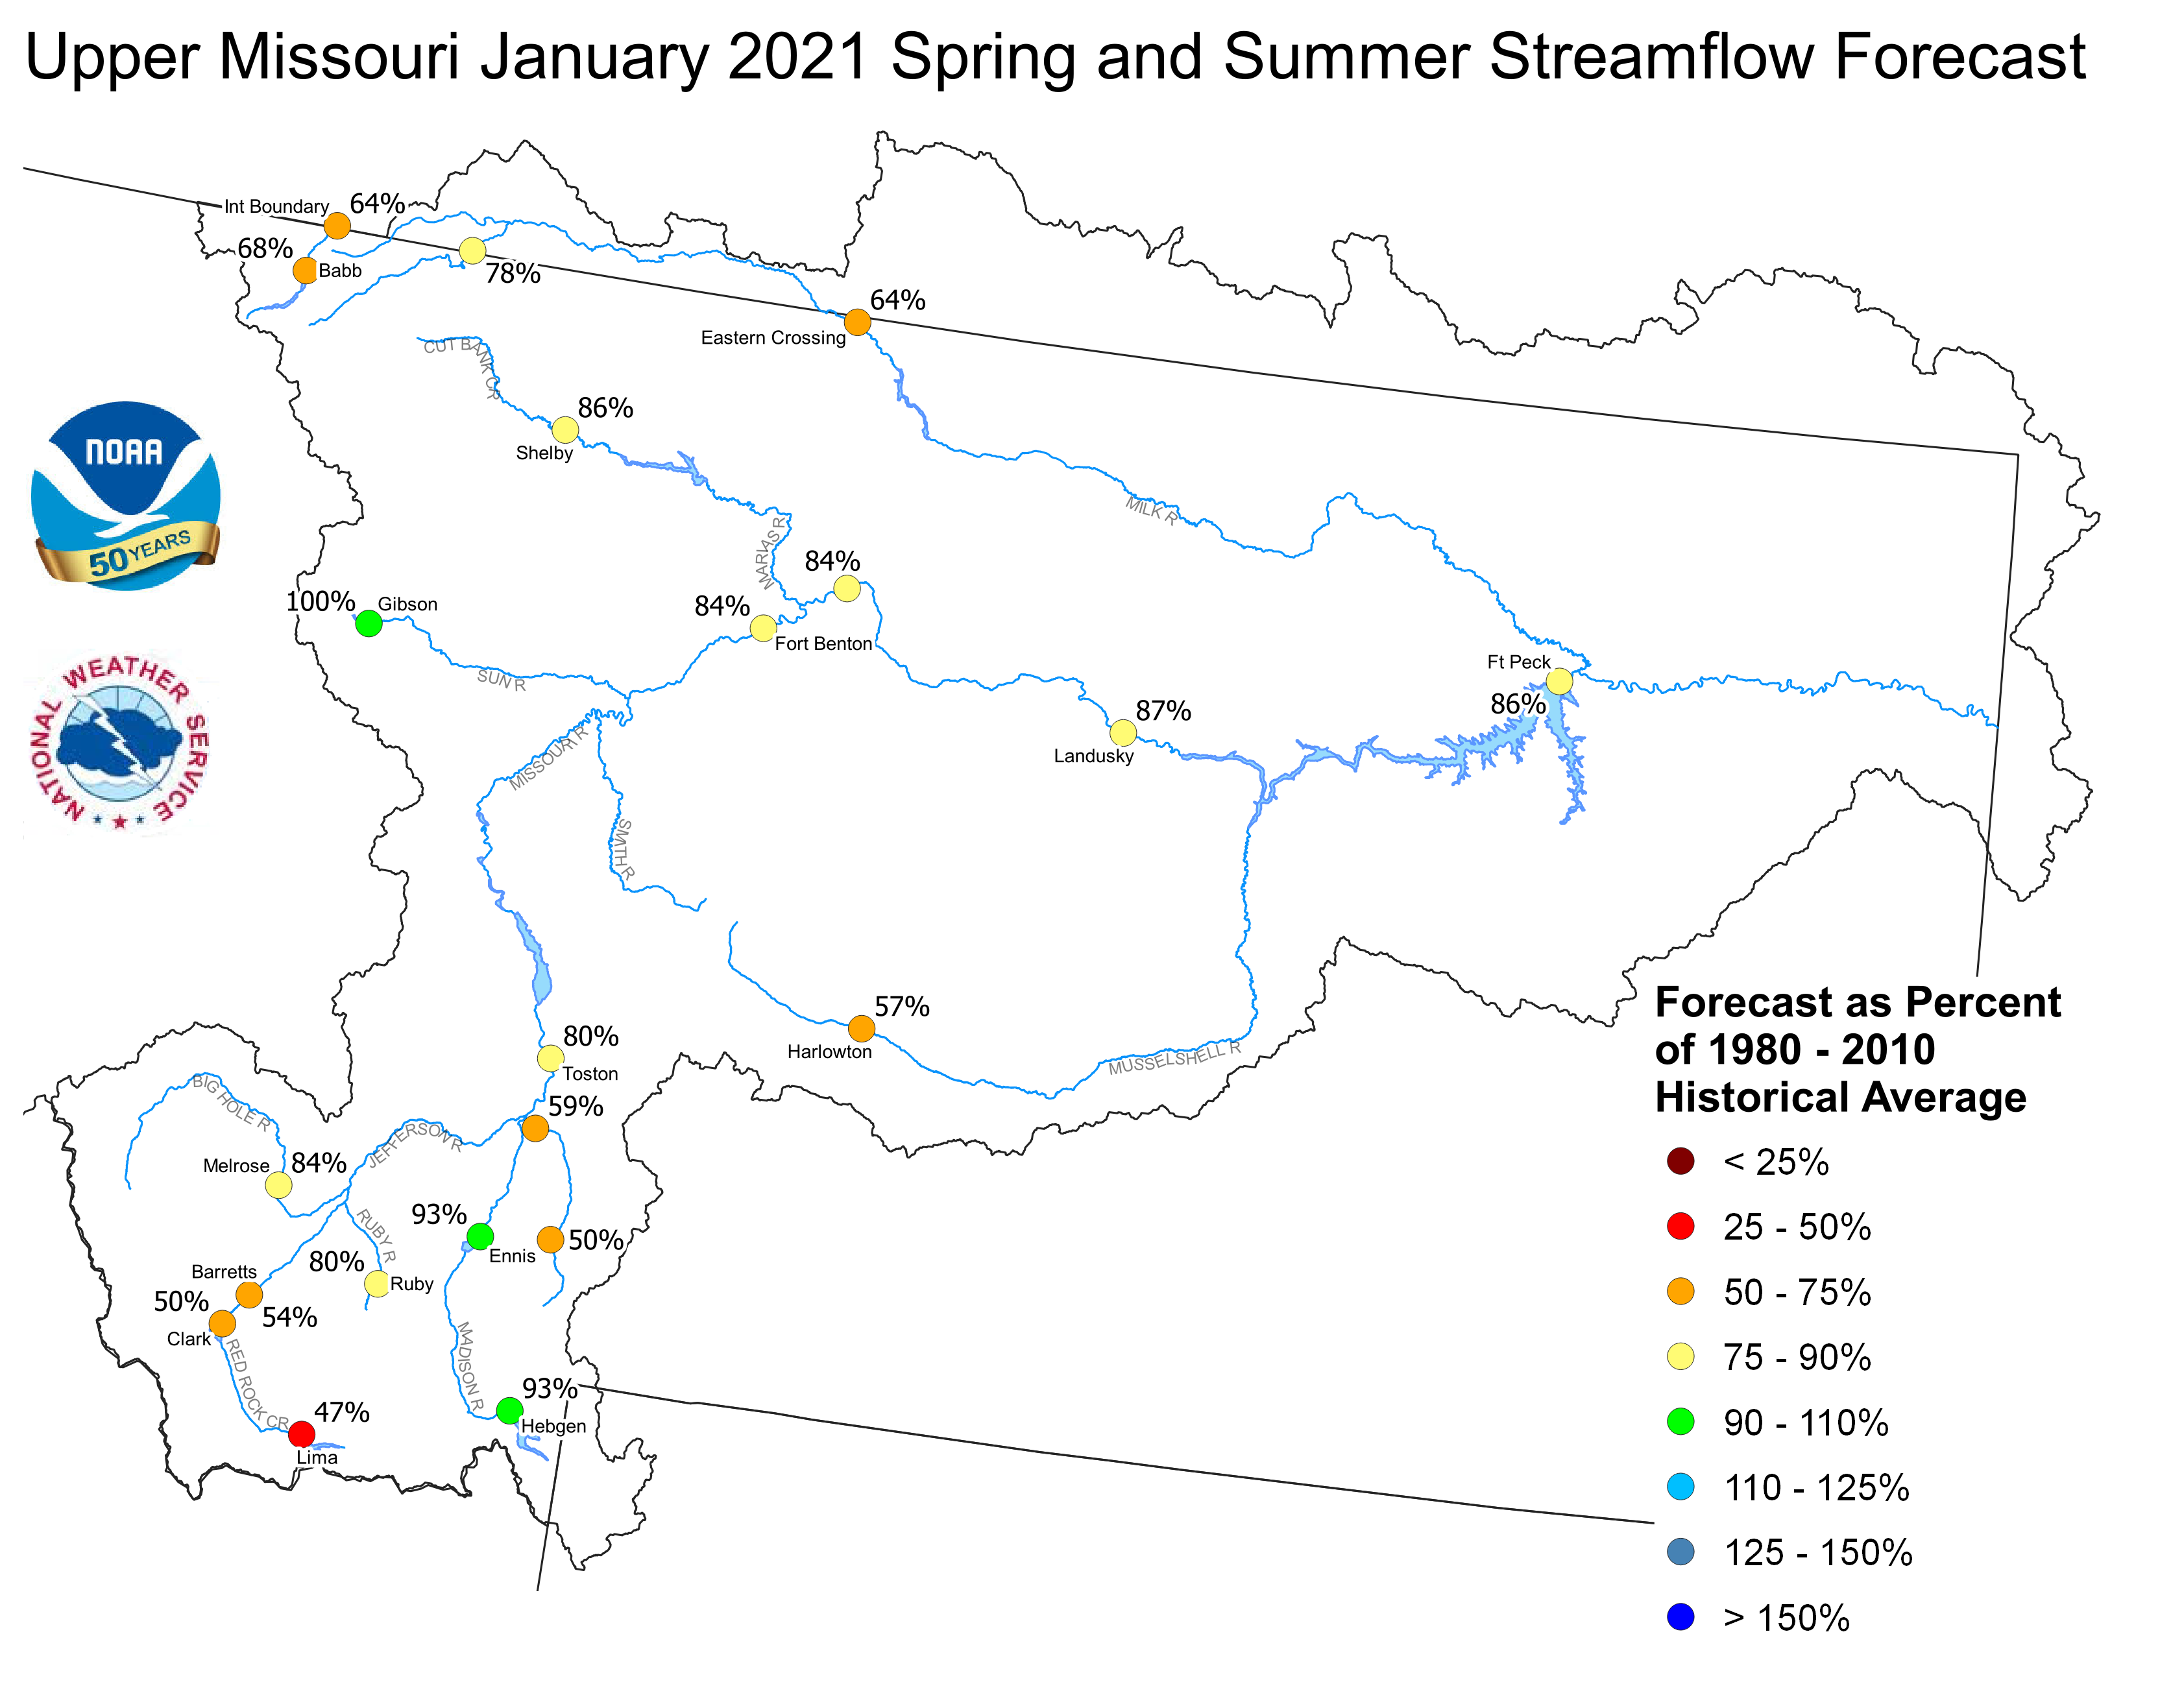
Upper Missouri January 1, 2021 Spring and Summer Streamflow Forecasts
Of the four major irrigation reservoirs in Montana; Lima
Reservoir had 138 percent average storage, Clark Canyon was
holding 108 percent of average water, Gibson Reservoir had 84
percent of average stored water, and Fresno Reservoir had
67 percent of average stored water.
Yellowstone Basin
The high elevation snow pack in the Yellowstone Basin was above average
on January 1. The snow pack in the Upper Yellowstone Basin was 96 percent
of average. The snow packs in the Wind, Bighorn, and Shoshone Basins were 82,
83, and 99 percent of average, respectively. The snow packs in the Tongue
and Powder basins were 86 and 75 percent of average, respectively.
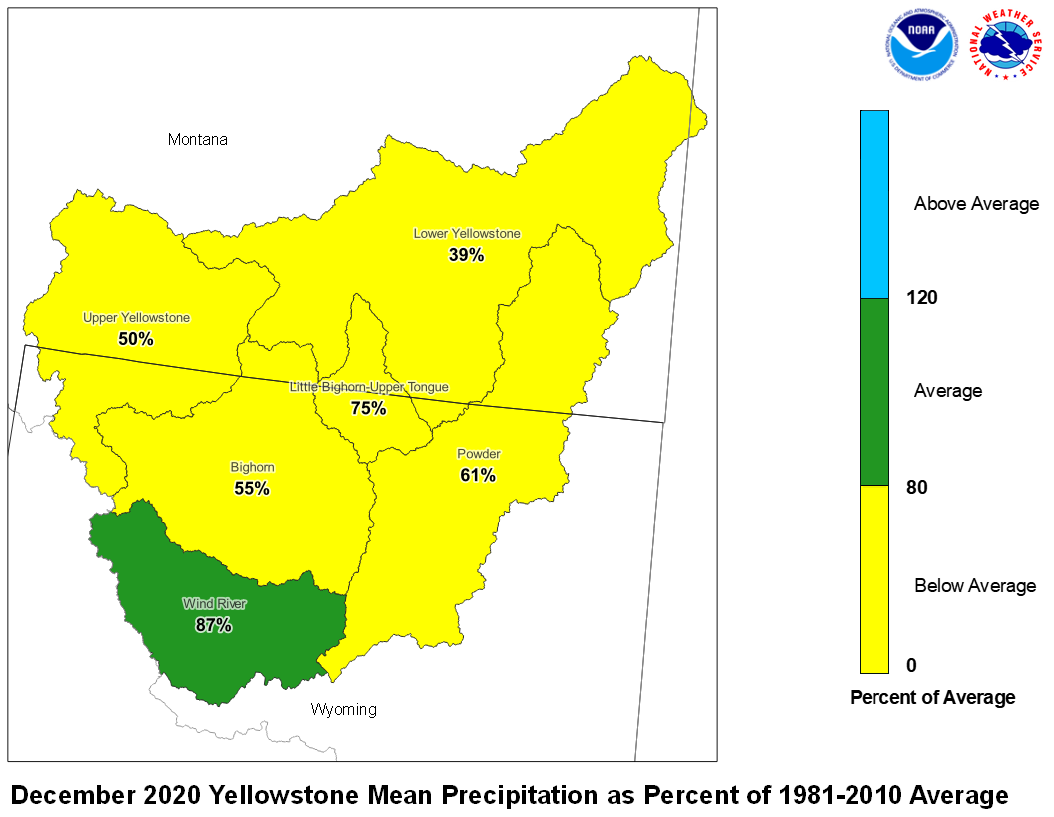
Precipitation during December was below average. The upper Yellowstone
River Basin received 50 percent of average precipitation while the
Lower Yellowstone River Basin reported 39 percent of average. The
Bighorn Basin received 55 percent of average precipitation while the
Wind River Basin received 87 percent of average. The Little Bighorn -
Upper Tongue Basin received 75 percent of average and the Powder River
had 61 percent of average precipitation.
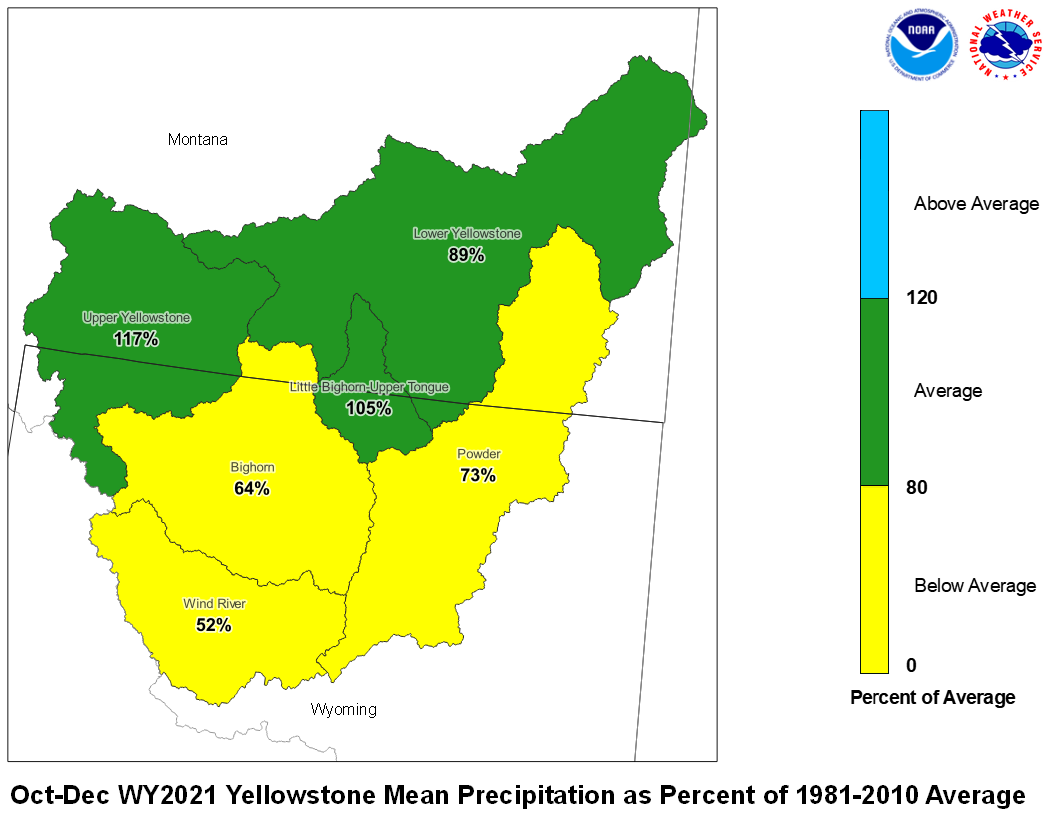
December 2020 Yellowstone Mean Precip Oct-Dec WY2021 Yellowstone Mean Precip
Forecast stream flow in the Yellowstone Basin is below average
for the upcoming Spring and Summer. Stream flow for the
Yellowstone River above Sidney, Montana is forecast to be about
80 percent of average. Flow in the Tongue Basin is expected to be
69 percent of average. Flows in the Powder River are expected
to be about 52 percent of average.
Monthend storage at Boysen Reservoir was 100 percent of average.
Stored water in Buffalo Bill Reservoir was 126 percent of average.
Monthend storage was 101 percent of average at Bighorn Reservoir.
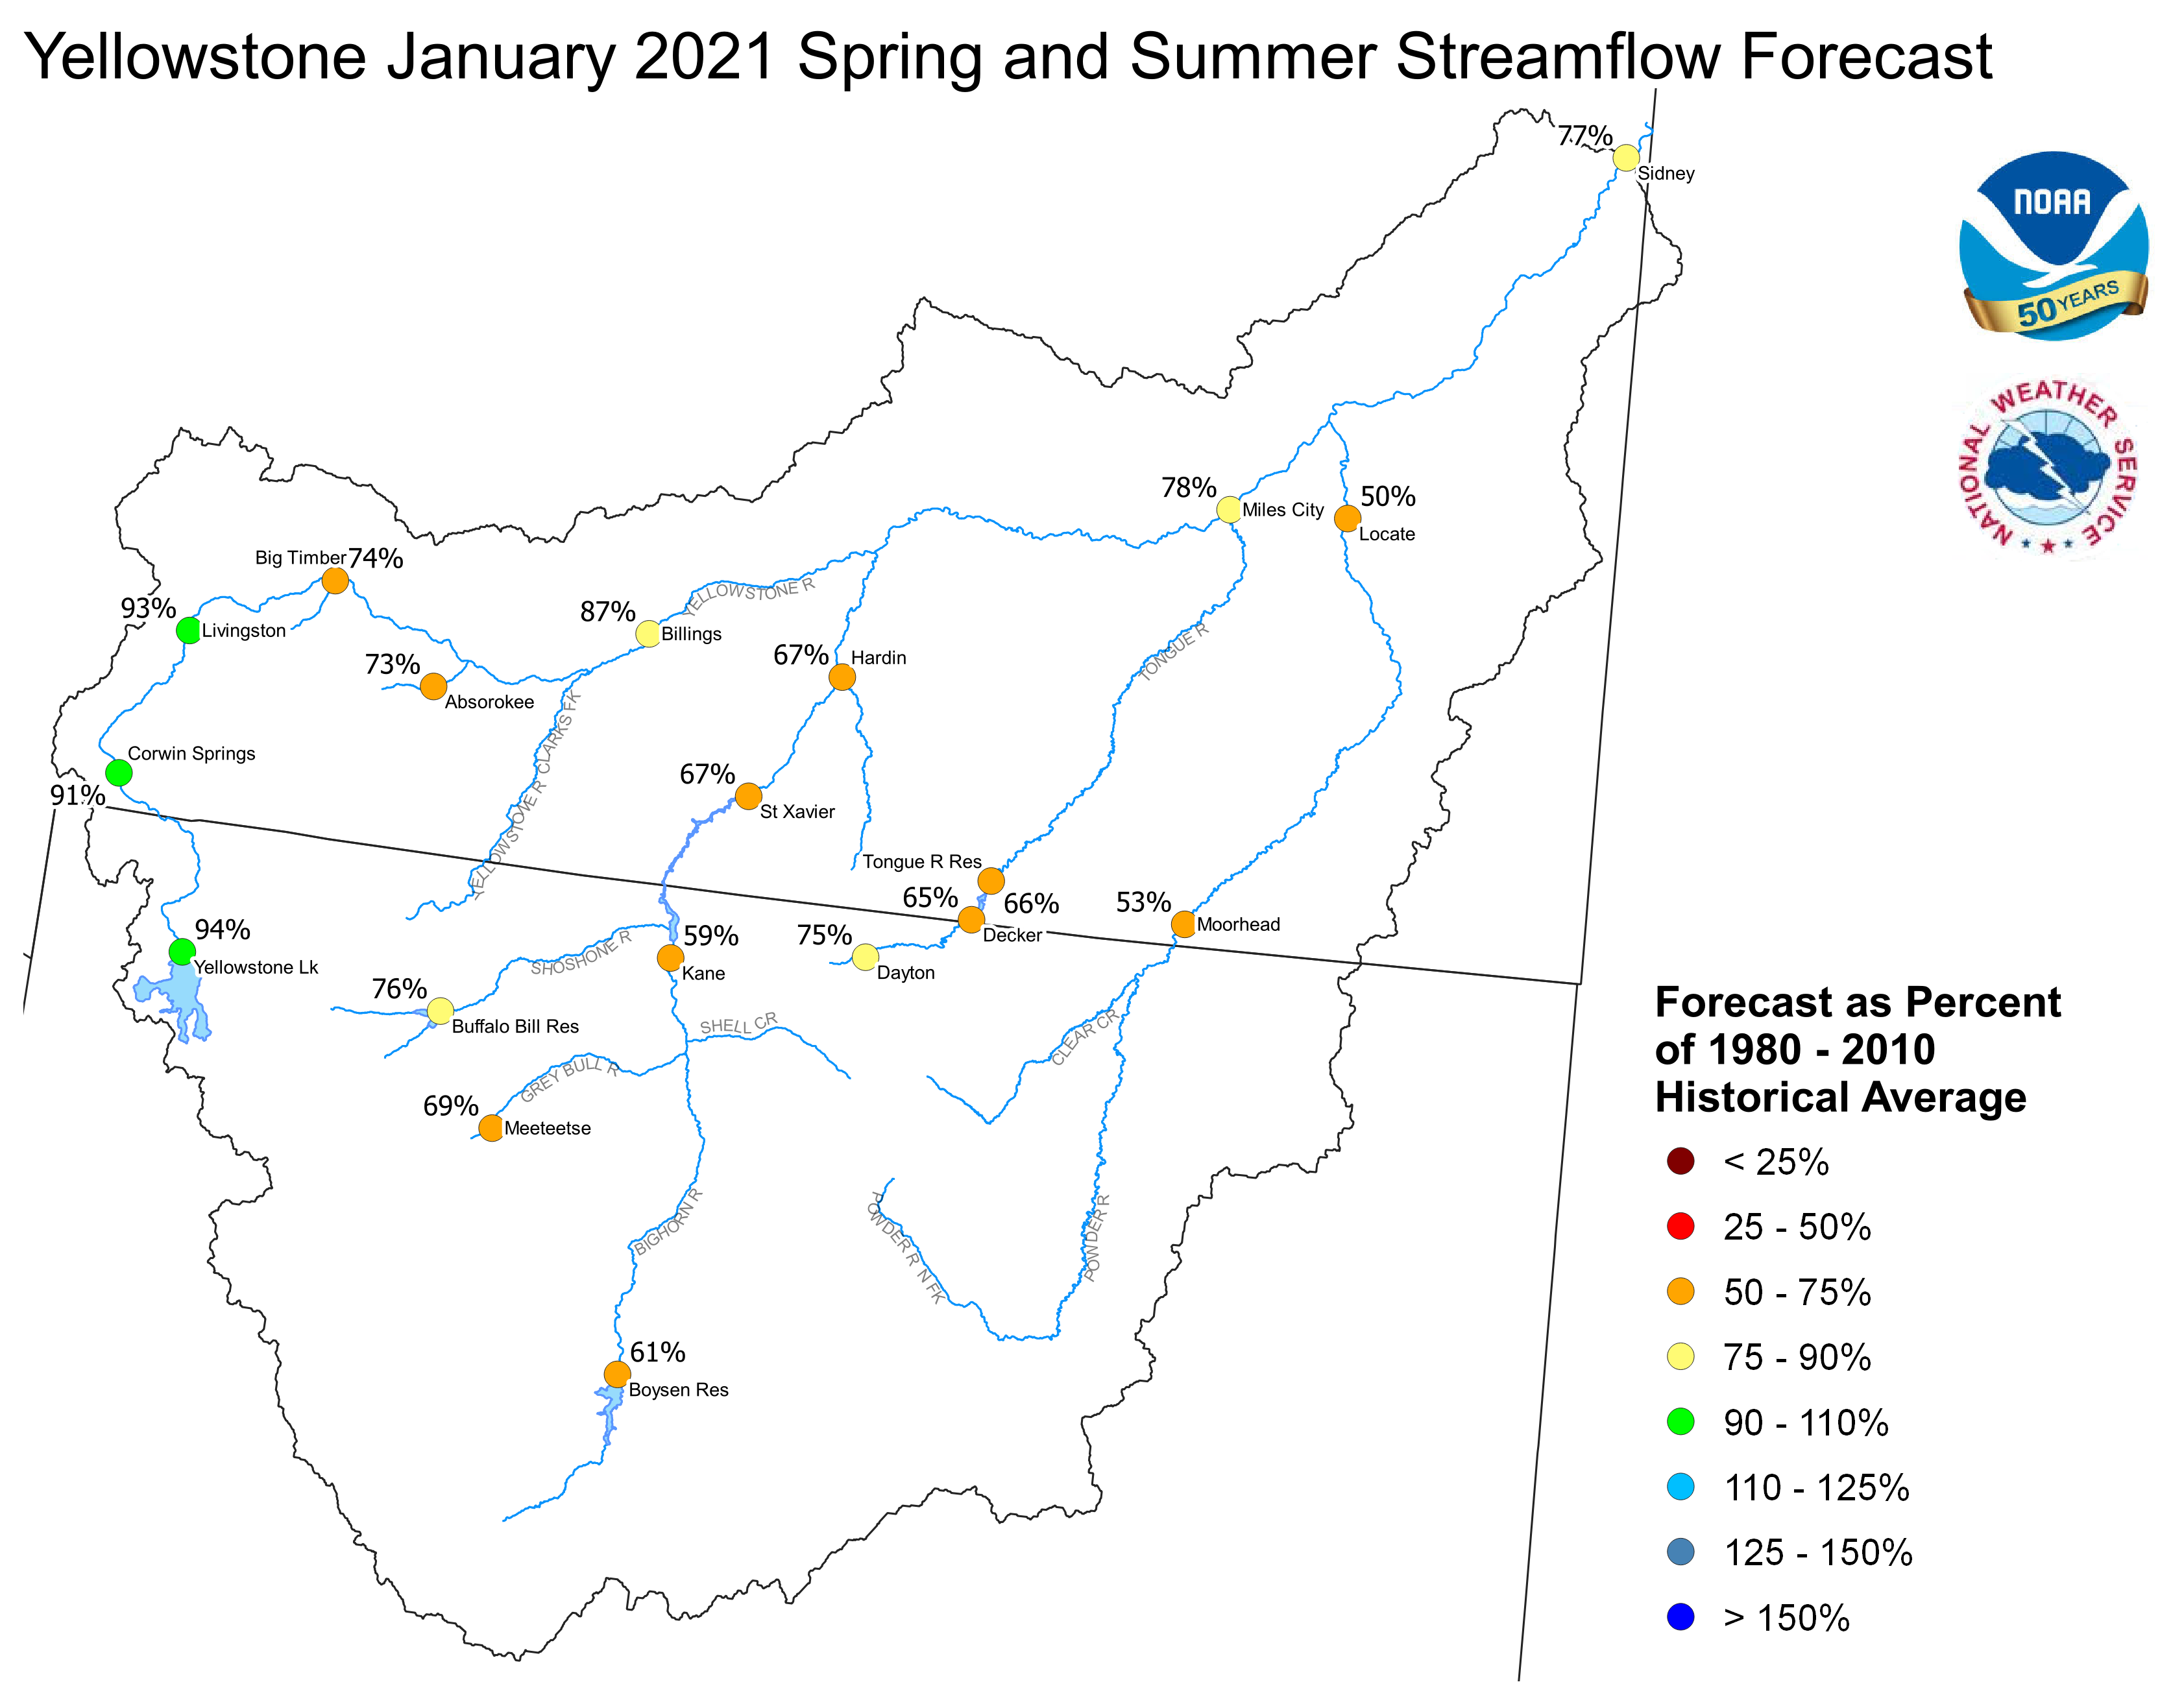
Yellowstone January 1, 2021 Spring and Summer Streamflow Forecasts
Platte Basin
The high elevation snow pack in the Upper North Platte Basin was
112 percent of average on January 1. The snow pack in the North Platte
Basin below Seminoe Reservoir was 109 percent of average. The snow
pack in the South Platte Basin was 108 percent of average.
Precipitation during December in the Upper North Platte Basin was 74
percent of average. In the Lower North Platte Basin, precipitation
was 94 percent of average. The North Platte Plains below Guernsy
Reservoir had 70 percent. The South Platte Mountains had 92
percent whereas the Plains had 105 percent of average December
precipitation.
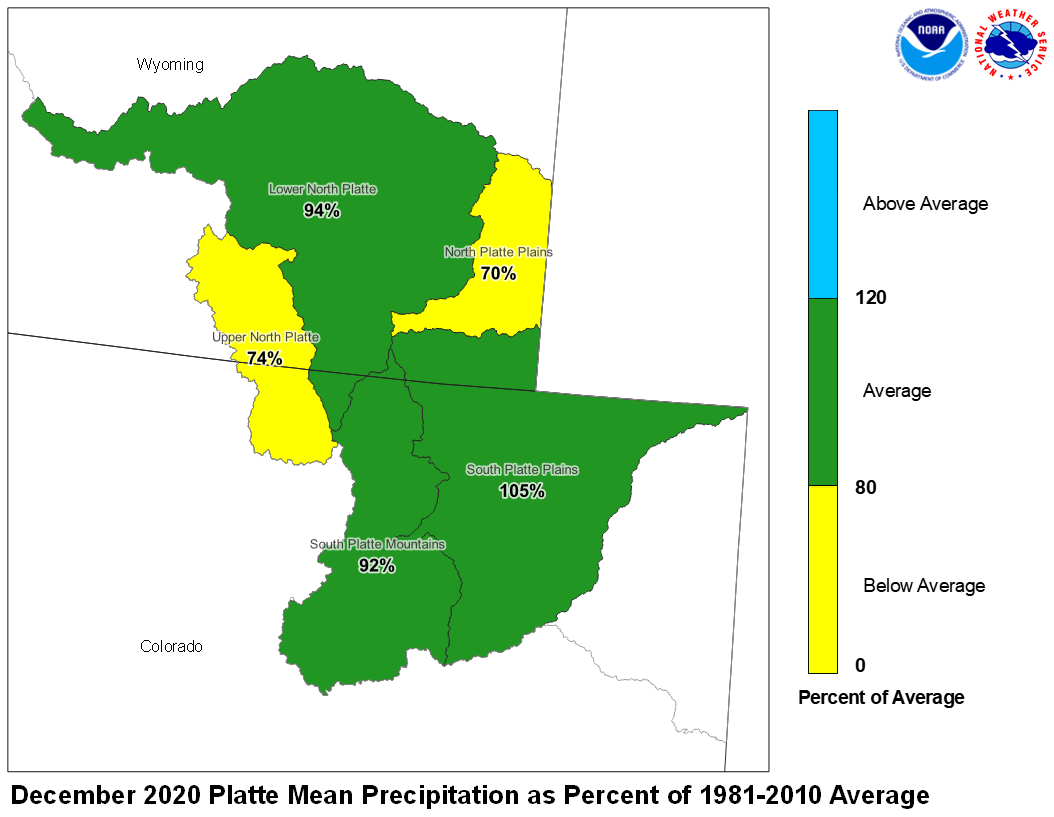
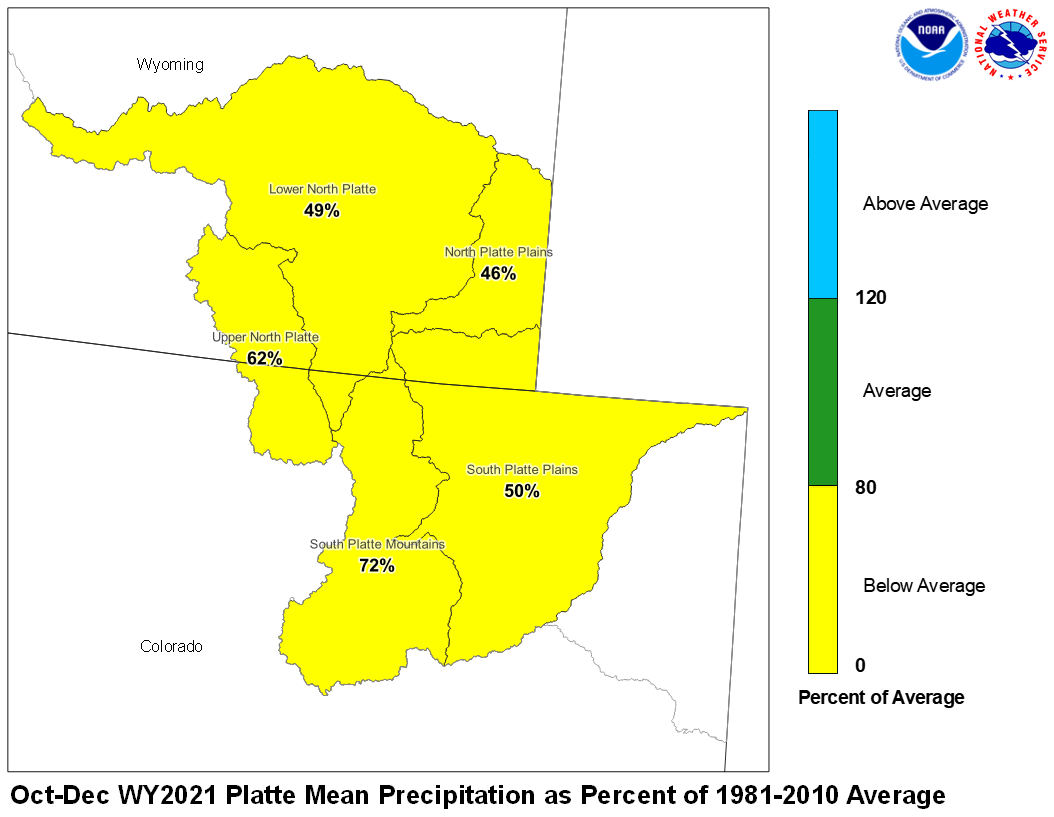
December 2020 Platte Mean Precip Oct-Dec WY2021 Platte Mean Precip
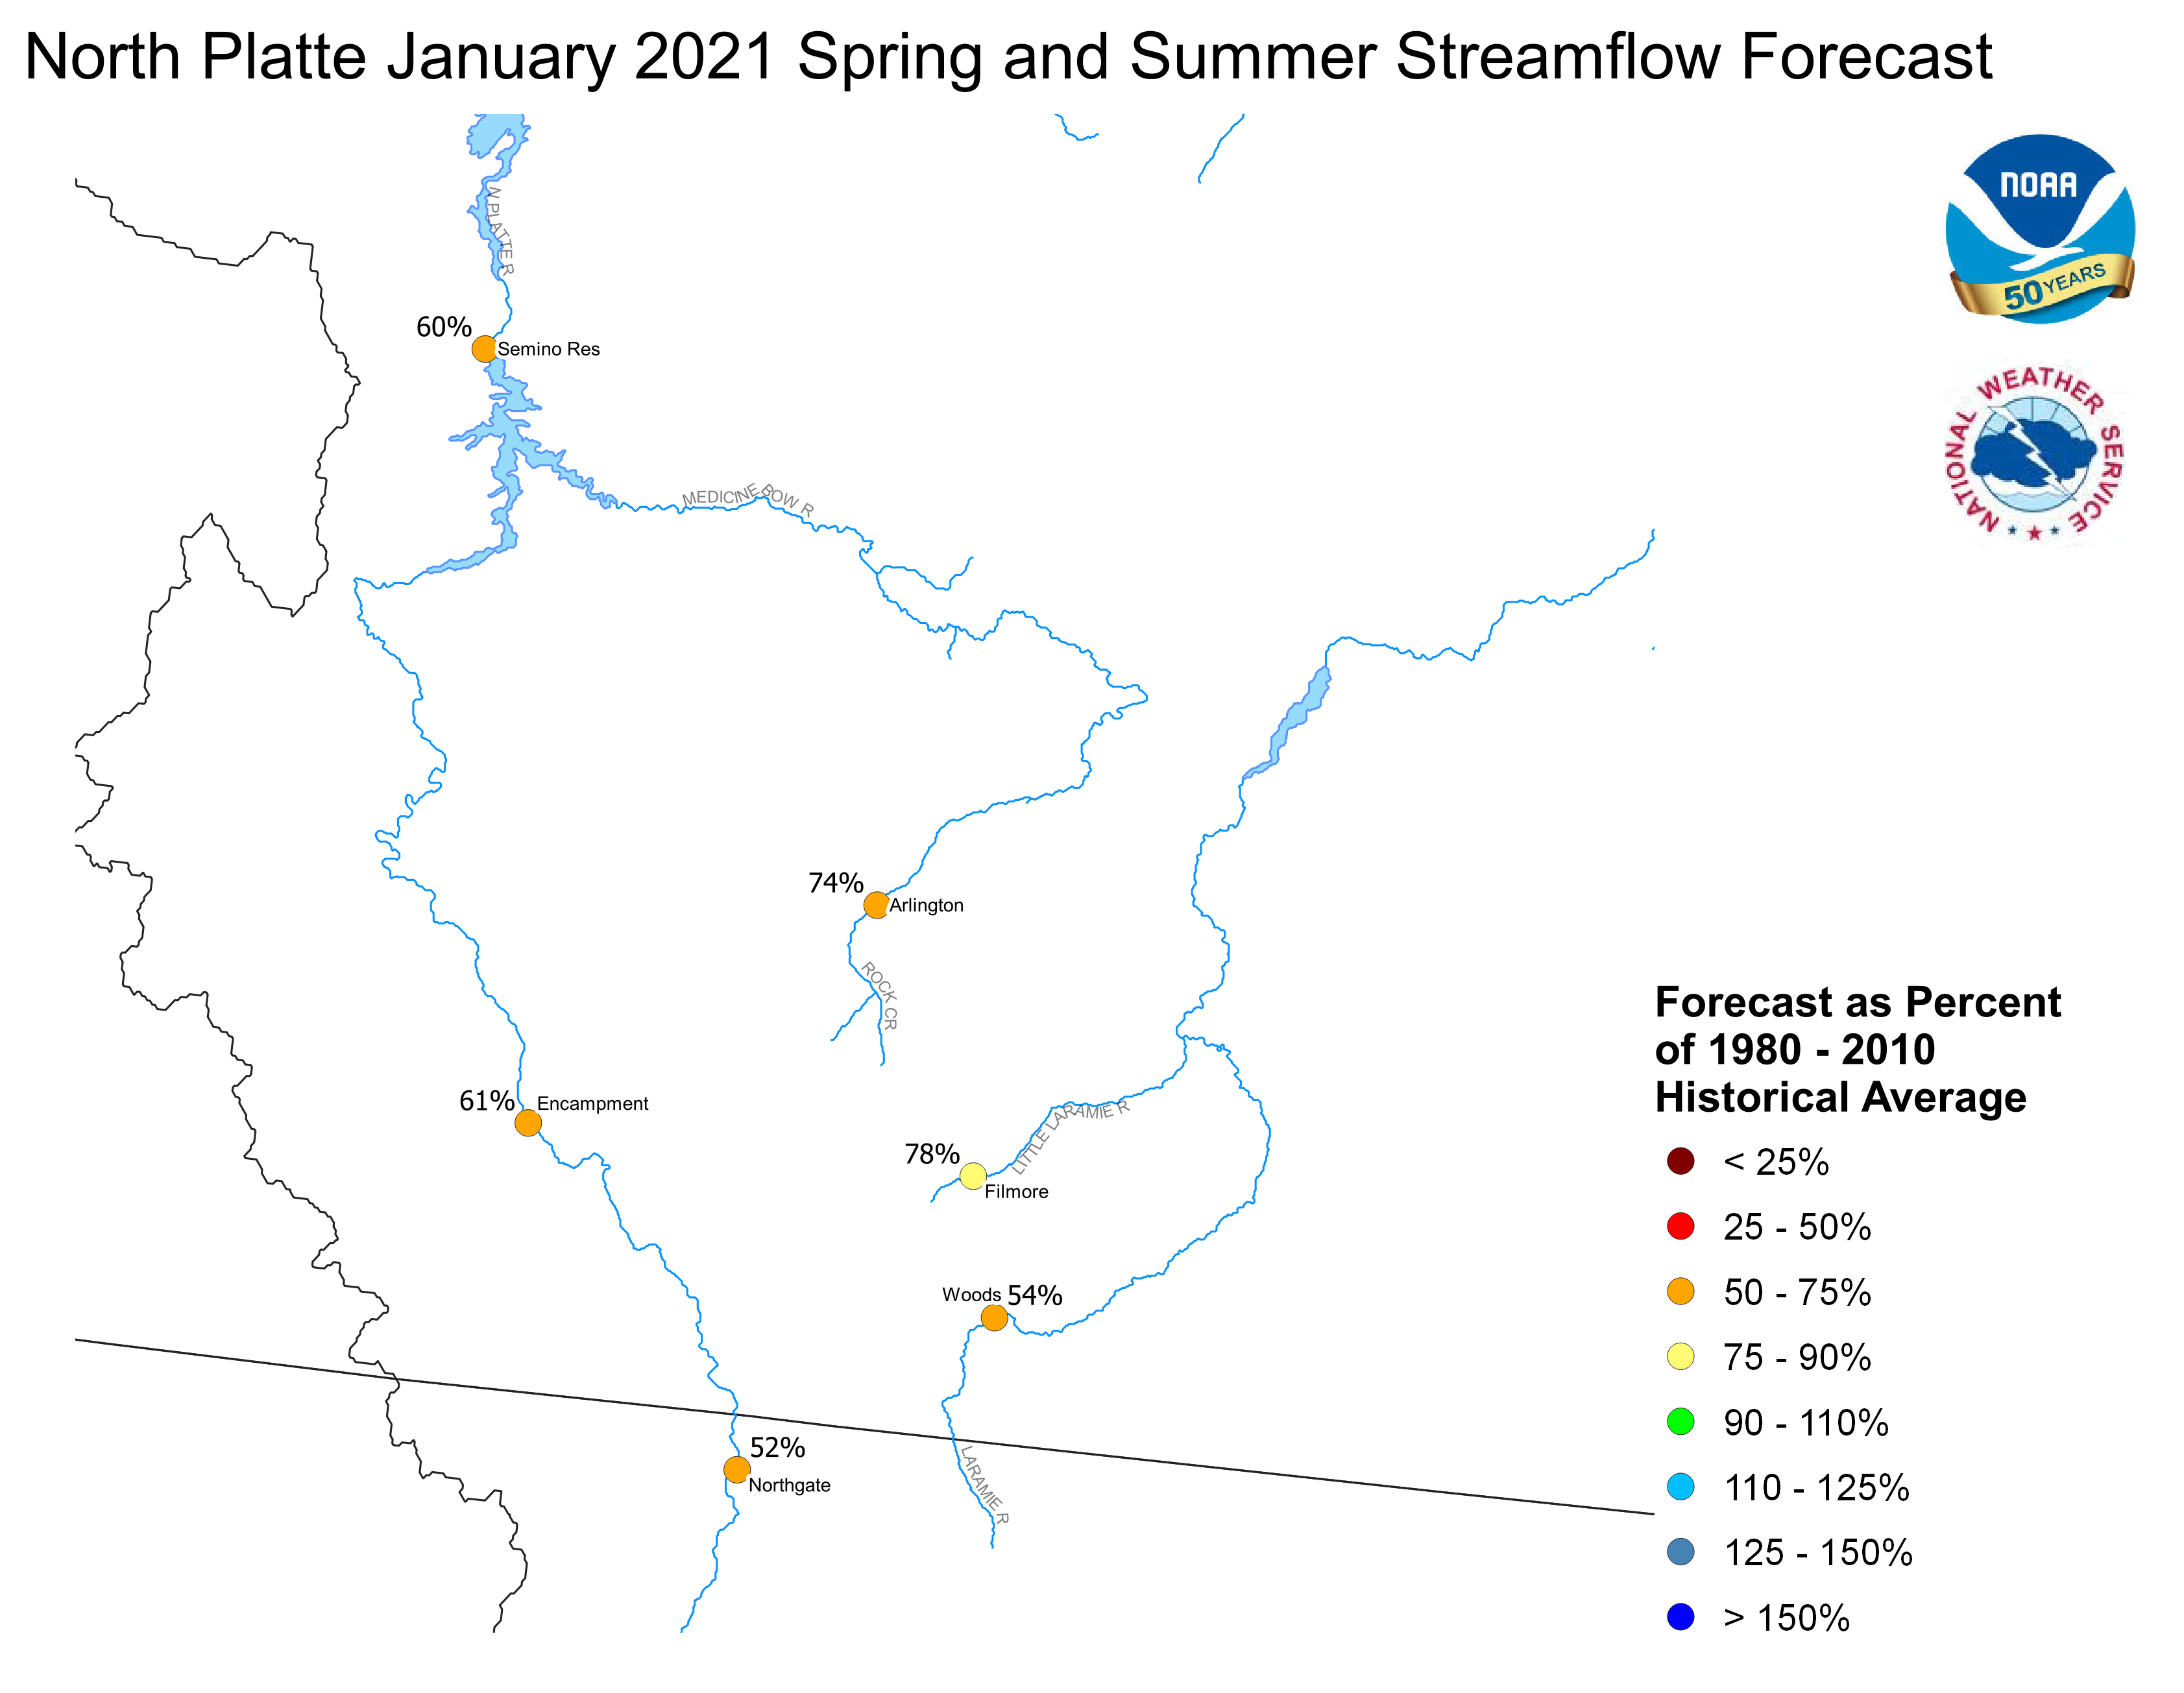
Stream flow in the Platte Basin is forecast to be below
average during the upcoming Spring and Summer. Runoff
for streams above Seminoe Reservoir are expected to be
about 59 percent of average. Streams in the South Platte
Basin above South Platte, Colorado can expect 73 percent
of average flow. For the remainder of the South Platte
basin, flows are expected near 68 percent.
Stored water in the South Platte Basin was 87 percent of average
on January 1.
North Platte Streamflow Fcst South Platte Streamflow Fcst
FGUS63 KKRF 041753
ESPKRF
WATER SUPPLY FORECAST
NWS MISSOURI BASIN RIVER FORECAST CENTER
PLEASANT HILL MISSOURI

0903 AM CST MONDAY JANUARY 04, 2021

DATA CURRENT AS OF: JANUARY 01, 2021

MISSOURI/YELLOWSTONE/PLATTE RIVER BASIN FORECASTS


                                          50%   %   10%   90%   AVG
FORECAST POINT                   PERIOD  (KAF) AVG (KAF) (KAF) (KAF)
--------------------------------------------------------------------

Boysen Resvr Inflow              Apr-Sep  696   61  1198  419   1140
 SBDW4N

Bighorn R at Kane                Apr-Sep  996   59  1796  673   1690
 LVEW4N

Greybull R at Meeteetse          Apr-Sep  121   69   201   55    177
 MEEW4N

Buffalo Bill Resvr Inflow        Apr-Sep  578   76   770  402    765
 CDYW4N

St. Mary R nr Babb               Apr-Sep  366   68   485  313    535
 SMYM8N

St. Mary R at Intl Boundary      Apr-Sep  423   64   574  362    660
 SMBM8N

Milk R nr Western Crossing       Apr-Sep   32   78    70   16     41
 PDBM8N

Milk R nr Eastern Crossing       Apr-Sep   52   64   115   25     81
 ERNM8N

North Platte R nr Northgate      Apr-Sep  156   52   300   57    300
 NGTC2

Encampment R nr Encampment       Apr-Sep   89   59   139   40    150
 ECRW4

Encampment R nr Encampment       Apr-Sep   98   61   148   49    160
 ECRW4N

Rock Cr nr Arlington             Apr-Sep   39   75    55   26     52
 KCRW4

Rock Cr nr Arlington             Apr-Sep   39   74    56   26     53
 KCRW4N

Seminoe Resvr Inflow             Apr-Sep  426   53   764  161    805
 SETW4

Seminoe Resvr Inflow             Apr-Sep  569   60   916  272    955
 SETW4N

Laramie R nr Woods Landing       Apr-Sep   42   39    92   15    108
 WODW4

Laramie R nr Woods Landing       Apr-Sep   77   54   127   39    142
 WODW4N

Little Laramie R nr Filmore      Apr-Sep   42   77    72   29     55
 SMTW4

Little Laramie R nr Filmore      Apr-Sep   45   78    74   31     57
 SMTW4N

Antero Resvr Inflow              Apr-Sep   17  100    25   11     17
 ANRC2N

Spinney Mountain Resvr Inflow    Apr-Sep   40   72    65   25     56
 SPYC2N

Elevenmile Canyon Resvr Inflow   Apr-Sep   44   74    72   26     60
 EVNC2N

Cheesman Lk Inflow               Apr-Sep   76   67   148   49    114
 CHEC2N

S Platte R at S Platte           Apr-Sep  145   71   259   92    205
 SPTC2N

Bear Cr at Morrison              Apr-Sep   12   58    25    6     21
 MRRC2N

Clear Cr at Golden               Apr-Sep   73   62   124   42    117
 GLDC2N

St. Vrain Cr at Lyons            Apr-Sep   73   66   113   46    111
 LNSC2N

Boulder Cr nr Orodell            Apr-Sep   36   70    57   26     52
 OROC2N

S Boulder Cr nr Eldorado Sprgs   Apr-Sep   23   57    41   11     40
 BELC2N

Cache La Poudre at Canyon Mouth  Apr-Sep  148   70   257   71    210
 FTDC2N

Lima Resvr Inflow                Apr-Sep   36   47    66   21     78
 LRRM8N

Clark Canyon Resvr Inflow        Apr-Sep   79   50   120   44    159
 CLKM8N

Beaverhead R at Barretts         Apr-Sep  106   54   148   68    194
 BARM8N

Ruby R Resvr Inflow              Apr-Sep   77   80    95   56     97
 ALRM8N

Big Hole R nr Melrose            Apr-Sep  423   76   588  257    560
 MLRM8

Big Hole R nr Melrose            Apr-Sep  481   84   644  315    570
 MLRM8N

Hebgen Resvr Inflow              Apr-Sep  398   93   510  289    430
 HBDM8N

Ennis Resvr Inflow               Apr-Sep  690   93   821  498    745
 ELMM8N

Gallatin R nr Gateway            Apr-Sep  229   50   308  153    455
 GLGM8

Gallatin R nr Gateway            Apr-Sep  229   50   308  153    455
 GLGM8N

Gallatin R at Logan              Apr-Sep  222   44   354  132    505
 LOGM8

Gallatin R at Logan              Apr-Sep  350   59   475  241    595
 LOGM8N

Missouri R at Toston             Apr-Sep 2007   80  2604 1378   2510
 TOSM8N

Missouri R at Fort Benton        Apr-Sep 3110   84  4010 2277   3690
 FBNM8N

Missouri R nr Virgelle           Apr-Sep 3603   84  4798 2742   4280
 VRGM8N

Missouri R nr Landusky           Apr-Sep 3912   87  5142 2915   4490
 LDKM8N

Missouri R below Fort Peck Dam   Apr-Sep 4082   86  5347 3015   4730
 FPKM8N

Gibson Resvr Inflow              Apr-Sep  398  100   625  309    400
 AGSM8N

Marias R nr Shelby               Apr-Sep  387   86   693  285    450
 SHLM8N

Musselshell R at Harlowton       Apr-Sep   60   57   102   33    104
 HLWM8N

Yellowstone R at Yellowstone Lk  Apr-Sep  584   73   715  395    795
 YLOW4

Yellowstone R at Yellowstone Lk  Apr-Sep  793   94   989  557    840
 YLOW4N

Yellowstone R at Corwin Sprgs    Apr-Sep 1500   80  1827 1072   1880
 CORM8

Yellowstone R at Corwin Sprgs    Apr-Sep 1795   91  2204 1310   1980
 CORM8N

Yellowstone R at Livingston      Apr-Sep 1775   83  2145 1309   2130
 LIVM8

Yellowstone R at Livingston      Apr-Sep 2140   93  2581 1588   2310
 LIVM8N

Yellowstone R at Billings        Apr-Sep 2689   72  3302 1914   3730
 BILM8

Yellowstone R at Billings        Apr-Sep 3706   87  4364 2801   4260
 BILM8N

Yellowstone R at Miles City      Apr-Sep 5626   78  7042 4169   7250
 MILM8N

Yellowstone R at Sidney          Apr-Sep 5806   77  7288 4295   7540
 SIDM8N

Boulder R at Big Timber          Apr-Sep  200   67   253  144    300
 BTMM8

Boulder R at Big Timber          Apr-Sep  241   74   295  184    325
 BTMM8N

Stillwater R nr Absarokee        Apr-Sep  345   68   429  255    505
 SRAM8

Stillwater R nr Absarokee        Apr-Sep  402   73   486  311    550
 SRAM8N

Clks Fk Yellowstone R nr Belfry  Apr-Sep  409   74   535  288    550
 BFYM8

Clks Fk Yellowstone R nr Belfry  Apr-Sep  481   80   606  360    600
 BFYM8N

Bighorn R nr St. Xavier          Apr-Sep 1705   67  2539 1066   2550
 STXM8N

Little Bighorn R nr Hardin       Apr-Sep   69   67   101   42    103
 HRDM8N

Tongue R nr Dayton               Apr-Sep   62   75    78   45     83
 DAYW4N

Tongue R nr Decker               Apr-Sep  139   65   201   92    215
 DSLM8N

Tongue R Resvr Inflow            Apr-Sep  141   66   208   92    215
 DKRM8N

Powder R at Moorhead             Apr-Sep  116   53   236   57    220
 MHDM8N

Powder R nr Locate               Apr-Sep  124   50   299   65    245
 LOCM8N


Locations with an `N` suffix indicate natural flows excluding
stream augmentations.

KAF: Thousands of Acre-feet

%AVG: Current 50%/AVG

AVG: Average(50%) seasonal runoff voulme as simulated by the river
forecast model considering acontinuous simulation of the basin
response to historic climate data (observed precipitation and
temperatures) over the period of 1981-2010.

The 50%, 10% and 90% columns indicate the probability that the
actual volume will exceed the forecast for the valid time perion
for more information, please visit: www.weather.gov/mbrfc/water


$$

