January 1, 2022 Spring and Summer Streamflow Forecasts
Upper Missouri Basin
The high elevation snow pack in the Upper Missouri Basin as of January 1
was near to above average. The snow pack in the St. Mary Basin was 117 percent,
and the Milk River Basin was 91 percent.
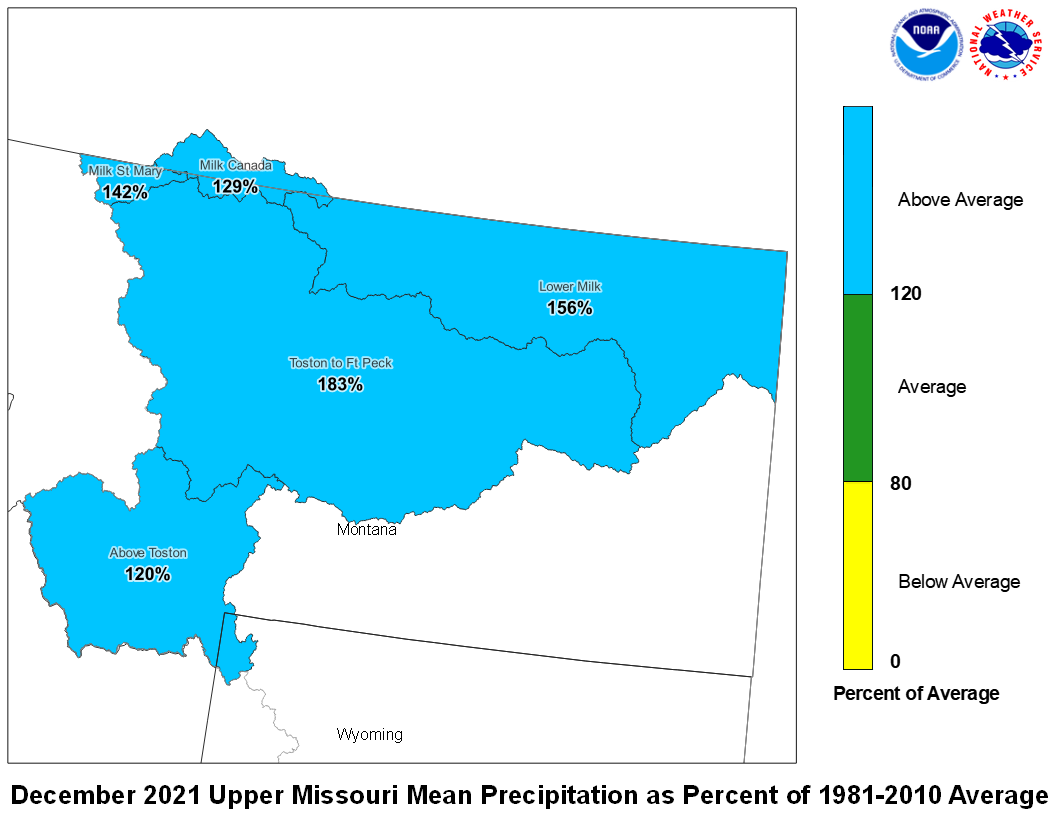
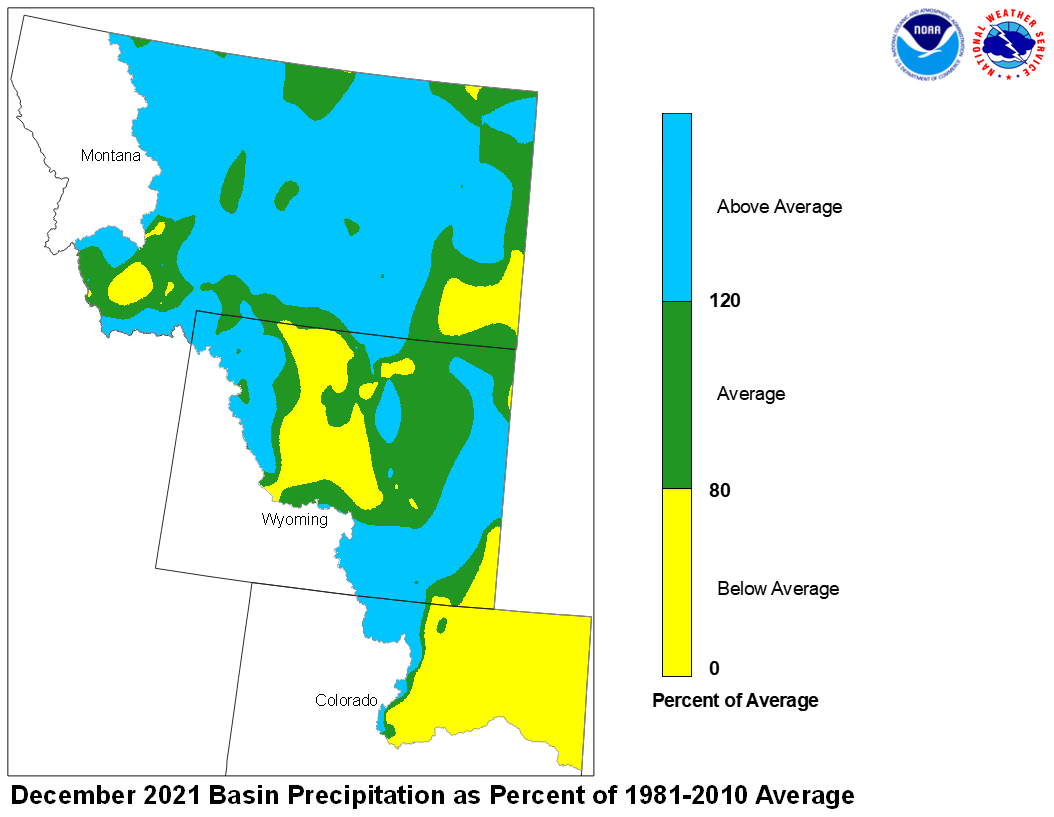
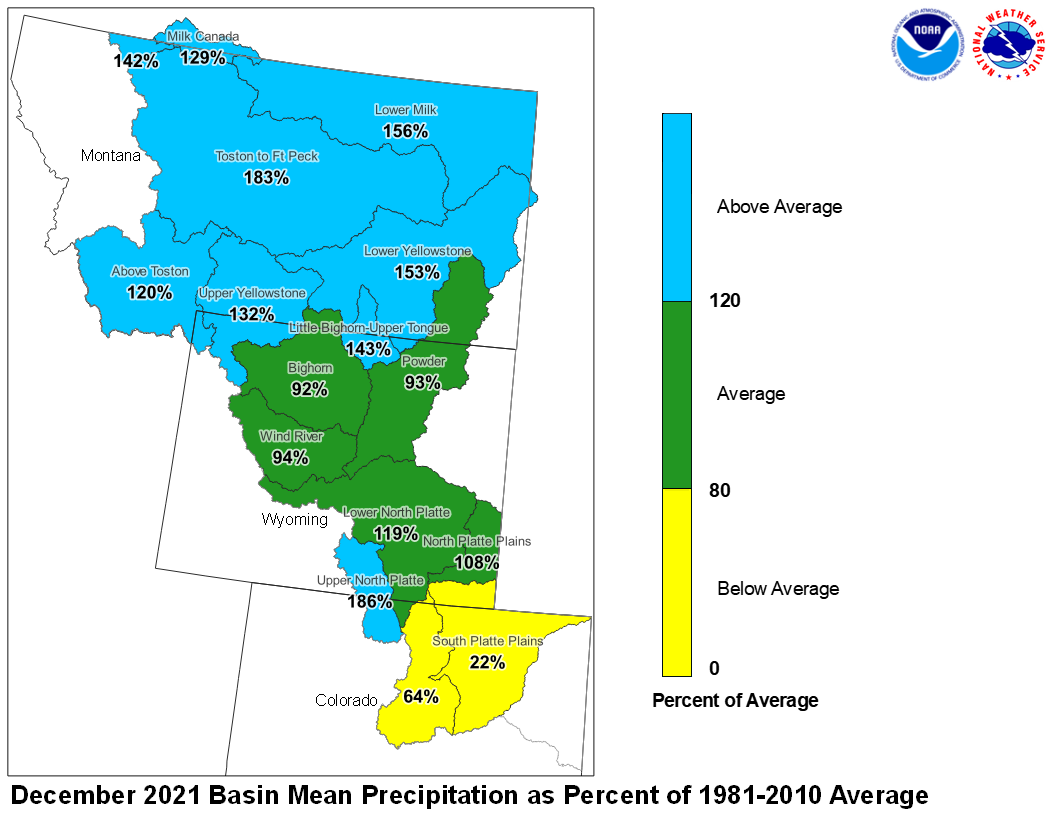
December precipitation across the Upper Missouri Basin was above average.
Basin precipitation summaries for the Missouri Basin include: Milk St. Mary,
142 percent; Milk Canada, 129 percent; Lower Milk, 156 percent; above Toston,
120 percent; Toston to Ft. Peck, 183 percent.
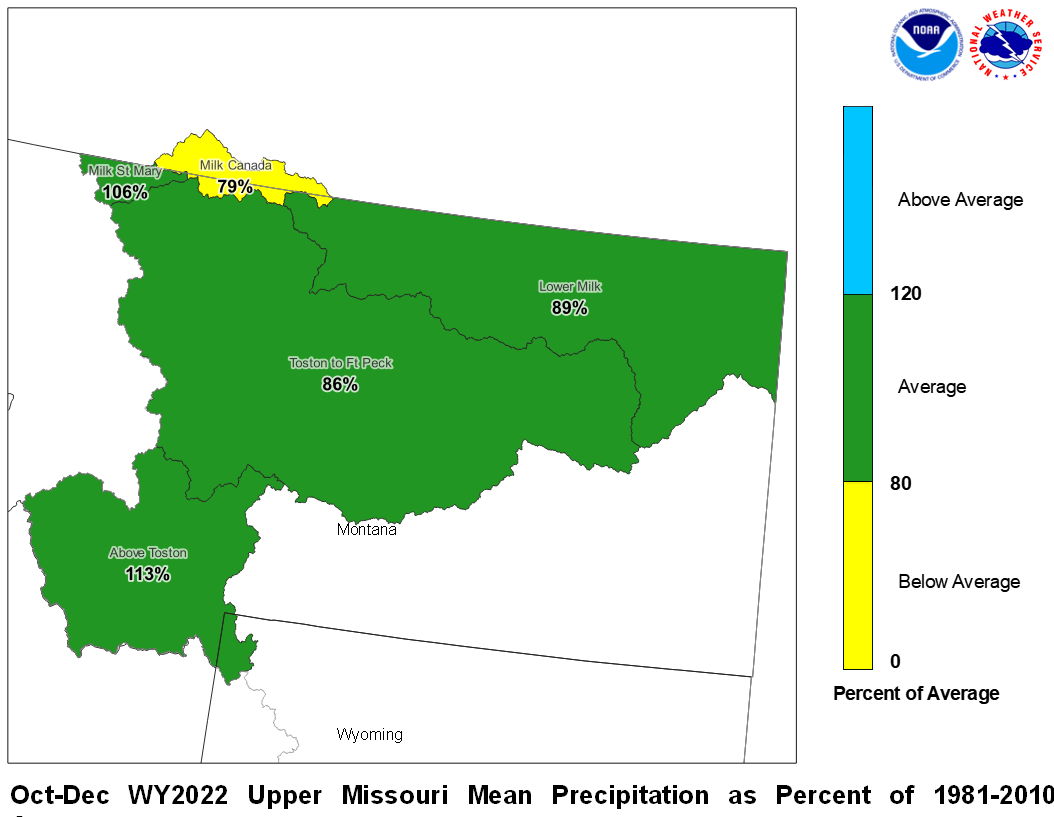
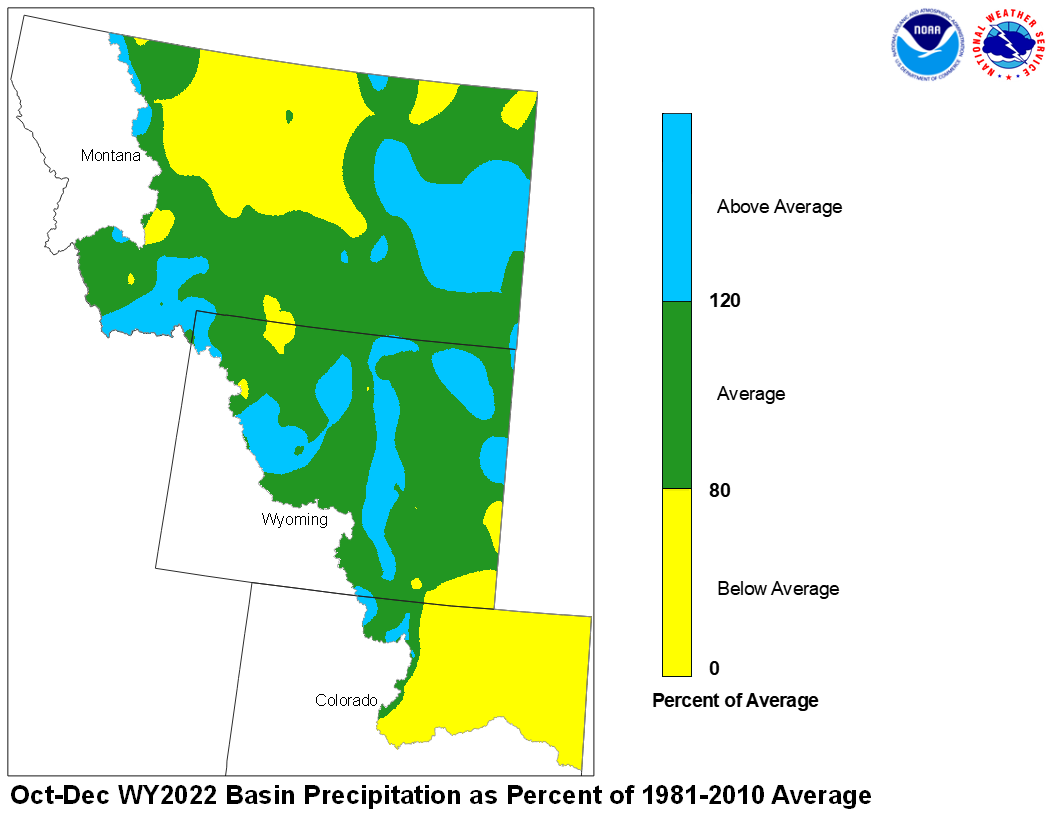
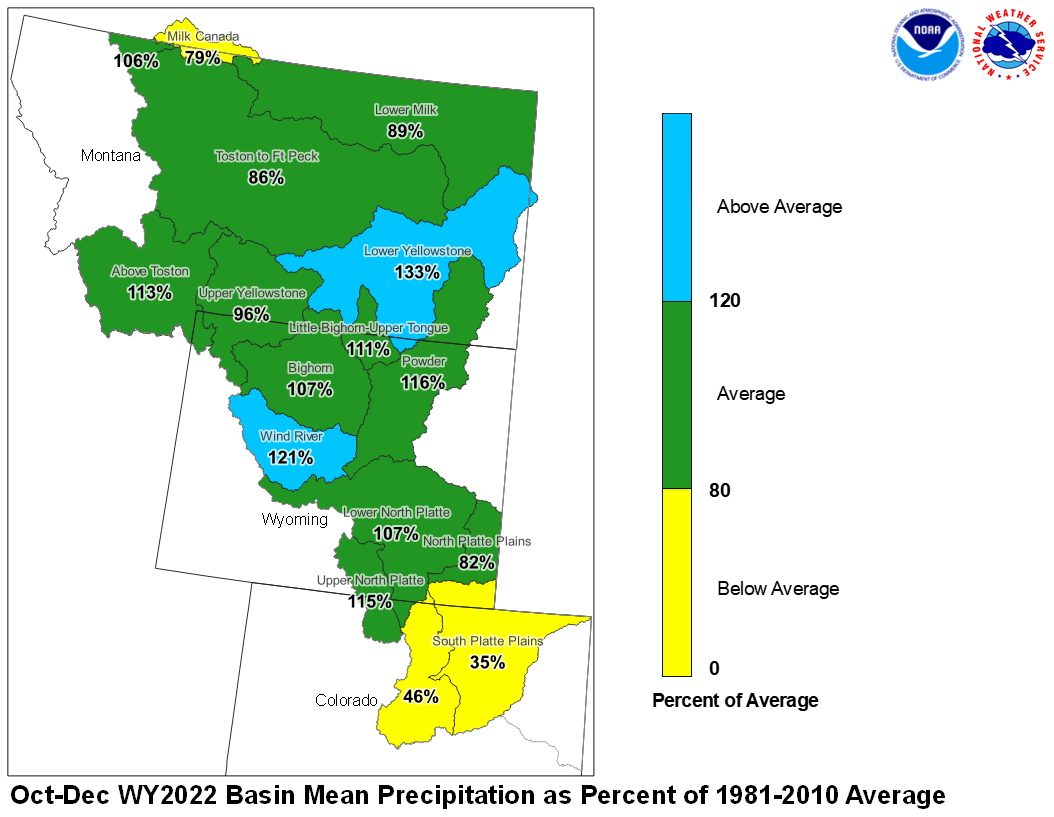
December 2021 Upper Missouri Mean Precip Oct-Dec WY2022 Upper Missouri Mean Precip
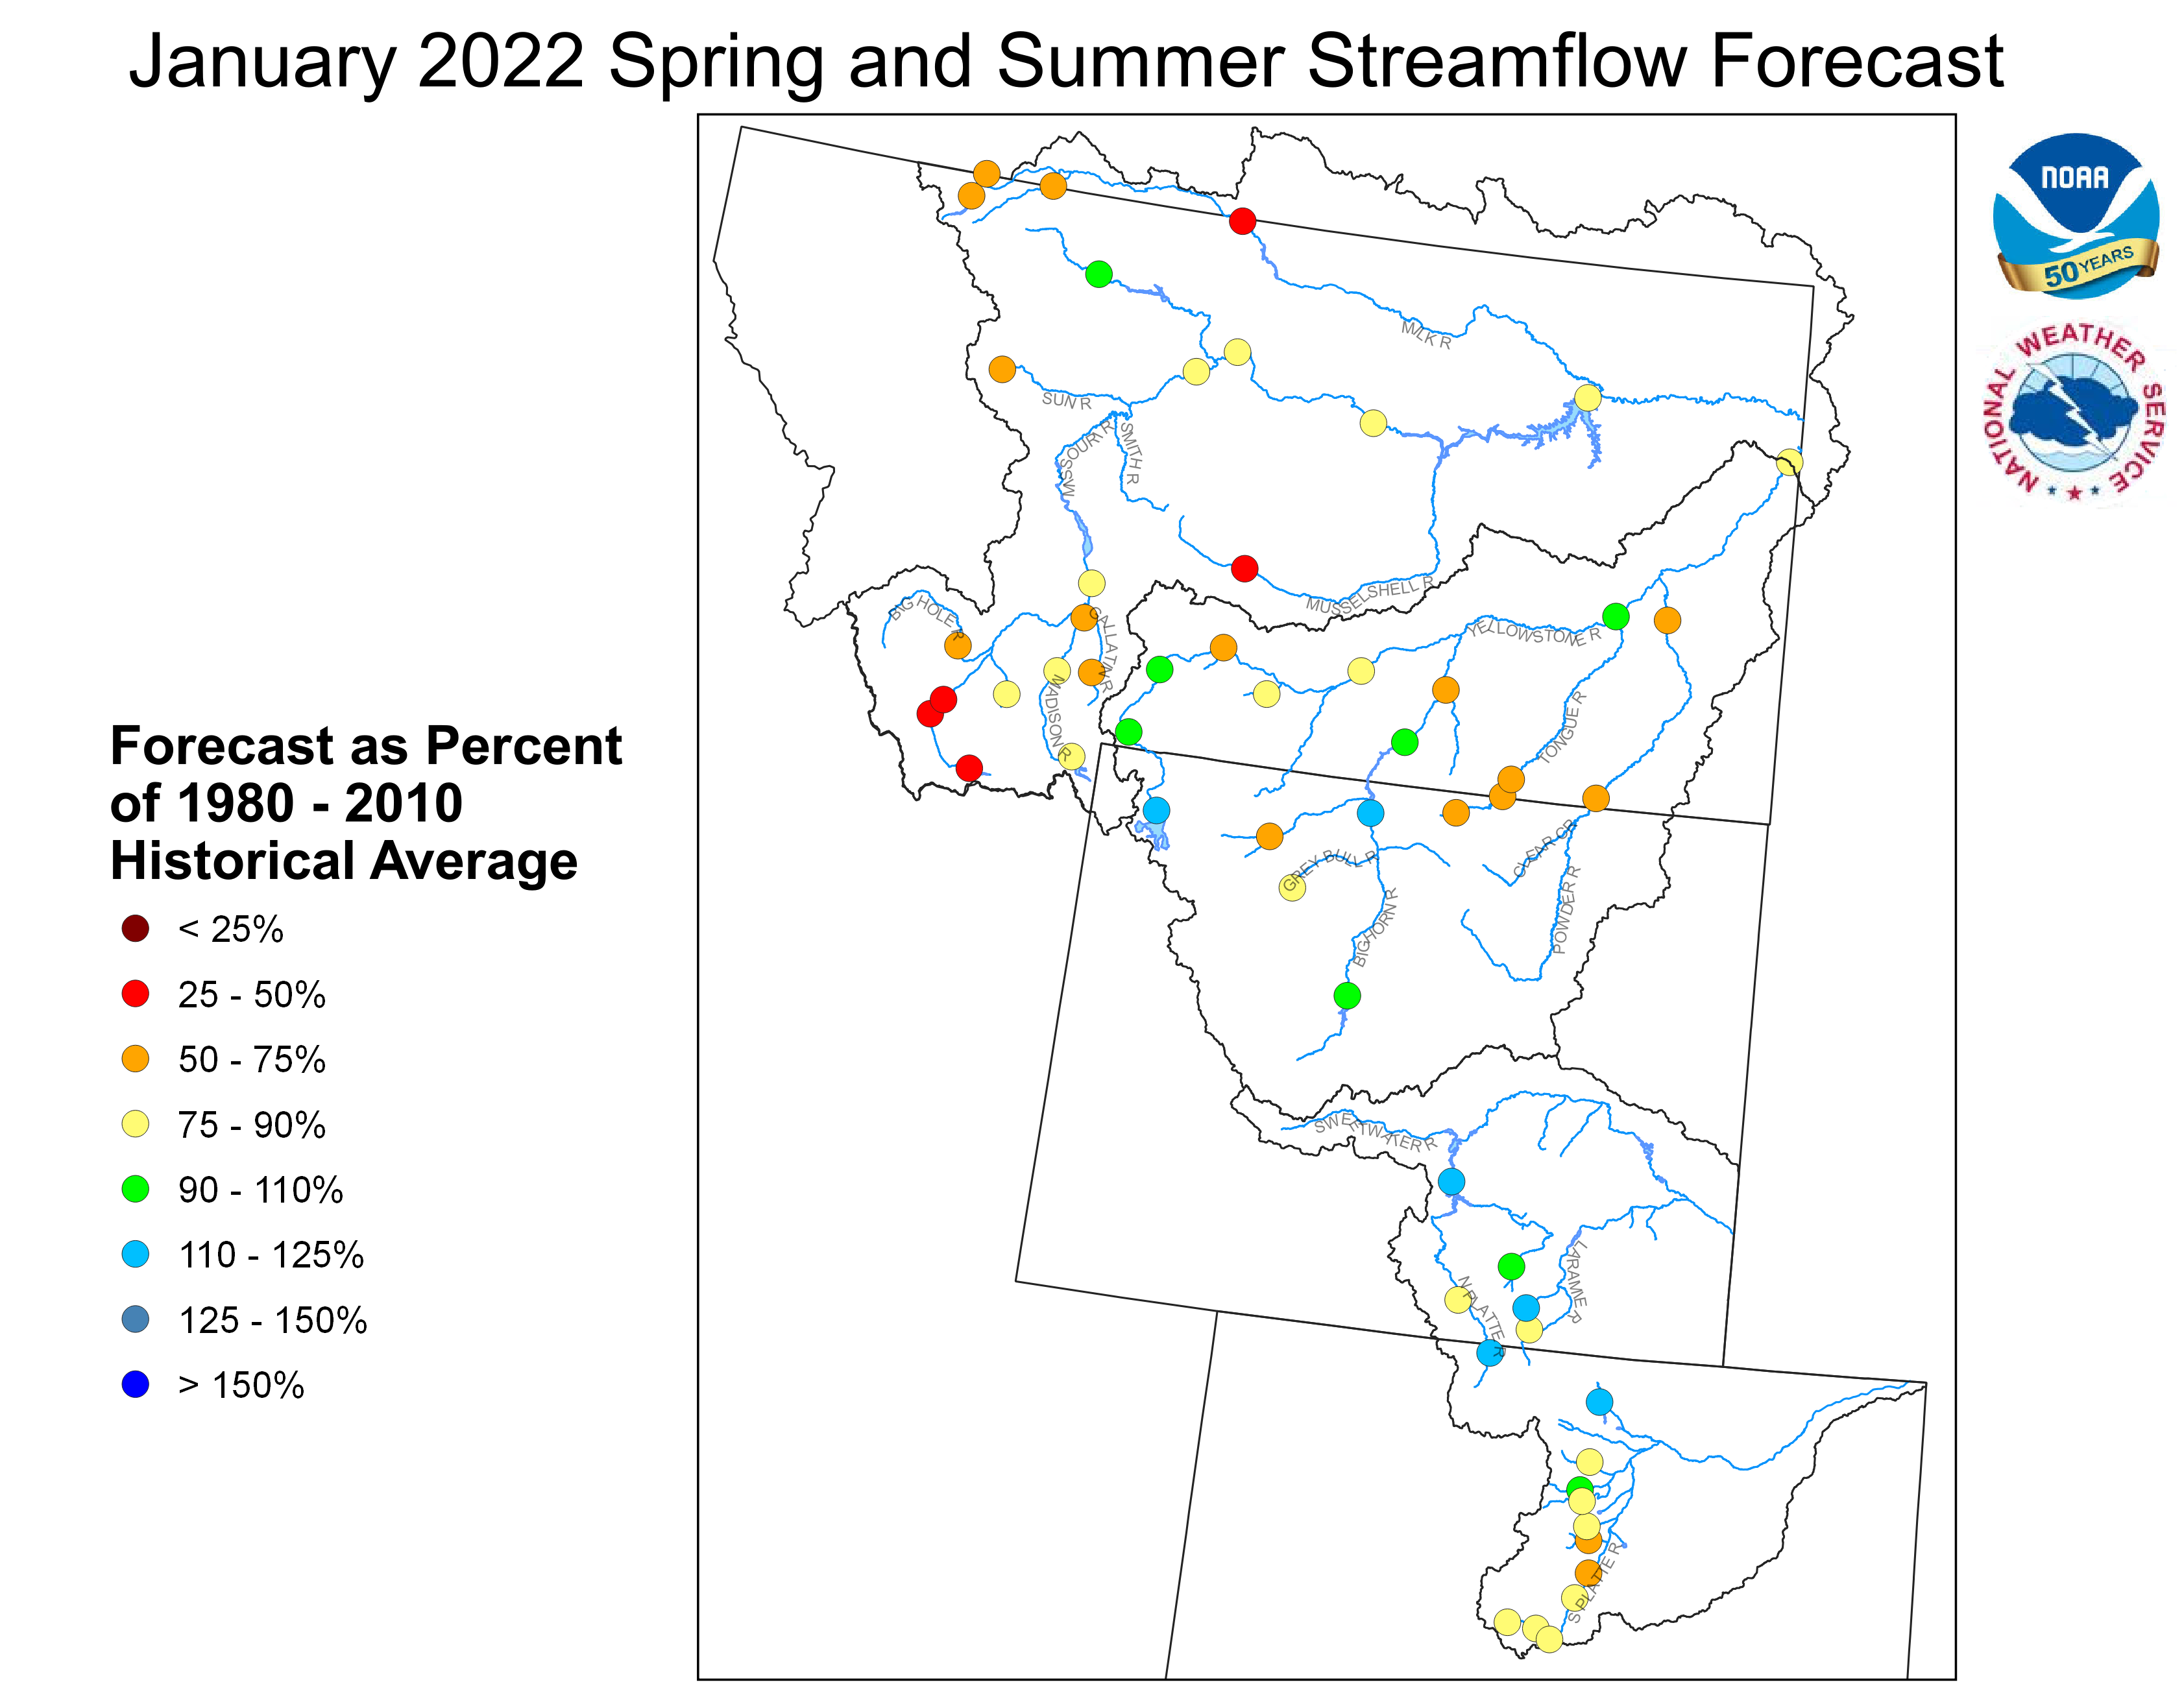
Stream flow in the Upper Missouri Basin is forecast to be
below average during the upcoming Spring and Summer.
The St. Mary River is forecast to have 70 percent of average
April-September flows. Runoff is expected to range around
85 percent of average for the Missouri Basin above Fort Peck,
Montana.
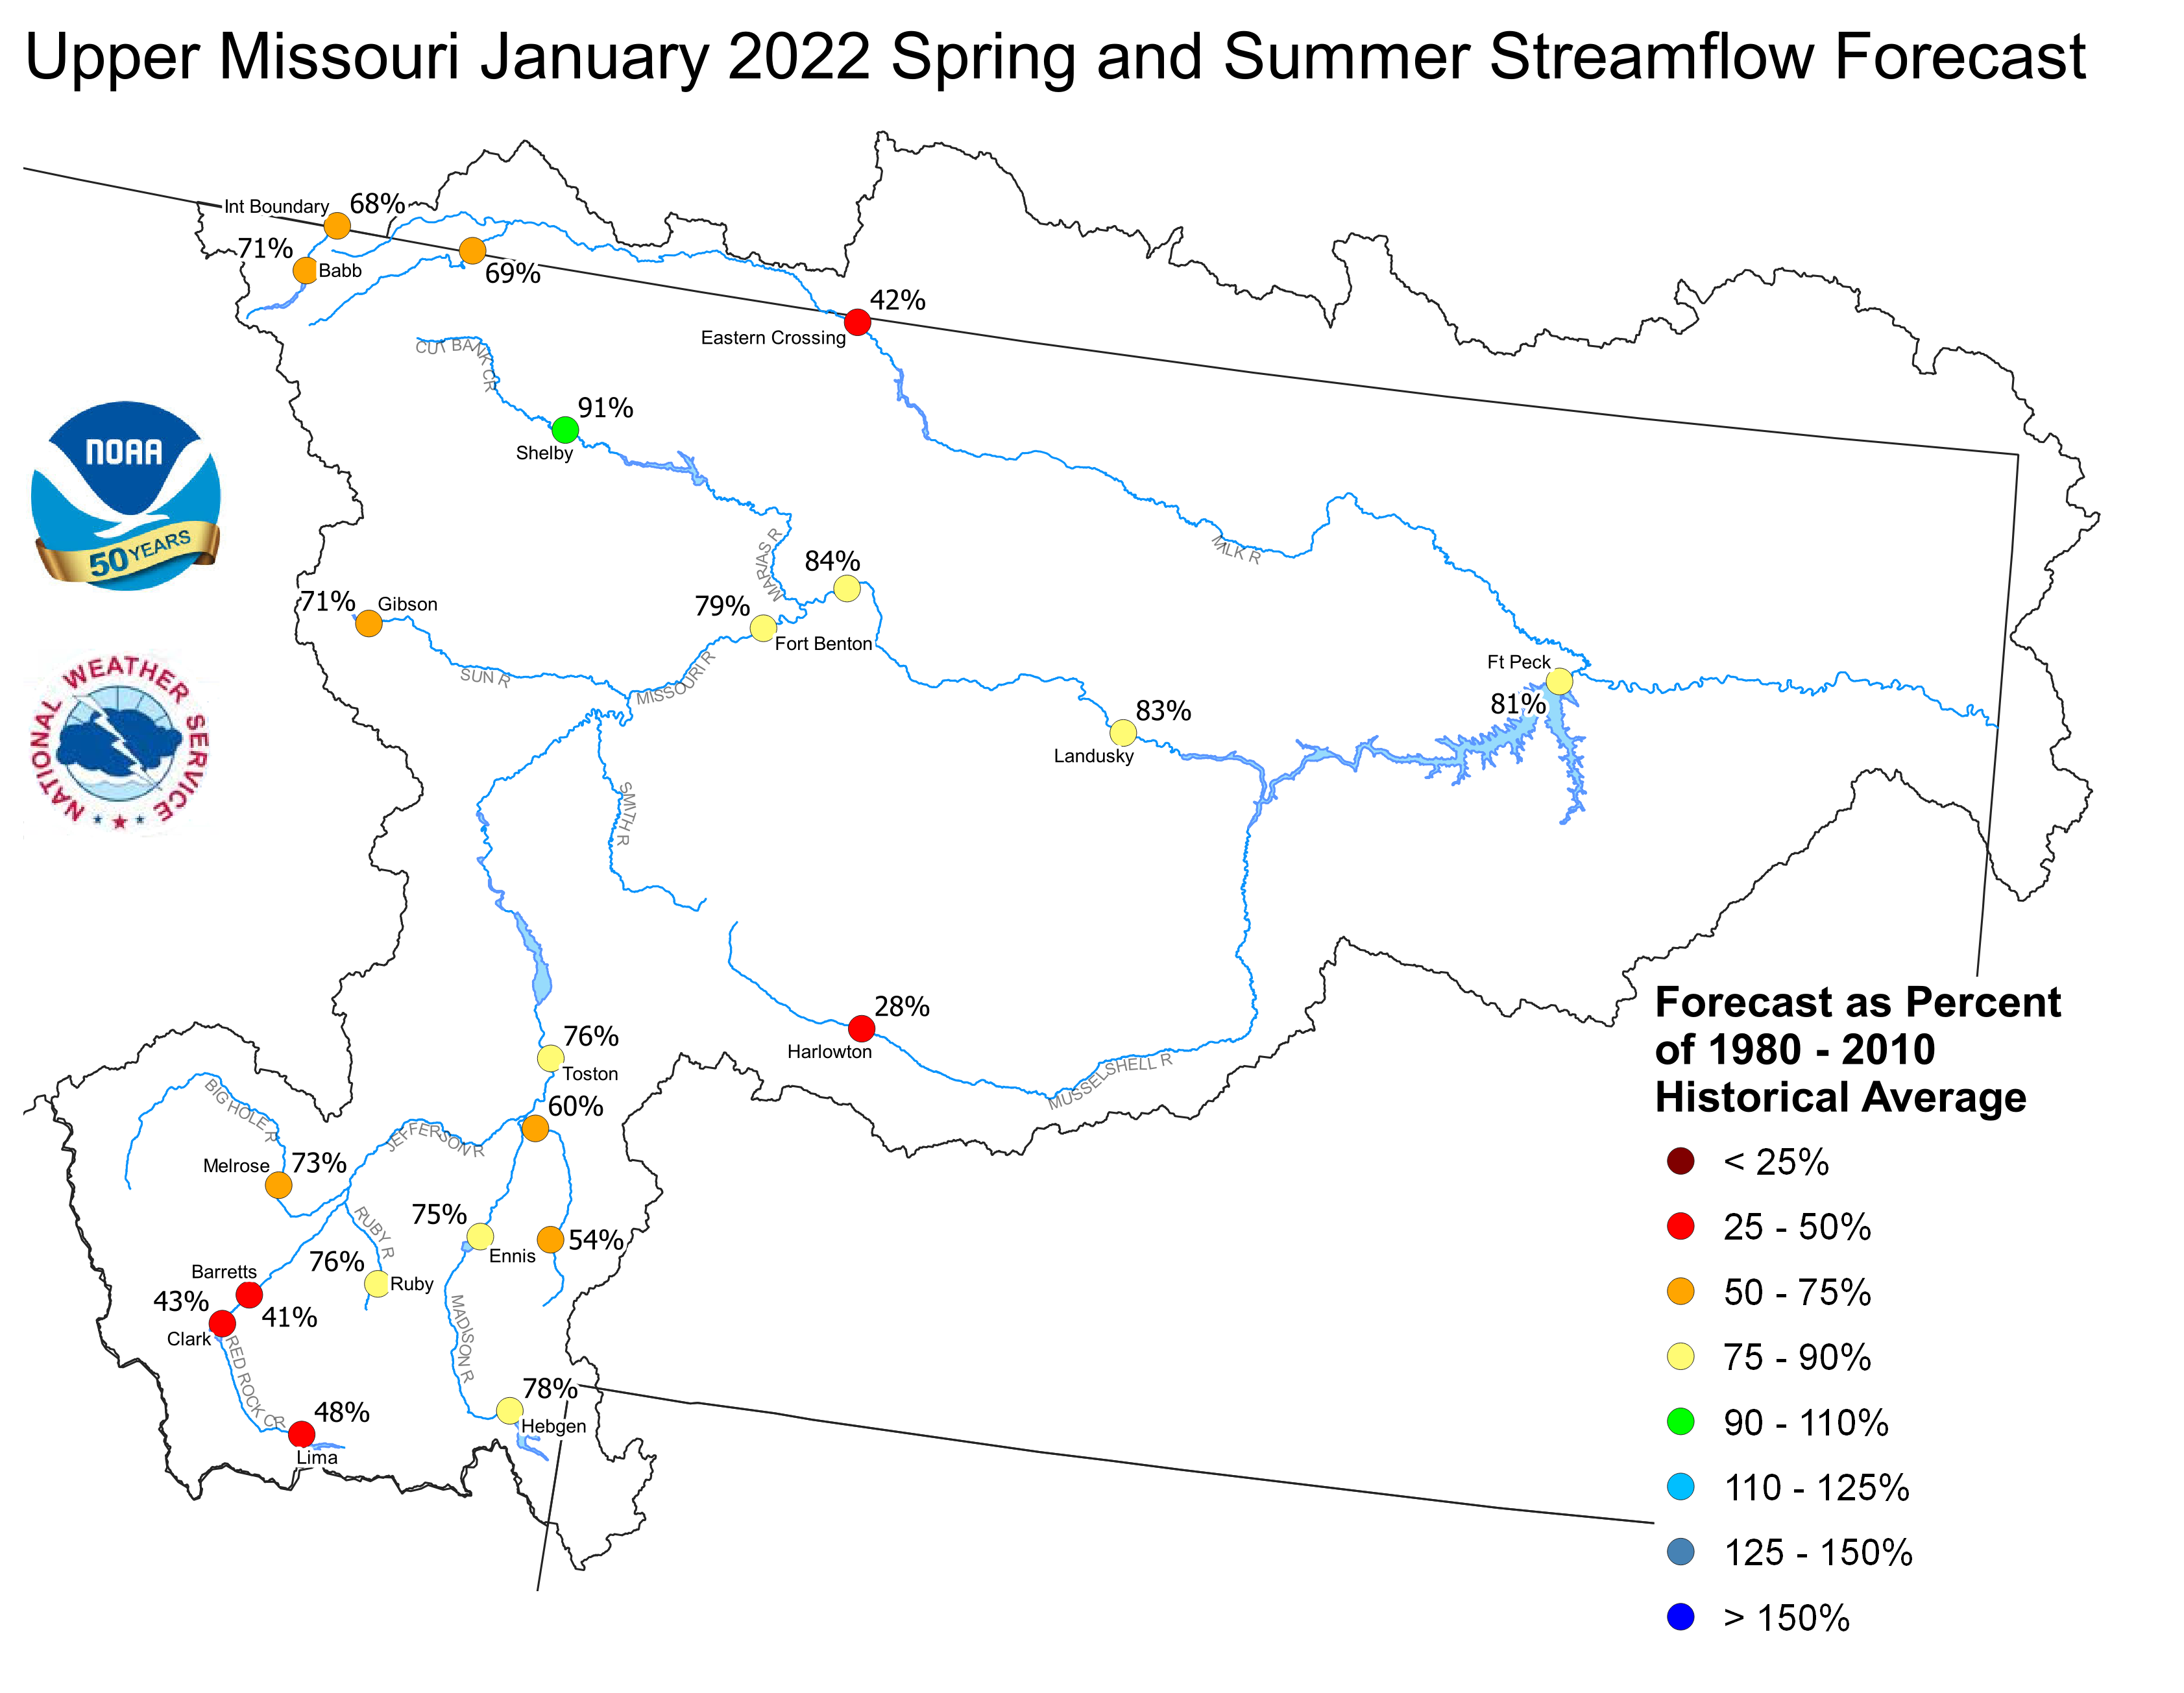
Upper Missouri January 1, 2022 Spring and Summer Streamflow Forecasts
Of the four major irrigation reservoirs in Montana; Lima
Reservoir had 72 percent average storage, Clark Canyon was
holding 74 percent of average water, Gibson Reservoir had 60
percent of average stored water, and Fresno Reservoir had
68 percent of average stored water.
Yellowstone Basin
The high elevation snow pack in the Yellowstone Basin was near average
on January 1. The snow pack in the Upper Yellowstone Basin was 89 percent
of average. The snow packs in the Wind, Bighorn, and Shoshone Basins were 107,
83, and 90 percent of average, respectively. The snow packs in the Tongue
and Powder basins were 81 and 80 percent of average, respectively.
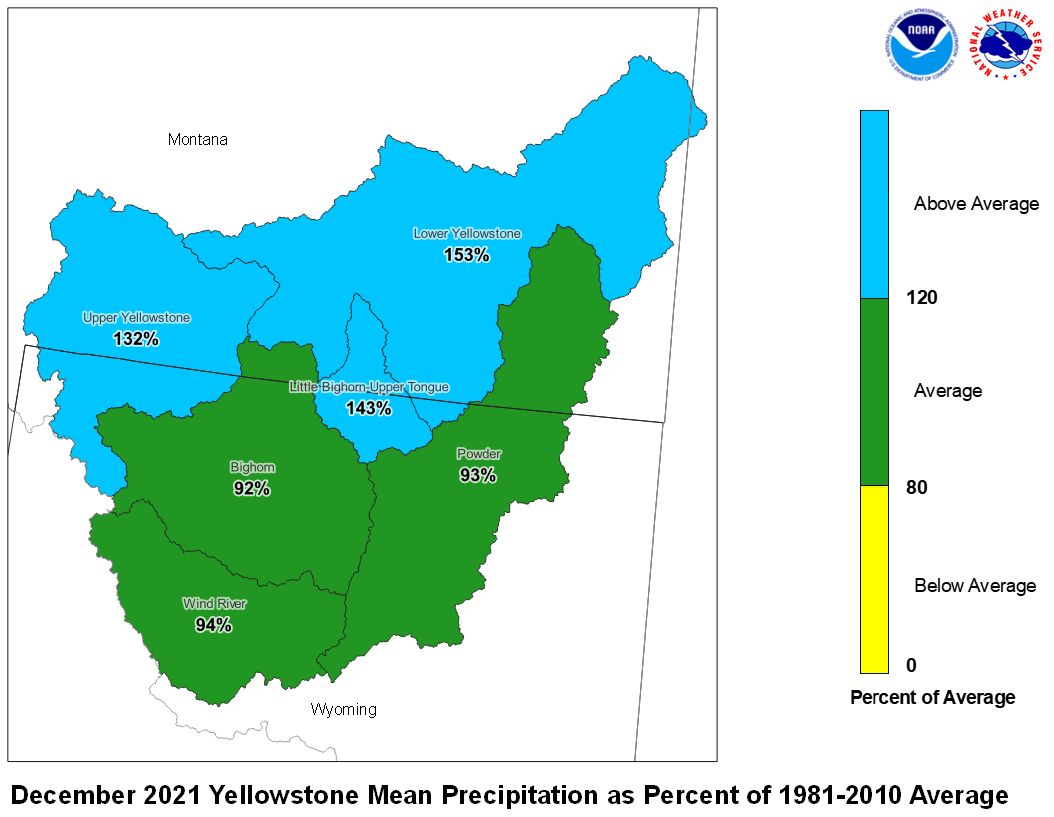
Precipitation during December was near to above average. The upper Yellowstone
River Basin received 132 percent of average precipitation while the
Lower Yellowstone River Basin reported 153 percent of average. The
Bighorn Basin received 92 percent of average precipitation while the
Wind River Basin received 94 percent of average. The Little Bighorn -
Upper Tongue Basin received 143 percent of average and the Powder River
had 93 percent of average precipitation.
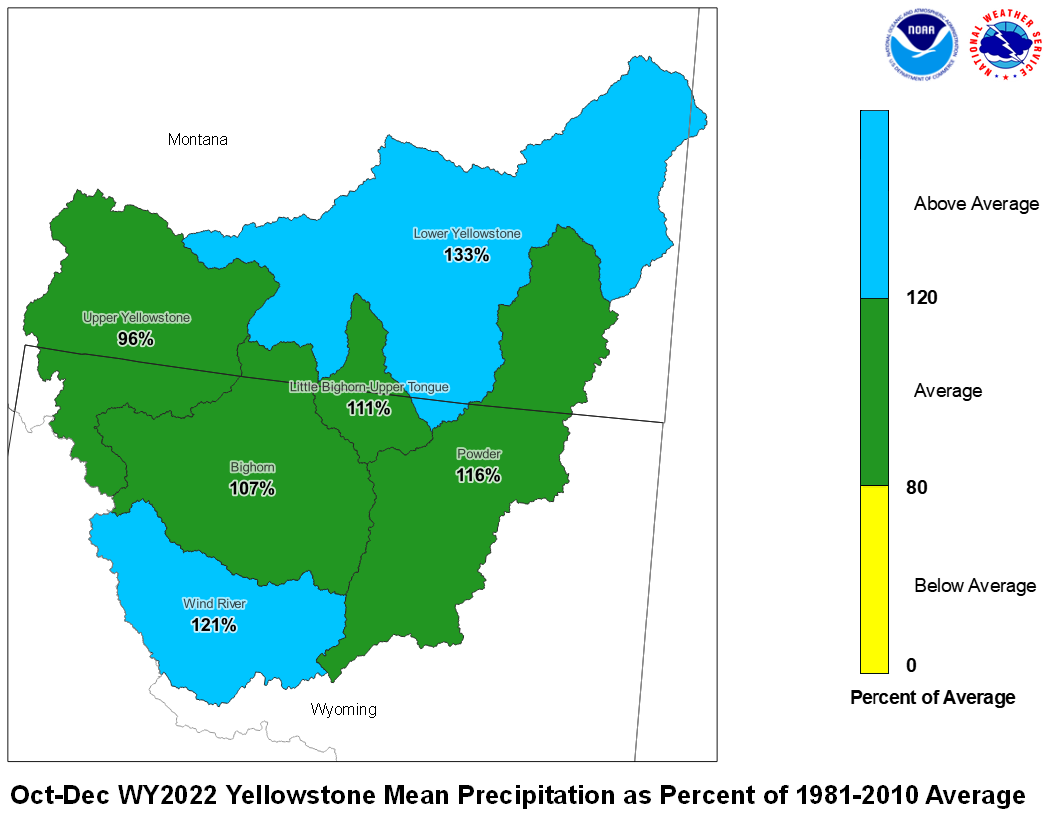
December 2021 Yellowstone Mean Precip Oct-Dec WY2022 Yellowstone Mean Precip
Forecast stream flow in the Yellowstone Basin is below average
for the upcoming Spring and Summer. Stream flow for the
Yellowstone River above Sidney, Montana is forecast to be about
93 percent of average. Flow in the Tongue Basin is expected to be
65 percent of average. Flows in the Powder River are expected
to be about 60 percent of average.
Monthend storage at Boysen Reservoir was 104 percent of average.
Stored water in Buffalo Bill Reservoir was 86 percent of average.
Monthend storage was 96 percent of average at Bighorn Reservoir.
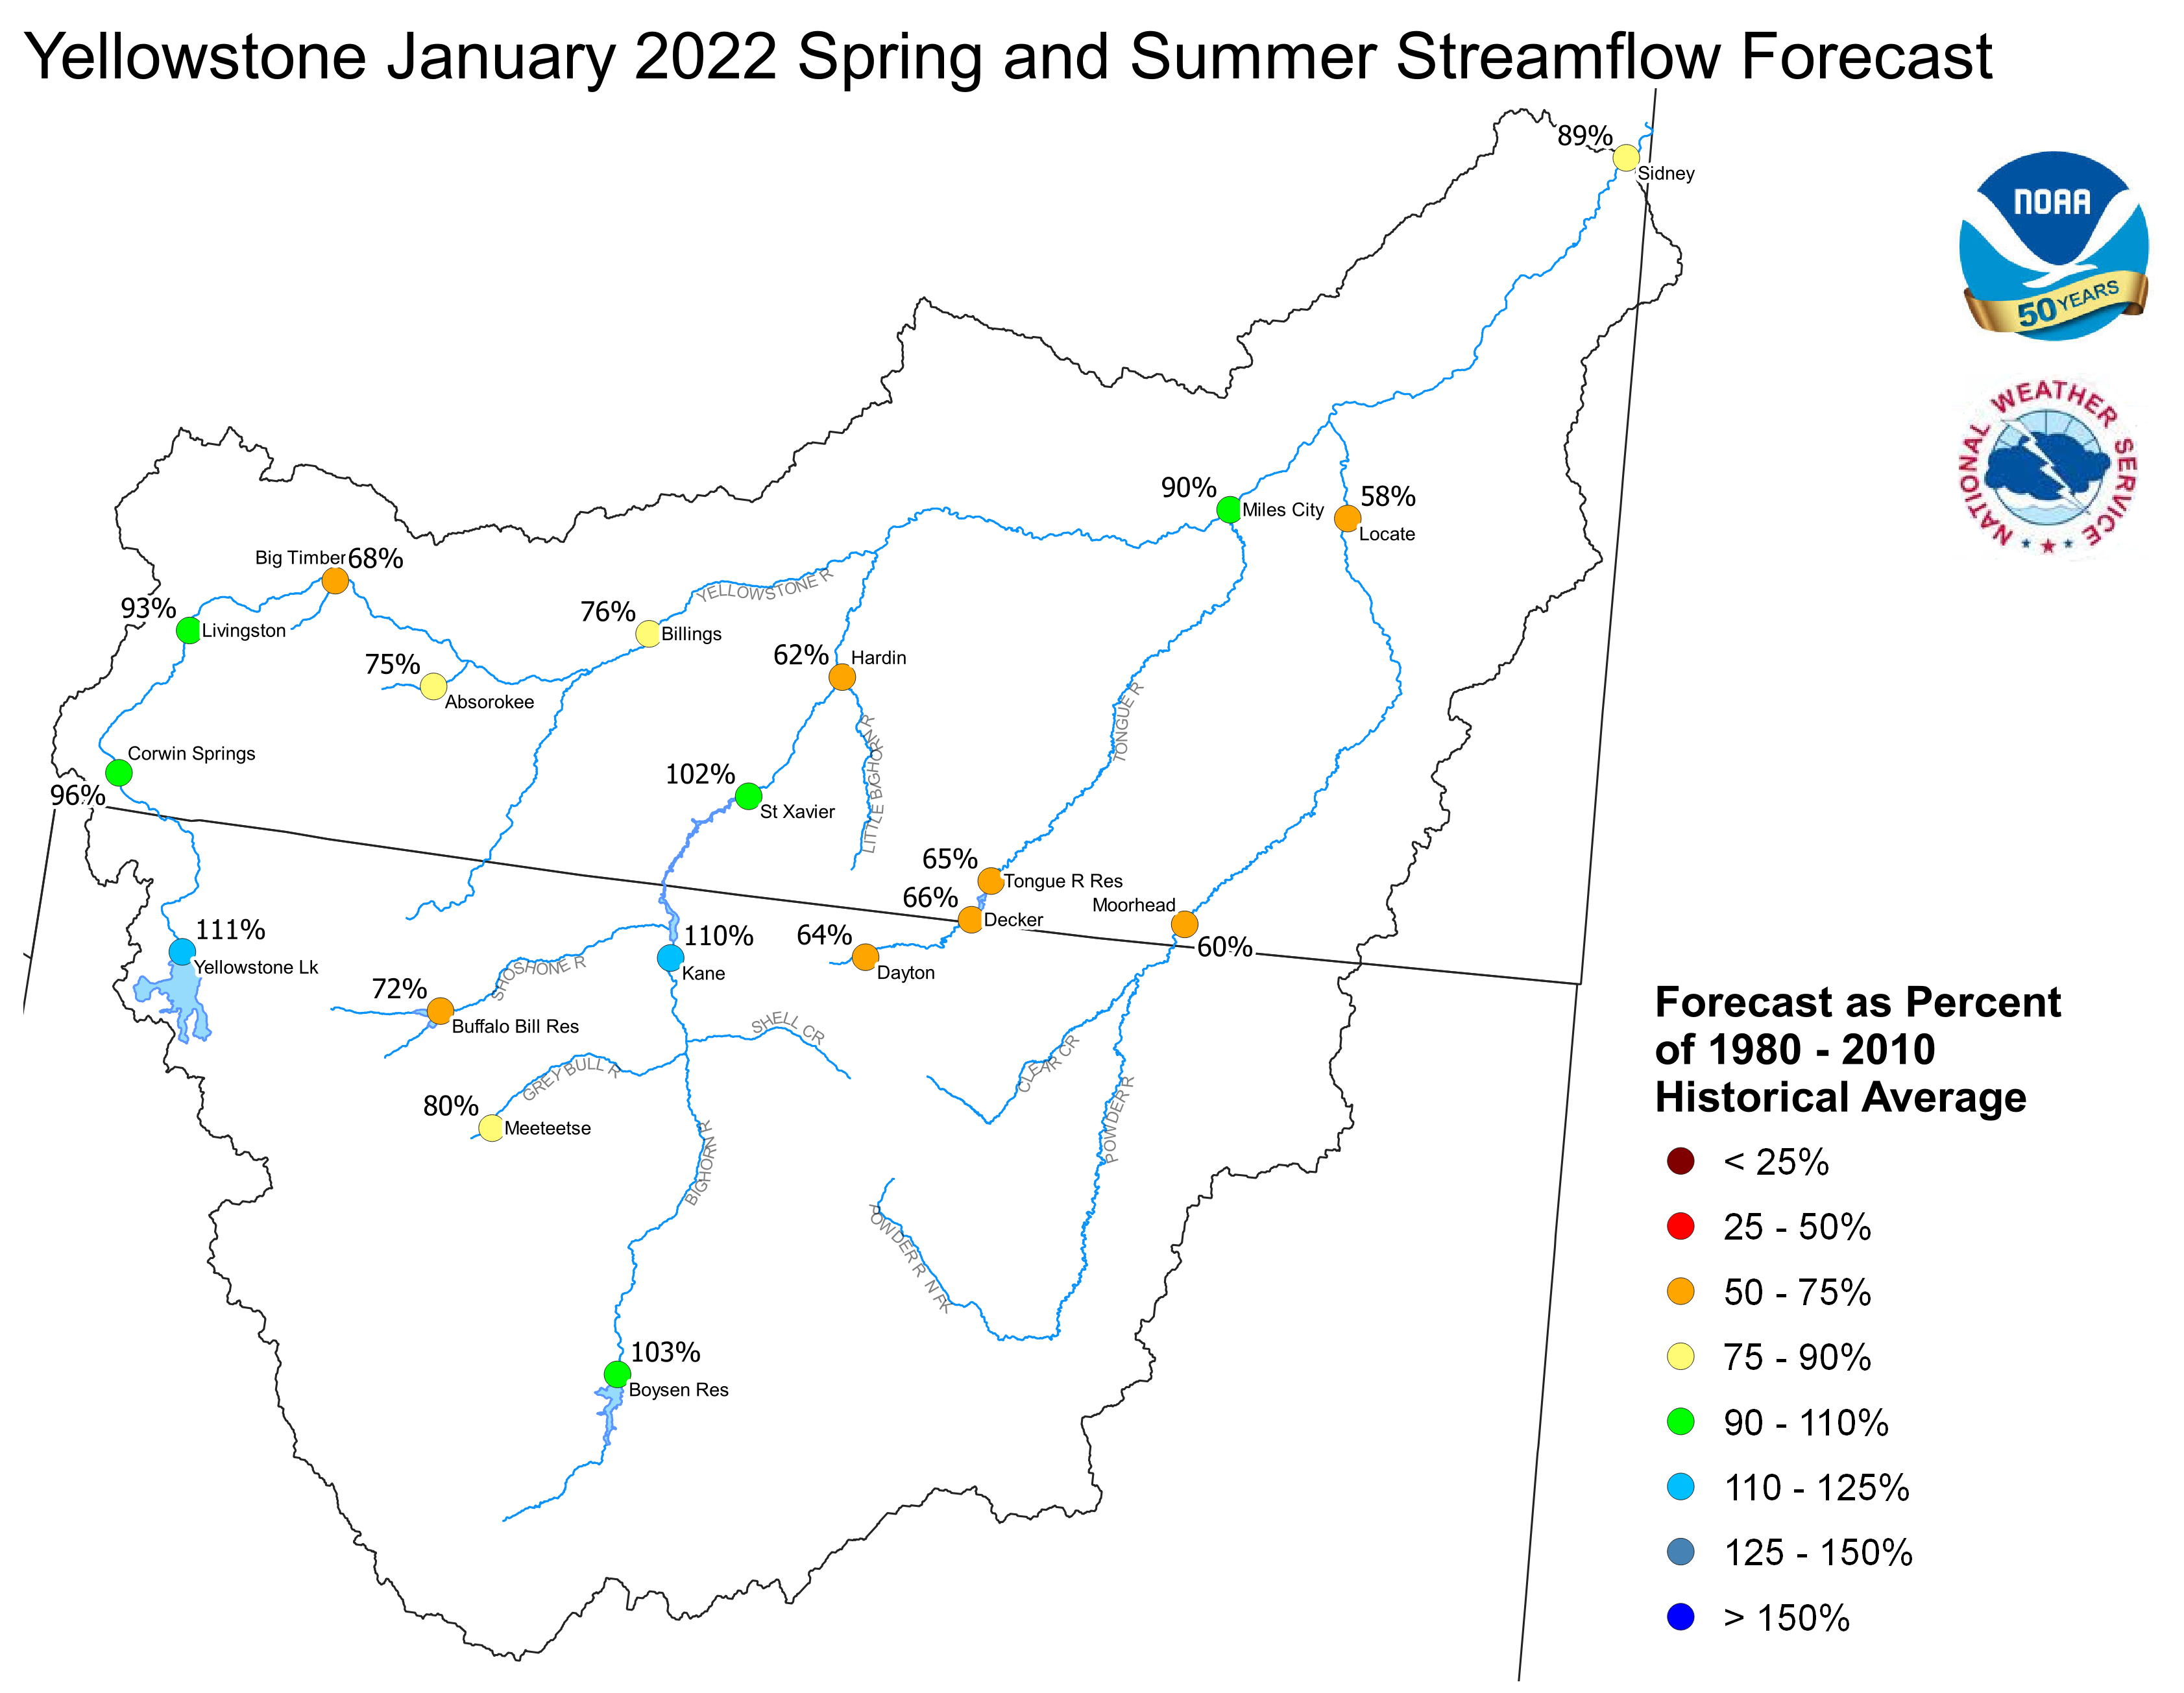
Yellowstone January 1, 2022 Spring and Summer Streamflow Forecasts
Platte Basin
The high elevation snow pack in the Upper North Platte Basin was
117 percent of average on January 1. The snow pack in the North Platte
Basin below Seminoe Reservoir was 109 percent of average. The snow
pack in the South Platte Basin was 110 percent of average.
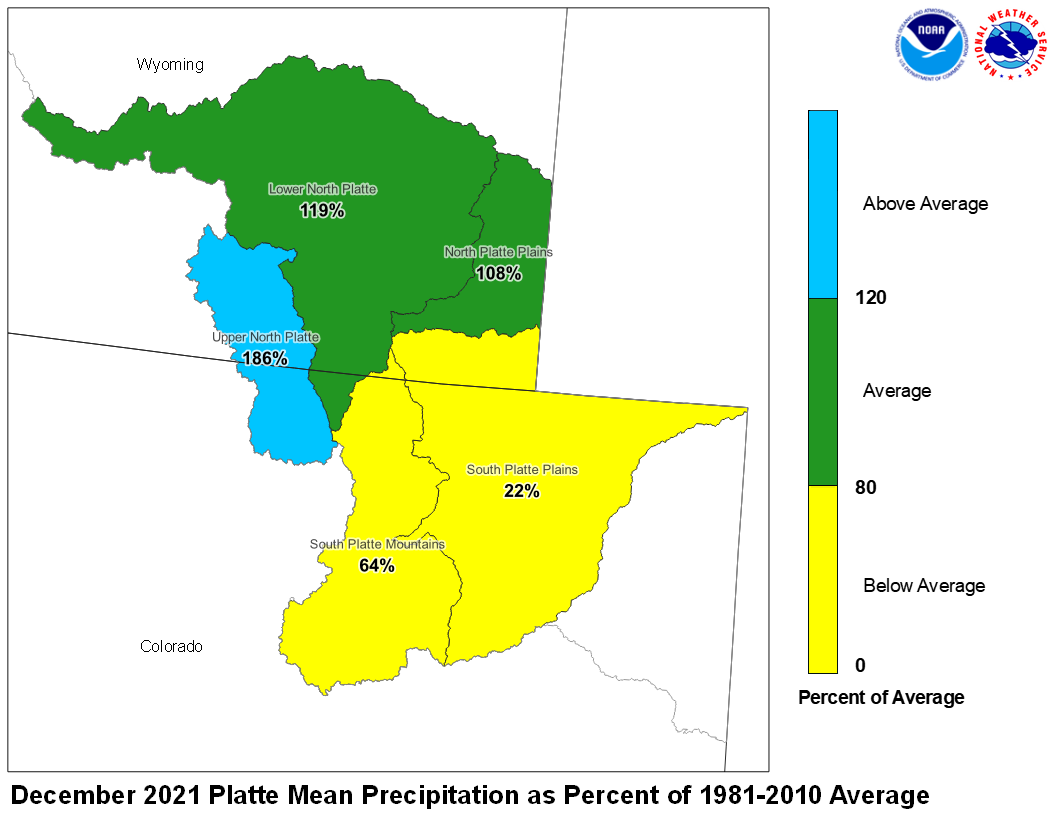
Precipitation during December in the Upper North Platte Basin was 186
percent of average. In the Lower North Platte Basin, precipitation
was 119 percent of average. The North Platte Plains below Guernsy
Reservoir had 108 percent. The South Platte Mountains had 64
percent whereas the Plains had 22 percent of average December
precipitation.
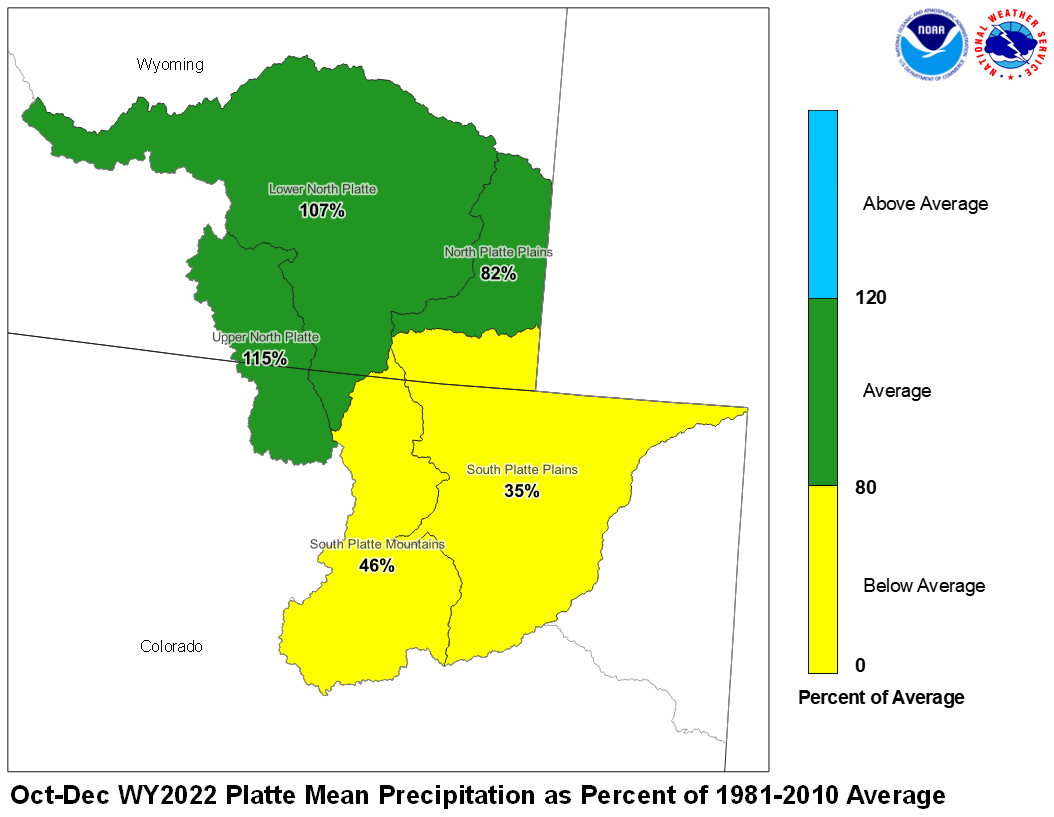
December 2021 Platte Mean Precip Oct-Dec WY2022 Platte Mean Precip
Stream flow in the Platte Basin is forecast to be below
average during the upcoming Spring and Summer. Runoff
for streams above Seminoe Reservoir are expected to be
about 95 percent of average. Streams in the South Platte
Basin above South Platte, Colorado can expect 80 percent
of average flow. For the remainder of the South Platte
basin, flows are expected near 78 percent.
Stored water in the South Platte Basin was 101 percent of average
on January 1.
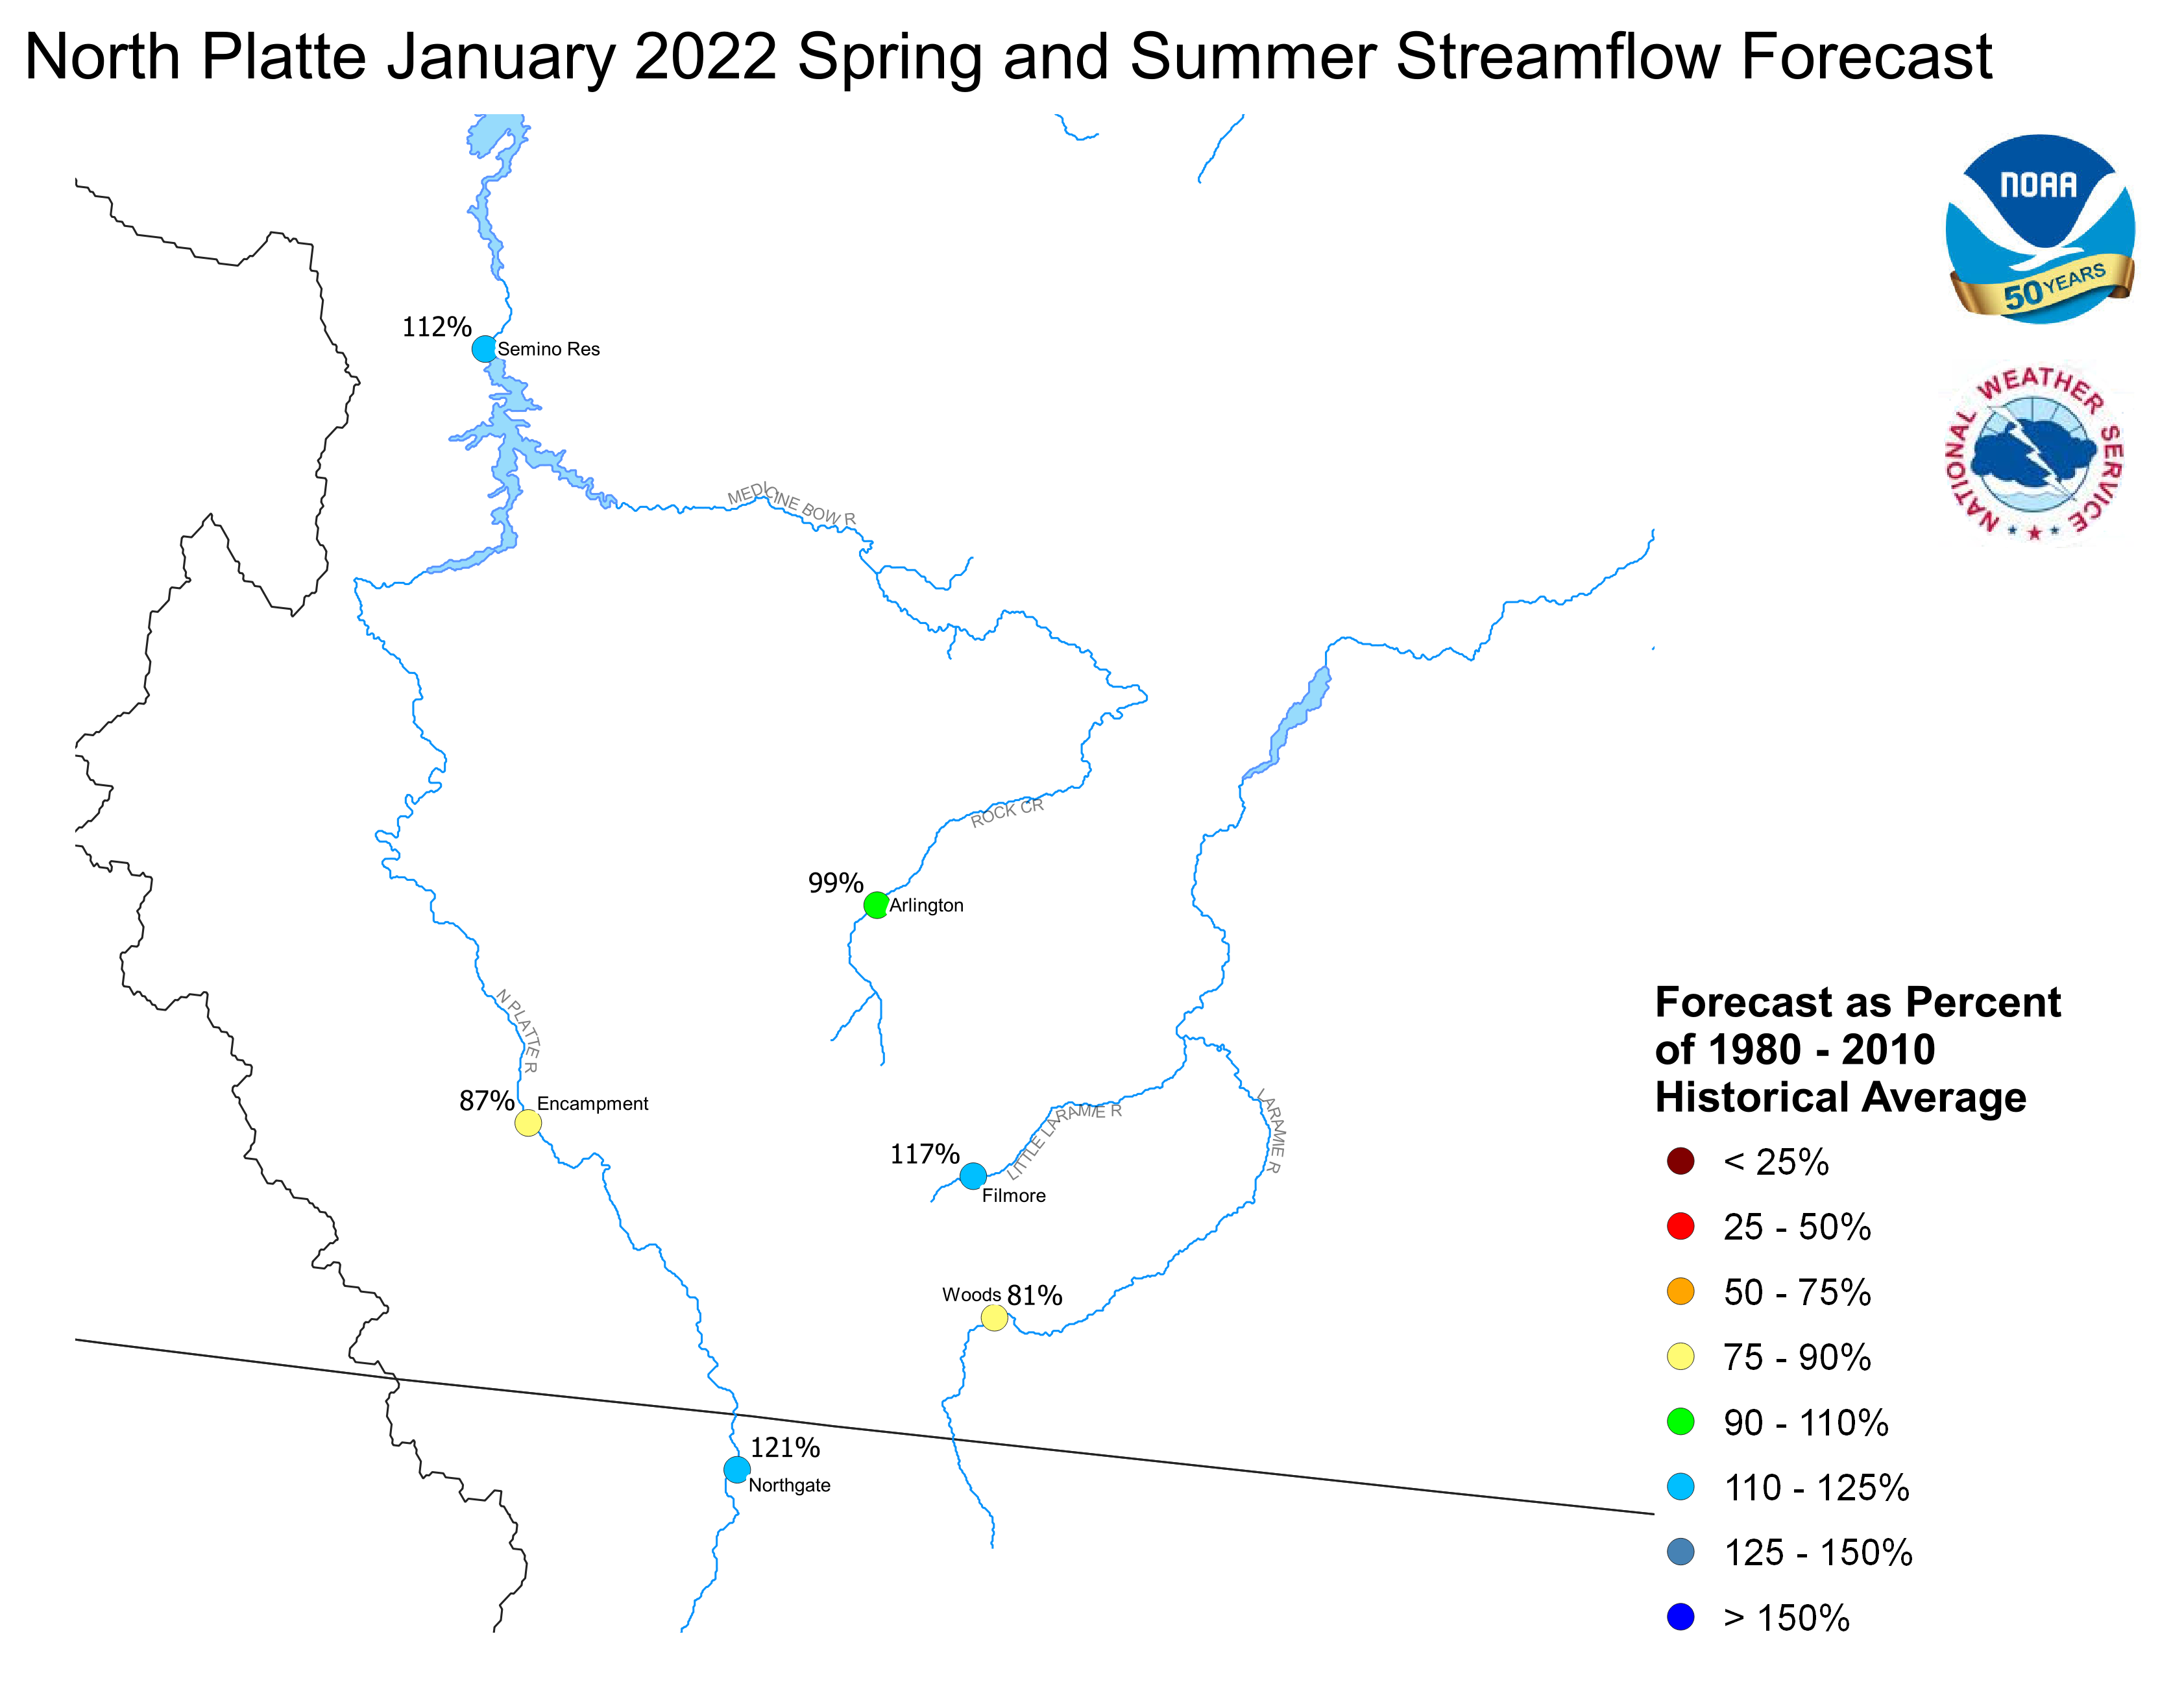
North Platte Streamflow Fcst South Platte Streamflow Fcst
FGUS63 KKRF 071820
ESPKRF
WATER SUPPLY FORECAST
NWS MISSOURI BASIN RIVER FORECAST CENTER
PLEASANT HILL MISSOURI

1211 CST FRIDAY JANUARY 07, 2022

DATA CURRENT AS OF: JANUARY 01, 2022

MISSOURI/YELLOWSTONE/PLATTE RIVER BASIN FORECASTS


                                          50%   %   10%   90%   AVG
FORECAST POINT                   PERIOD  (KAF) AVG (KAF) (KAF) (KAF)
--------------------------------------------------------------------

Boysen Resvr Inflow              Apr-Sep  652   91  1233  330    720
 SBDW4

Boysen Resvr Inflow              Apr-Sep 1176  103  1809  746   1140
 SBDW4N

Bighorn R at Kane                Apr-Sep 1091  111  1884  571    985
 LVEW4

Bighorn R at Kane                Apr-Sep 1855  110  2719 1179   1690
 LVEW4N

Greybull R at Meeteetse          Apr-Sep  163   83   247   67    196
 MEEW4

Greybull R at Meeteetse          Apr-Sep  163   80   247   67    205
 MEEW4N

Buffalo Bill Resvr Inflow        Apr-Sep  567   70   935  373    815
 CDYW4

Buffalo Bill Resvr Inflow        Apr-Sep  657   72  1029  456    910
 CDYW4N

St. Mary R nr Babb               Apr-Sep  404   88   517  347    460
 SMYM8

St. Mary R nr Babb               Apr-Sep  382   71   497  323    535
 SMYM8N

St. Mary R at Intl Boundary      Apr-Sep  330   85   476  265    390
 SMBM8

St. Mary R at Intl Boundary      Apr-Sep  448   68   585  380    660
 SMBM8N

Milk R nr Western Crossing       Apr-Sep   18   16    47    8    113
 PDBM8

Milk R nr Western Crossing       Apr-Sep   28   69    63   13     41
 PDBM8N

Milk R nr Eastern Crossing       Apr-Sep  152   71   213  140    215
 ERNM8

Milk R nr Eastern Crossing       Apr-Sep   47   42   137   24    112
 ERNM8N

North Platte R nr Northgate      Apr-Sep  303  124   500  135    245
 NGTC2

North Platte R nr Northgate      Apr-Sep  356  121   552  181    295
 NGTC2N

Encampment R nr Encampment       Apr-Sep  135   86   186   87    156
 ECRW4

Encampment R nr Encampment       Apr-Sep  145   87   197   97    166
 ECRW4N

Rock Cr nr Arlington             Apr-Sep   52   99    70   36     53
 KCRW4

Rock Cr nr Arlington             Apr-Sep   53   99    70   37     53
 KCRW4N

Seminoe Resvr Inflow             Apr-Sep  867  113  1194  426    765
 SETW4

Seminoe Resvr Inflow             Apr-Sep 1032  112  1361  581    920
 SETW4N

Laramie R nr Woods Landing       Apr-Sep   79   74   150   33    108
 WODW4

Laramie R nr Woods Landing       Apr-Sep  115   81   185   67    142
 WODW4N

Little Laramie R nr Filmore      Apr-Sep   64  117   107   41     55
 SMTW4

Little Laramie R nr Filmore      Apr-Sep   66  117   109   43     57
 SMTW4N

Antero Resvr Inflow              Apr-Sep   12   86    19    6     14
 ANRC2

Antero Resvr Inflow              Apr-Sep   12   86    19    6     14
 ANRC2N

Spinney Mountain Resvr Inflow    Apr-Sep   47   82    91   31     57
 SPYC2

Spinney Mountain Resvr Inflow    Apr-Sep   38   83    82   19     45
 SPYC2N

Elevenmile Canyon Resvr Inflow   Apr-Sep   39   67    70   32     59
 EVNC2

Elevenmile Canyon Resvr Inflow   Apr-Sep   40   80    85   21     50
 EVNC2N

Cheesman Lk Inflow               Apr-Sep   65   65   123   45    100
 CHEC2

Cheesman Lk Inflow               Apr-Sep   73   79   144   41     93
 CHEC2N

S Platte R at S Platte           Apr-Sep  322  134   411  295    240
 SPTC2

S Platte R at S Platte           Apr-Sep  143   70   249   78    205
 SPTC2N

Bear Cr at Morrison              Apr-Sep   14   54    28    7     26
 MRRC2

Bear Cr at Morrison              Apr-Sep   14   54    28    7     26
 MRRC2N

Clear Cr at Golden               Apr-Sep   88   75   132   49    118
 GLDC2

Clear Cr at Golden               Apr-Sep  101   77   146   57    131
 GLDC2N

St. Vrain Cr at Lyons            Apr-Sep   66   84    95   42     79
 LNSC2

St. Vrain Cr at Lyons            Apr-Sep   94   86   132   64    109
 LNSC2N

Boulder Cr nr Orodell            Apr-Sep   37   79    59   26     47
 OROC2

Boulder Cr nr Orodell            Apr-Sep   53  101    76   37     52
 OROC2N

S Boulder Cr nr Eldorado Sprgs   Apr-Sep   29   84    40   16     35
 BELC2

S Boulder Cr nr Eldorado Sprgs   Apr-Sep   31   77    48   16     40
 BELC2N

Cache La Poudre at Canyon Mouth  Apr-Sep  213  197   320  107    108
 FTDC2

Cache La Poudre at Canyon Mouth  Apr-Sep  247  118   356  131    210
 FTDC2N

Lima Resvr Inflow                Apr-Sep   38   50    63   19     76
 LRRM8

Lima Resvr Inflow                Apr-Sep   38   48    63   19     79
 LRRM8N

Clark Canyon Resvr Inflow        Apr-Sep   38   35    54   28    110
 CLKM8

Clark Canyon Resvr Inflow        Apr-Sep   85   43   126   44    198
 CLKM8N

Beaverhead R at Barretts         Apr-Sep  121   61   138  112    199
 BARM8

Beaverhead R at Barretts         Apr-Sep  114   41   154   67    280
 BARM8N

Ruby R Resvr Inflow              Apr-Sep   74   84    88   53     88
 ALRM8

Ruby R Resvr Inflow              Apr-Sep   74   76    88   53     97
 ALRM8N

Big Hole R nr Melrose            Apr-Sep  419   70   597  249    595
 MLRM8

Big Hole R nr Melrose            Apr-Sep  483   73   660  317    660
 MLRM8N

Hebgen Resvr Inflow              Apr-Sep  363   78   460  251    465
 HBDM8

Hebgen Resvr Inflow              Apr-Sep  363   78   460  251    465
 HBDM8N

Ennis Resvr Inflow               Apr-Sep  521   73   619  385    715
 ELMM8

Ennis Resvr Inflow               Apr-Sep  557   75   703  390    745
 ELMM8N

Gallatin R nr Gateway            Apr-Sep  255   54   324  203    475
 GLGM8

Gallatin R nr Gateway            Apr-Sep  255   54   324  203    475
 GLGM8N

Gallatin R at Logan              Apr-Sep  259   51   370  175    505
 LOGM8

Gallatin R at Logan              Apr-Sep  393   60   497  284    650
 LOGM8N

Missouri R at Toston             Apr-Sep 1250   61  1816  751   2060
 TOSM8

Missouri R at Toston             Apr-Sep 1919   76  2569 1296   2510
 TOSM8N

Missouri R at Fort Benton        Apr-Sep 1771   58  2076 1589   3060
 FBNM8

Missouri R at Fort Benton        Apr-Sep 2920   79  3693 2048   3690
 FBNM8N

Missouri R nr Virgelle           Apr-Sep 1919   56  2531 1690   3420
 VRGM8

Missouri R nr Virgelle           Apr-Sep 3576   84  4447 2566   4280
 VRGM8N

Missouri R nr Landusky           Apr-Sep 2059   56  2661 1754   3680
 LDKM8

Missouri R nr Landusky           Apr-Sep 3740   83  4669 2704   4490
 LDKM8N

Missouri R below Fort Peck Dam   Apr-Sep 2137   56  2755 1784   3840
 FPKM8

Missouri R below Fort Peck Dam   Apr-Sep 3830   81  4793 2746   4730
 FPKM8N

Gibson Resvr Inflow              Apr-Sep  320   71   538  226    450
 AGSM8

Gibson Resvr Inflow              Apr-Sep  320   71   538  226    450
 AGSM8N

Marias R nr Shelby               Apr-Sep  380   87   694  224    435
 SHLM8

Marias R nr Shelby               Apr-Sep  443   91   757  276    490
 SHLM8N

Musselshell R at Harlowton       Apr-Sep   19   23    47   14     80
 HLWM8

Musselshell R at Harlowton       Apr-Sep   26   28    56   20     95
 HLWM8N

Yellowstone R at Yellowstone Lk  Apr-Sep  677   83   806  462    815
 YLOW4

Yellowstone R at Yellowstone Lk  Apr-Sep  936  111  1117  680    840
 YLOW4N

Yellowstone R at Corwin Sprgs    Apr-Sep 1632   82  1988 1144   1980
 CORM8

Yellowstone R at Corwin Sprgs    Apr-Sep 1983   96  2408 1453   2070
 CORM8N

Yellowstone R at Livingston      Apr-Sep 1827   80  2225 1316   2290
 LIVM8

Yellowstone R at Livingston      Apr-Sep 2258   93  2705 1686   2440
 LIVM8N

Yellowstone R at Billings        Apr-Sep 2588   64  3488 1745   4070
 BILM8

Yellowstone R at Billings        Apr-Sep 3638   76  4622 2785   4790
 BILM8N

Yellowstone R at Miles City      Apr-Sep 3965   68  6360 2882   5850
 MILM8

Yellowstone R at Miles City      Apr-Sep 6494   90  9388 4973   7250
 MILM8N

Yellowstone R at Sidney          Apr-Sep 3824   67  6336 2644   5710
 SIDM8

Yellowstone R at Sidney          Apr-Sep 6717   89  9772 5050   7540
 SIDM8N

Boulder R at Big Timber          Apr-Sep  214   64   282  152    335
 BTMM8

Boulder R at Big Timber          Apr-Sep  255   68   323  194    375
 BTMM8N

Stillwater R nr Absarokee        Apr-Sep  389   72   474  275    540
 SRAM8

Stillwater R nr Absarokee        Apr-Sep  445   75   532  334    595
 SRAM8N

Clks Fk Yellowstone R nr Belfry  Apr-Sep  395   64   611  277    620
 BFYM8

Clks Fk Yellowstone R nr Belfry  Apr-Sep  465   67   683  350    695
 BFYM8N

Bighorn R nr St. Xavier          Apr-Sep 1135   79  2024  765   1430
 STXM8

Bighorn R nr St. Xavier          Apr-Sep 2588  102  3663 1794   2550
 STXM8N

Little Bighorn R nr Hardin       Apr-Sep   78   62   197   48    127
 HRDM8

Little Bighorn R nr Hardin       Apr-Sep   78   62   197   48    127
 HRDM8N

Tongue R nr Dayton               Apr-Sep   59   61    78   40     96
 DAYW4

Tongue R nr Dayton               Apr-Sep   65   64    83   45    101
 DAYW4N

Tongue R nr Decker               Apr-Sep  111   47   172   50    235
 DSLM8

Tongue R nr Decker               Apr-Sep  158   66   222   91    240
 DSLM8N

Tongue R Resvr Inflow            Apr-Sep  112   48   184   50    235
 DKRM8

Tongue R Resvr Inflow            Apr-Sep  159   65   231   92    245
 DKRM8N

Powder R at Moorhead             Apr-Sep  114   51   272   43    225
 MHDM8

Powder R at Moorhead             Apr-Sep  162   60   315   74    270
 MHDM8N

Powder R nr Locate               Apr-Sep  125   48   318   51    260
 LOCM8

Powder R nr Locate               Apr-Sep  175   58   356   81    305
 LOCM8N


Locations with an `N` suffix indicate natural flows excluding
stream augmentations.

KAF: Thousands of Acre-feet

%AVG: Current 50%/AVG

AVG: Average(50%) seasonal runoff voulme as simulated by the river
forecast model considering acontinuous simulation of the basin
response to historic climate data (observed precipitation and
temperatures) over the period of 1981-2010.

The 50%, 10% and 90% columns indicate the probability that the
actual volume will exceed the forecast for the valid time perion
for more information, please visit: www.weather.gov/mbrfc/water


$$


