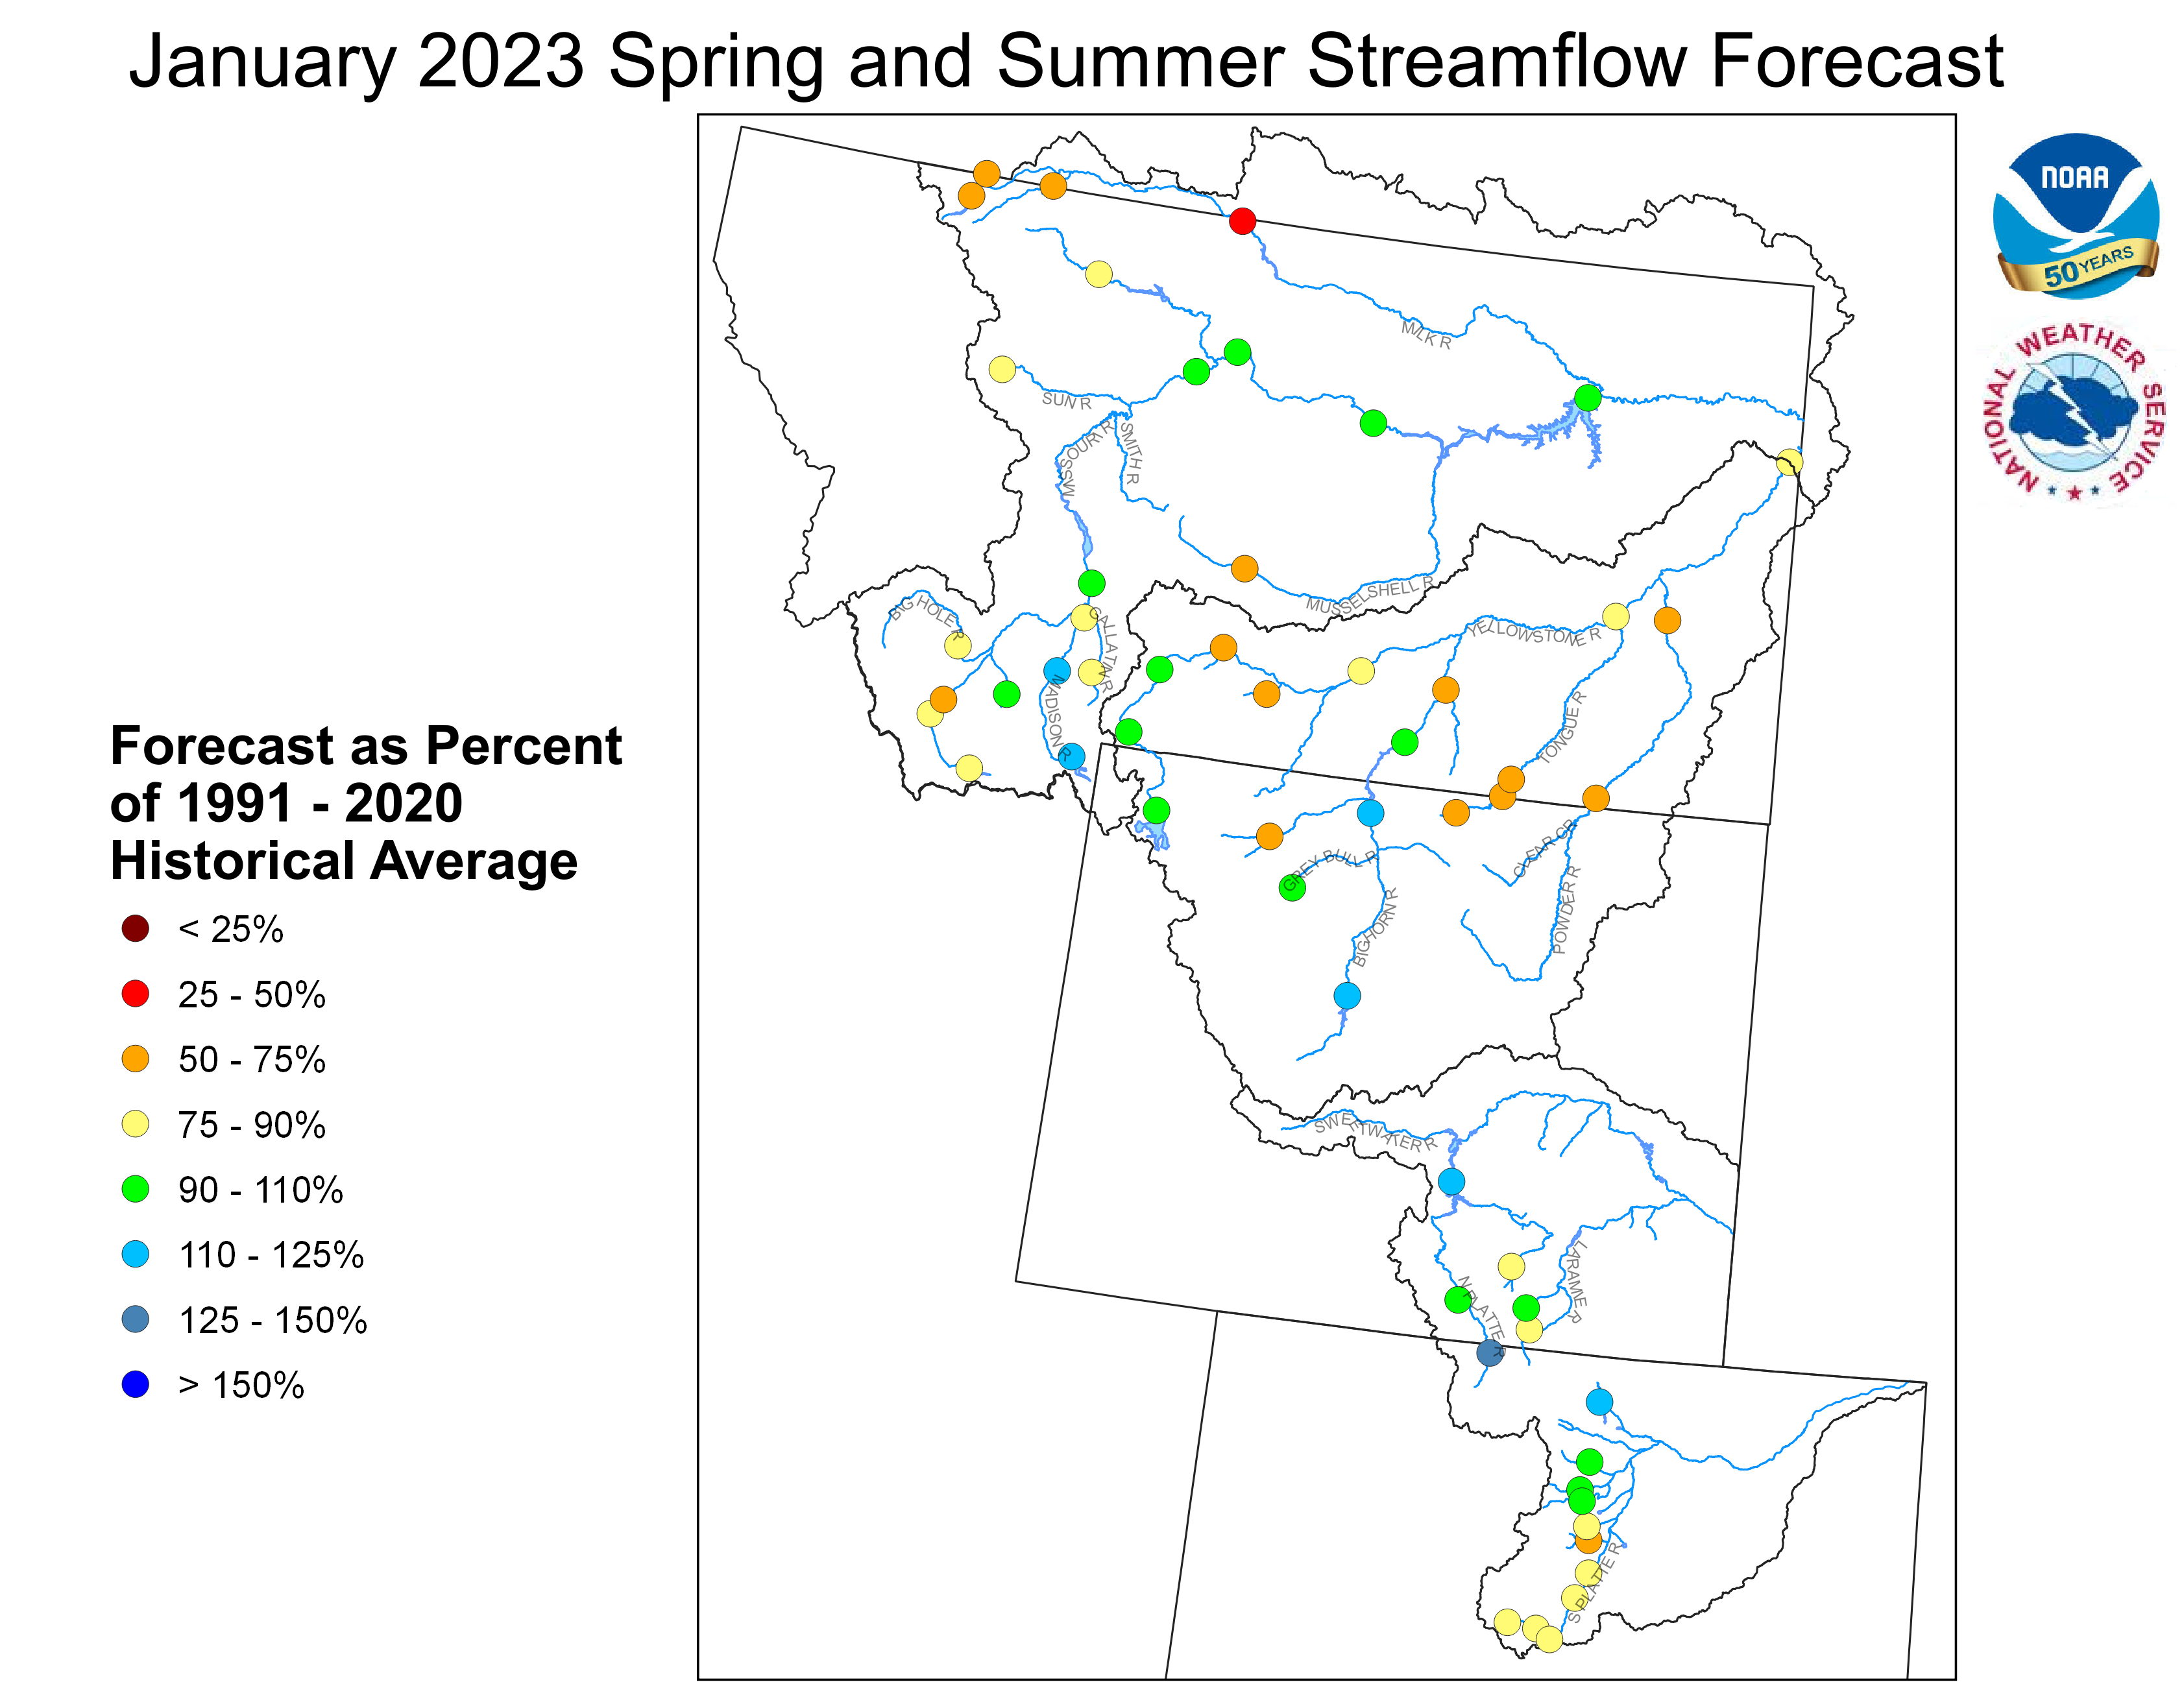
January 1, 2023 Spring and Summer Streamflow Forecasts
Upper Missouri Basin
The high elevation snow pack in the Upper Missouri Basin as of January 1
was near to above average. The snow pack in the St. Mary Basin was 111 percent,
and the Milk River Basin was 159 percent.
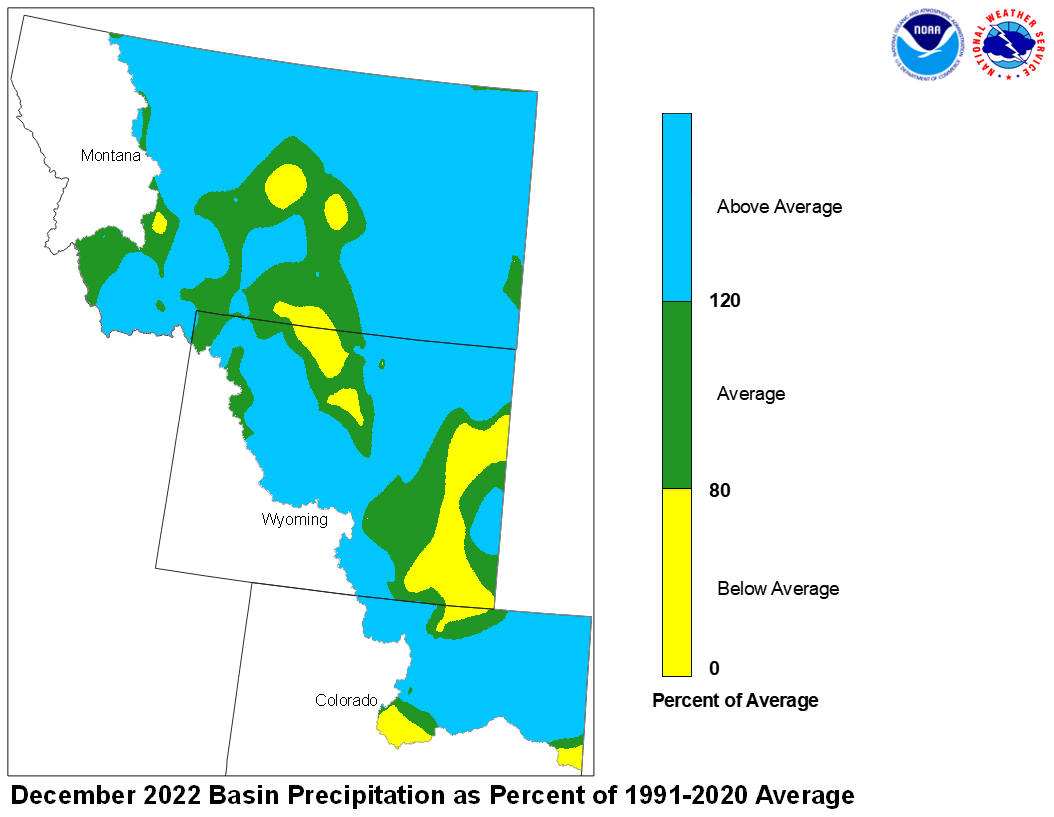
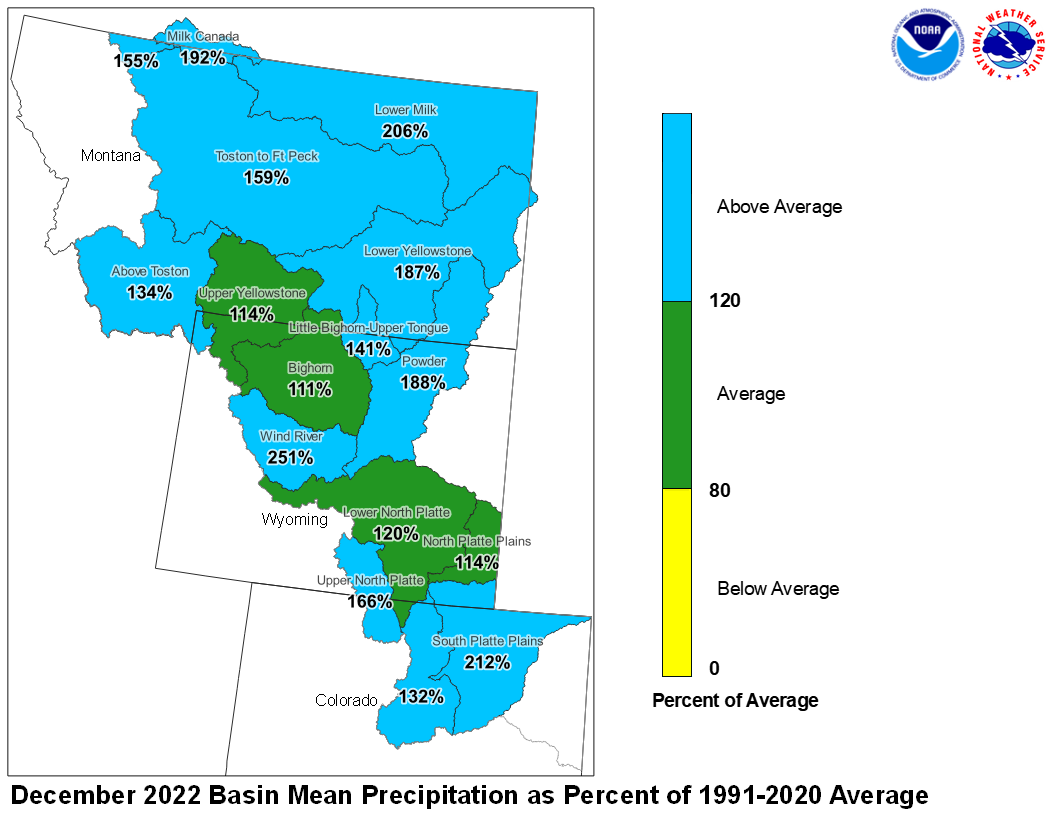
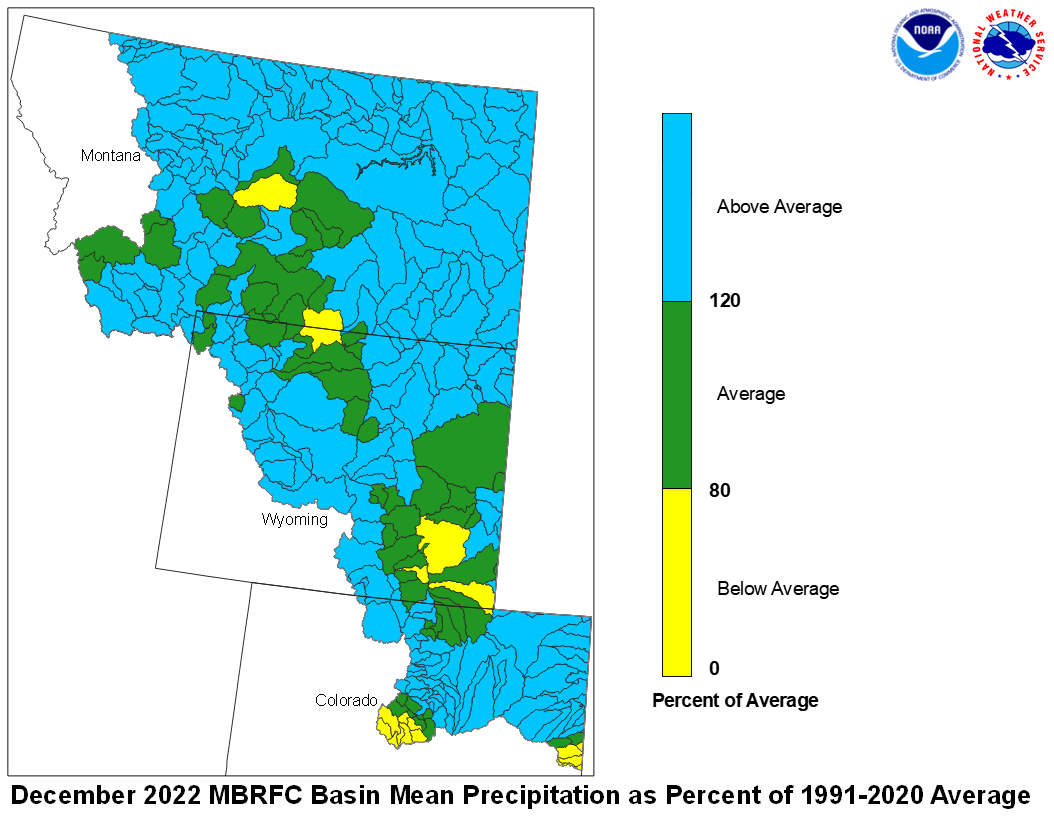
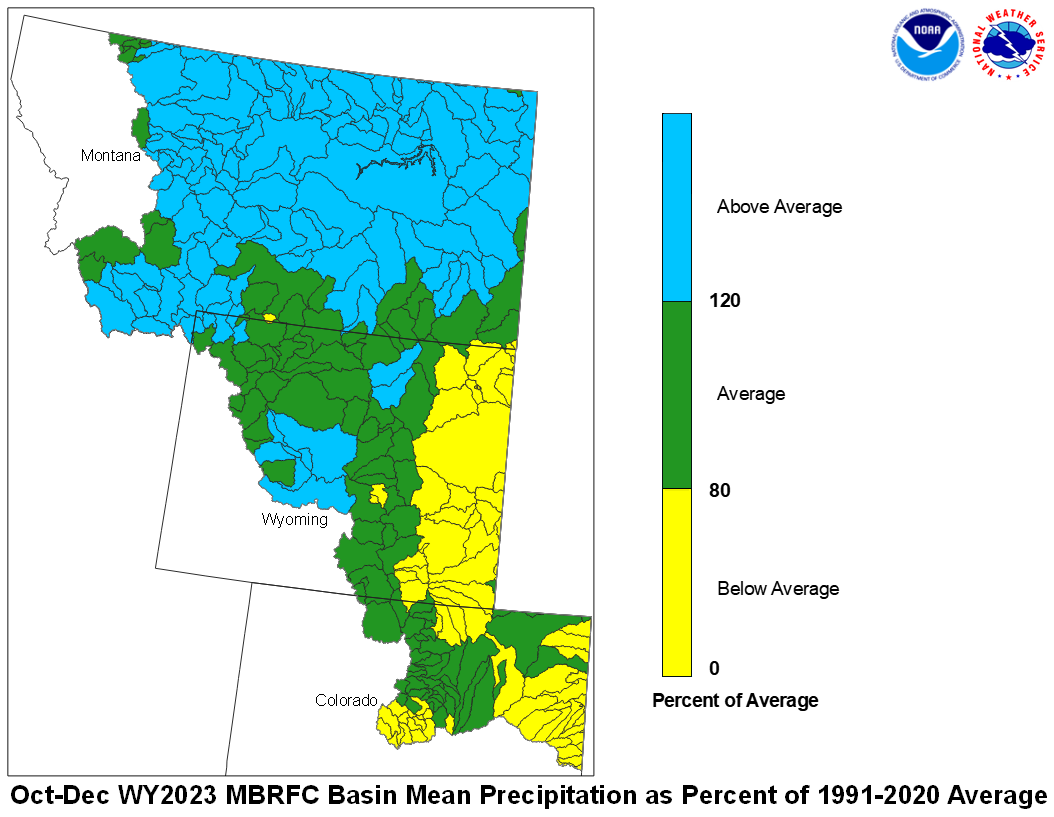
December precipitation across the Upper Missouri Basin was above average.
Basin precipitation summaries for the Missouri Basin include: Milk St. Mary,
155 percent; Milk Canada, 192 percent; Lower Milk, 206 percent; above Toston,
134 percent; Toston to Ft. Peck, 159 percent.

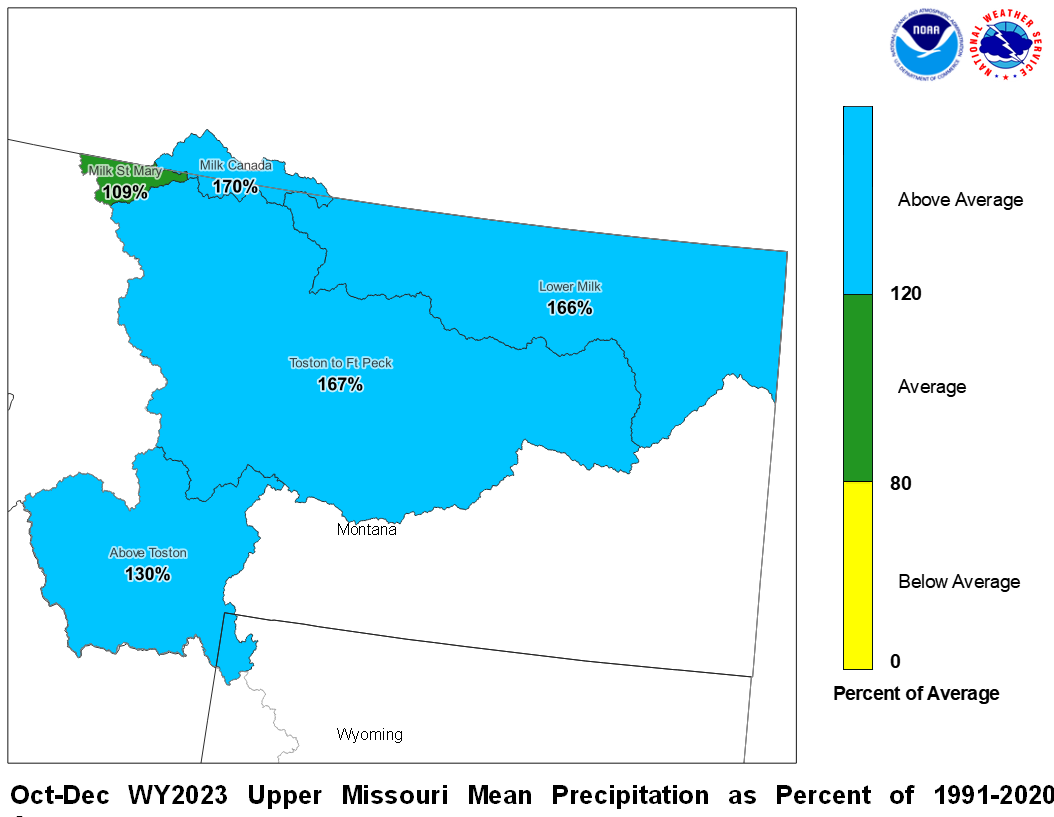
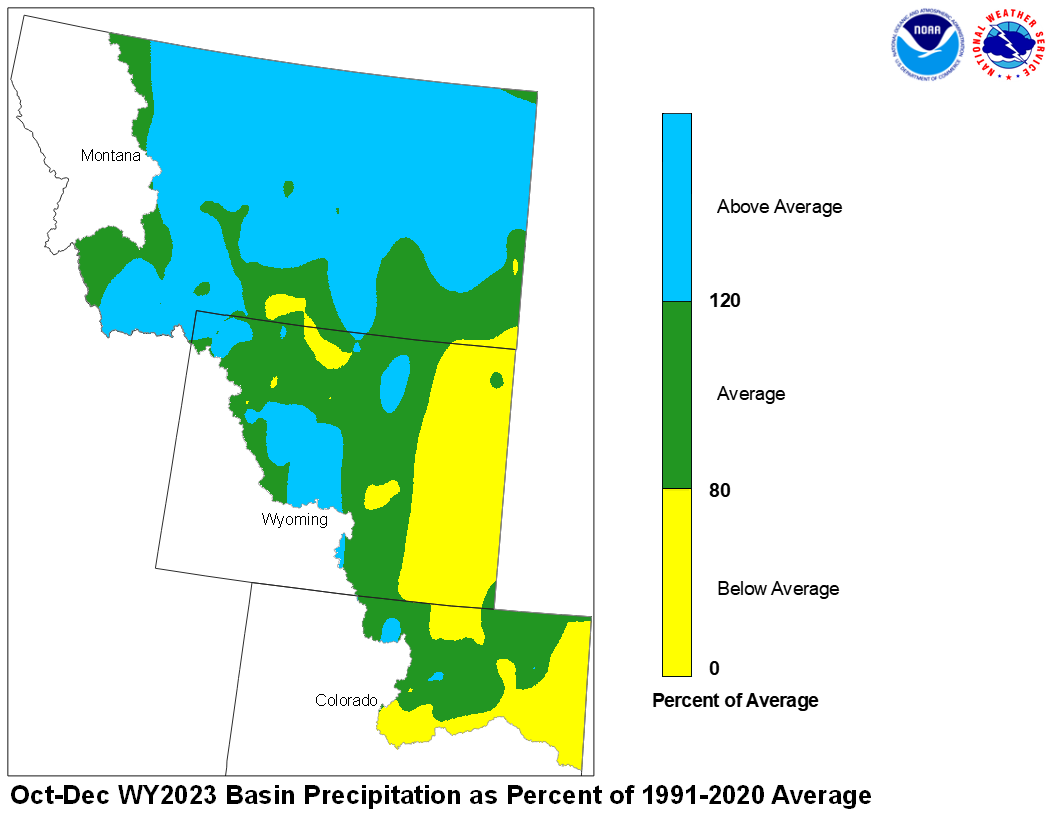
December 2022 Upper Missouri Mean Precip Oct-Dec WY2023 Upper Missouri Mean Precip
Stream flow in the Upper Missouri Basin is forecast to be
below average during the upcoming Spring and Summer.
The St. Mary River is forecast to have 57 percent of average
April-September flows. Runoff is expected to range around
96 percent of average for the Missouri Basin above Fort Peck,
Montana.
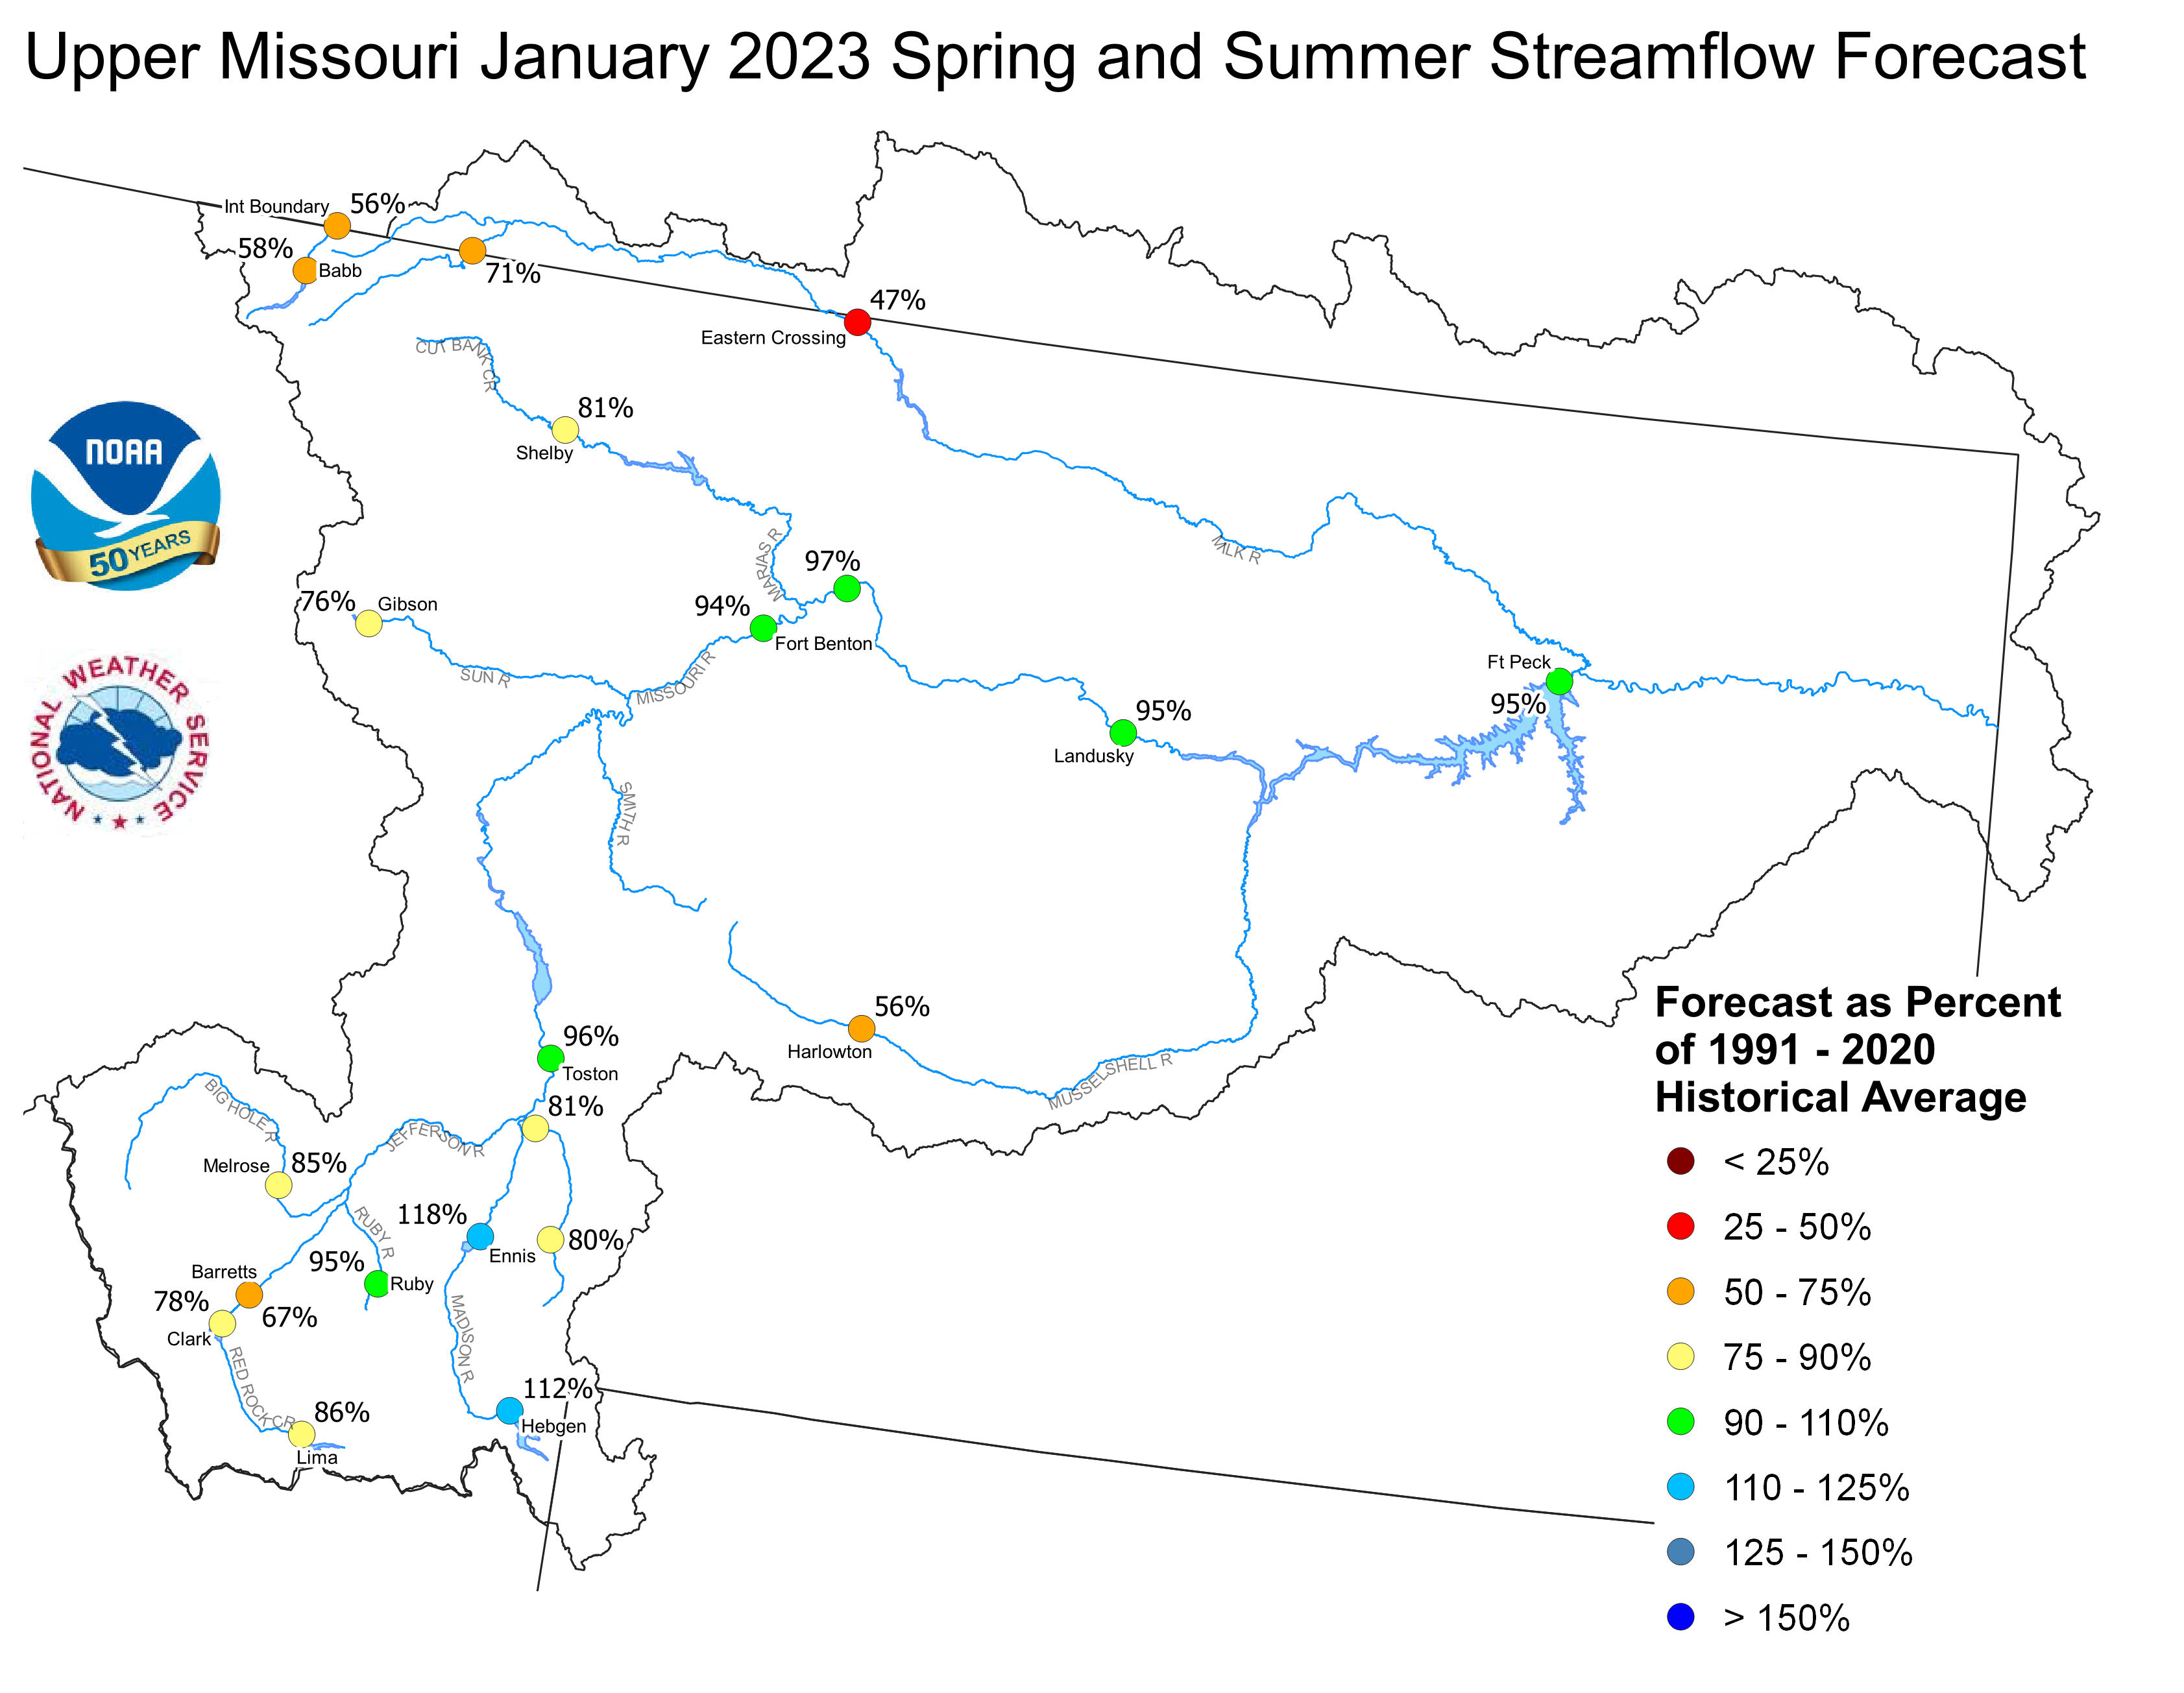
Upper Missouri January 1, 2023 Spring and Summer Streamflow Forecasts
Of the four major irrigation reservoirs in Montana; Lima
Reservoir had 58 percent average storage, Clark Canyon was
holding 82 percent of average water, Gibson Reservoir had 41
percent of average stored water, and Fresno Reservoir had
76 percent of average stored water.
Yellowstone Basin
The high elevation snow pack in the Yellowstone Basin was near average
on January 1. The snow pack in the Upper Yellowstone Basin was 123 percent
of average. The snow packs in the Wind, Bighorn, and Shoshone Basins were 120,
98, and 103 percent of average, respectively. The snow packs in the Tongue
and Powder basins were 81 and 80 percent of average, respectively.
Precipitation during December was above average. The upper Yellowstone
River Basin received 114 percent of average precipitation while the
Lower Yellowstone River Basin reported 187 percent of average. The
Bighorn Basin received 111 percent of average precipitation while the
Wind River Basin received 251 percent of average. The Little Bighorn -
Upper Tongue Basin received 141 percent of average, and the Powder River
had 188 percent of average precipitation.
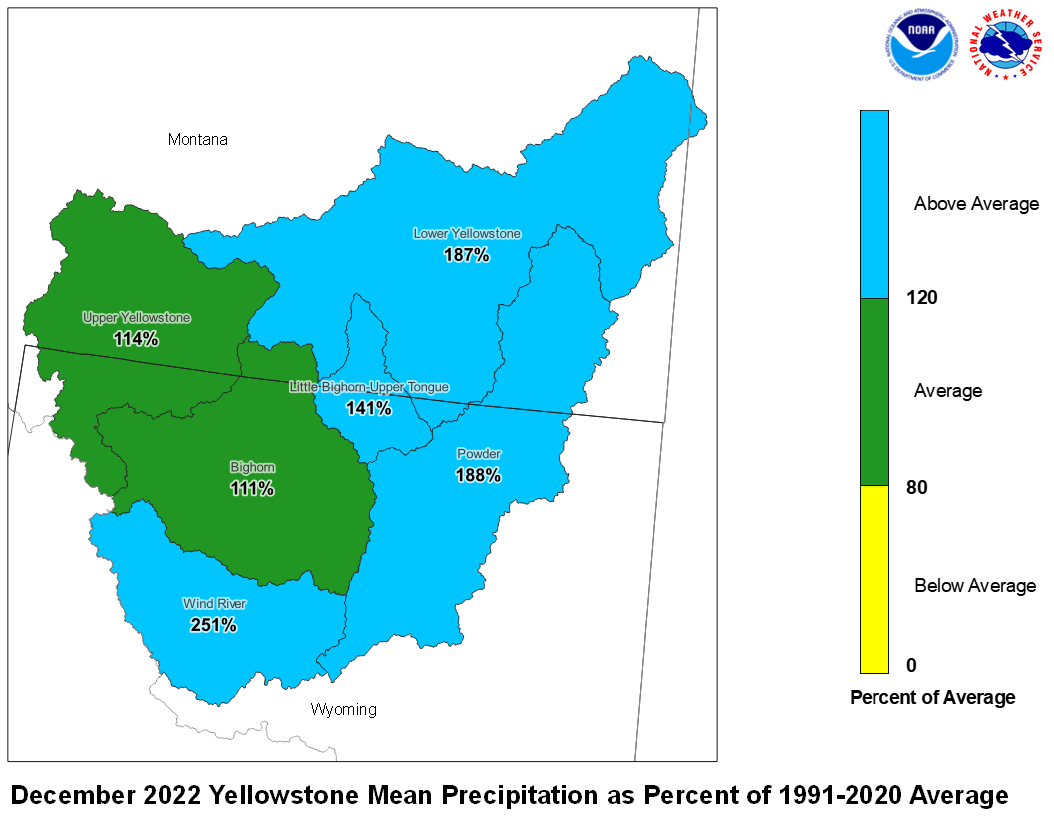
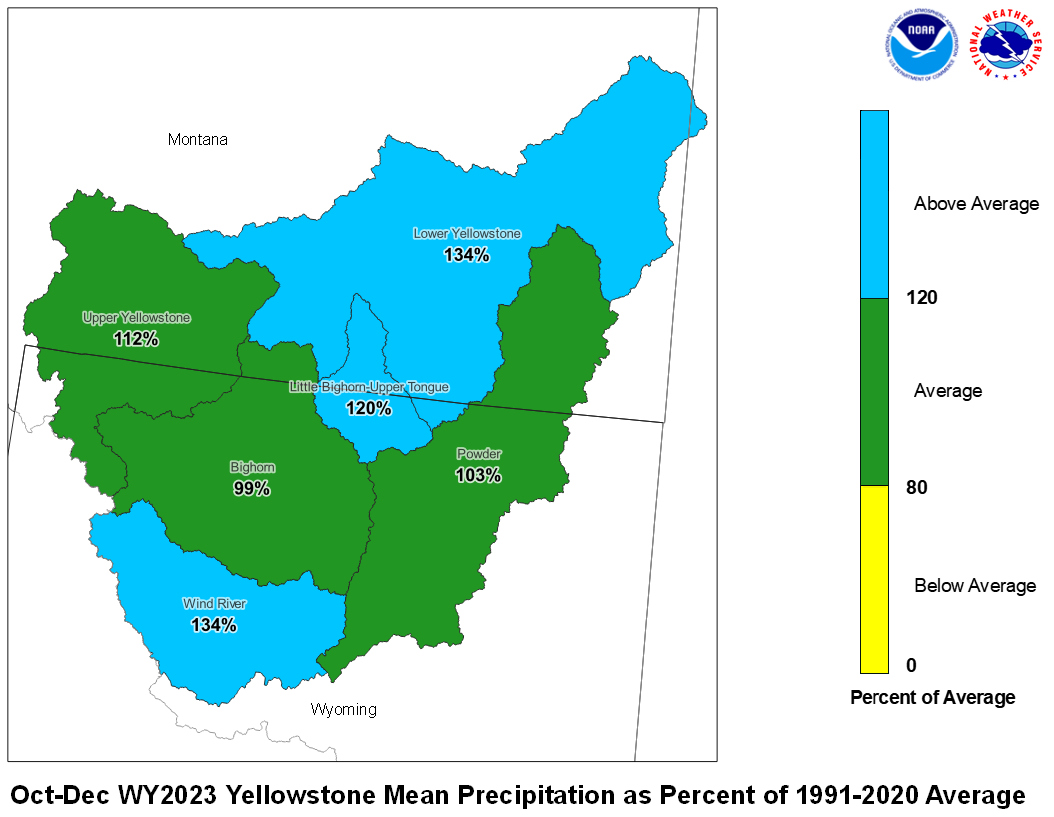
December 2022 Yellowstone Mean Precip Oct-Dec WY2023 Yellowstone Mean Precip
Forecast stream flow in the Yellowstone Basin is below average
for the upcoming Spring and Summer. Stream flow for the
Yellowstone River above Sidney, Montana is forecast to be about
83 percent of average. Flow in the Tongue Basin is expected to be
68 percent of average. Flows in the Powder River are expected
to be about 64 percent of average.
Monthend storage at Boysen Reservoir was 101 percent of average.
Stored water in Buffalo Bill Reservoir was 102 percent of average.
Monthend storage was 94 percent of average at Bighorn Reservoir.
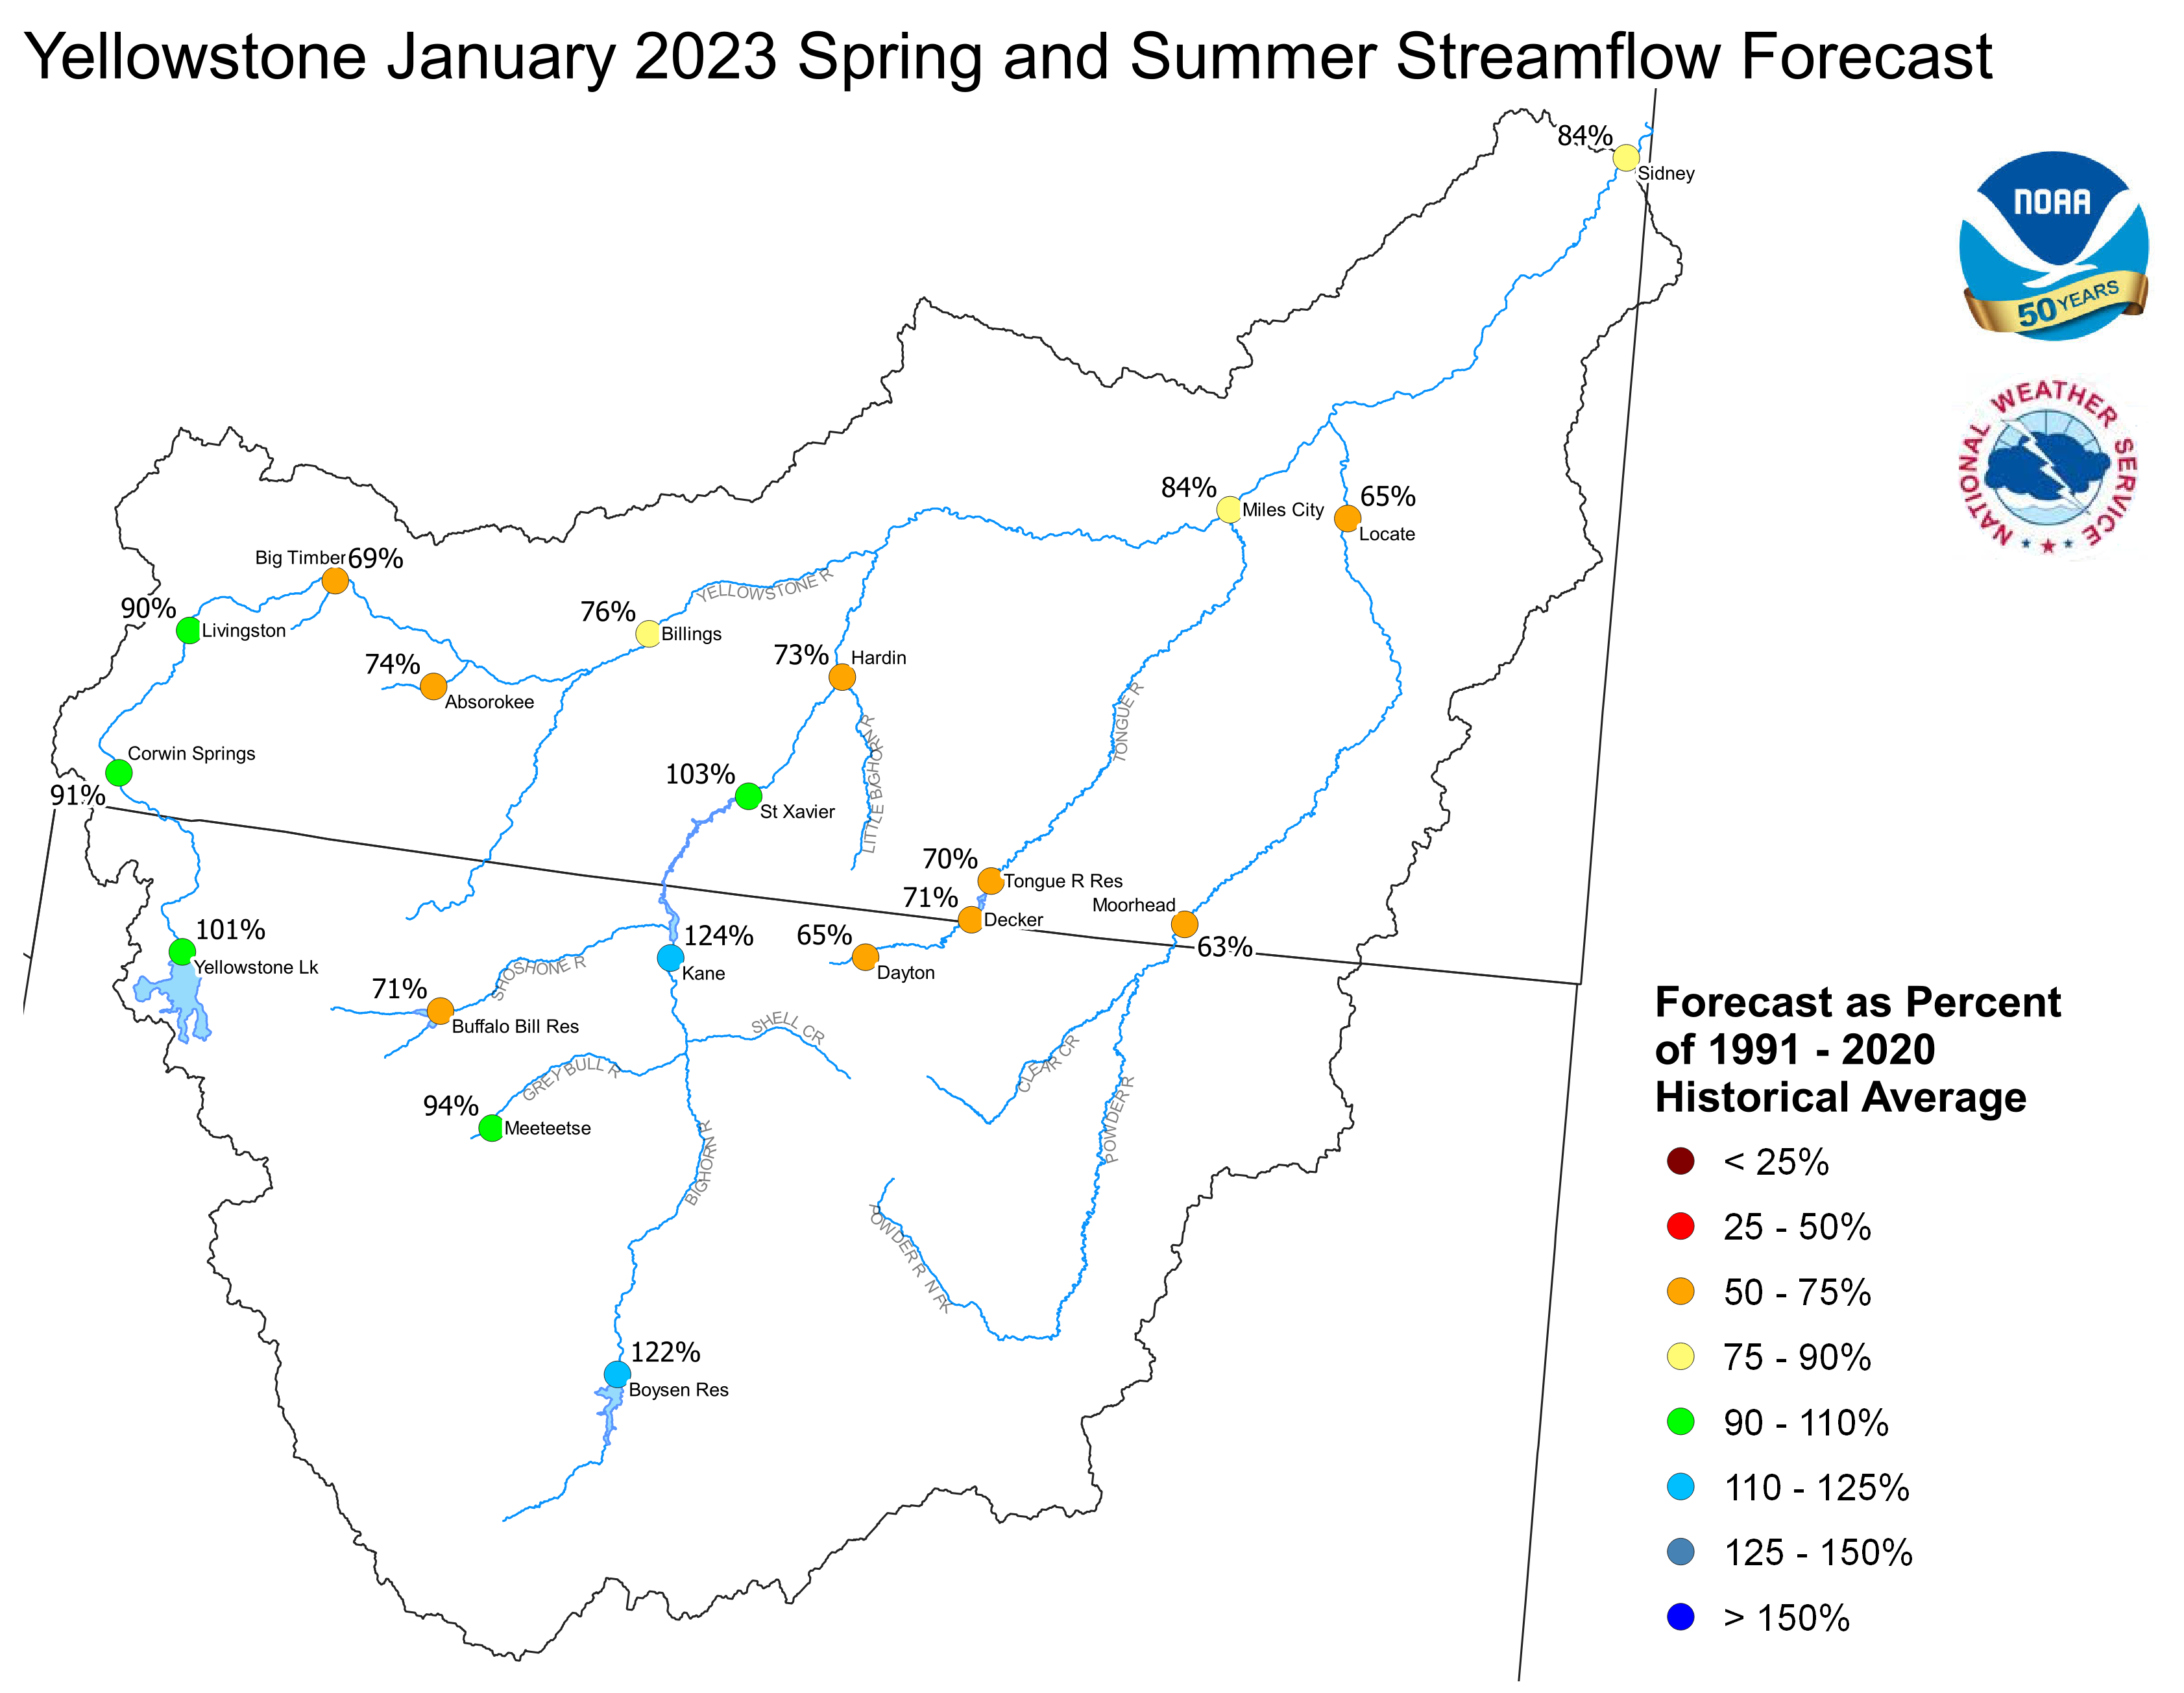
Yellowstone January 1, 2023 Spring and Summer Streamflow Forecasts
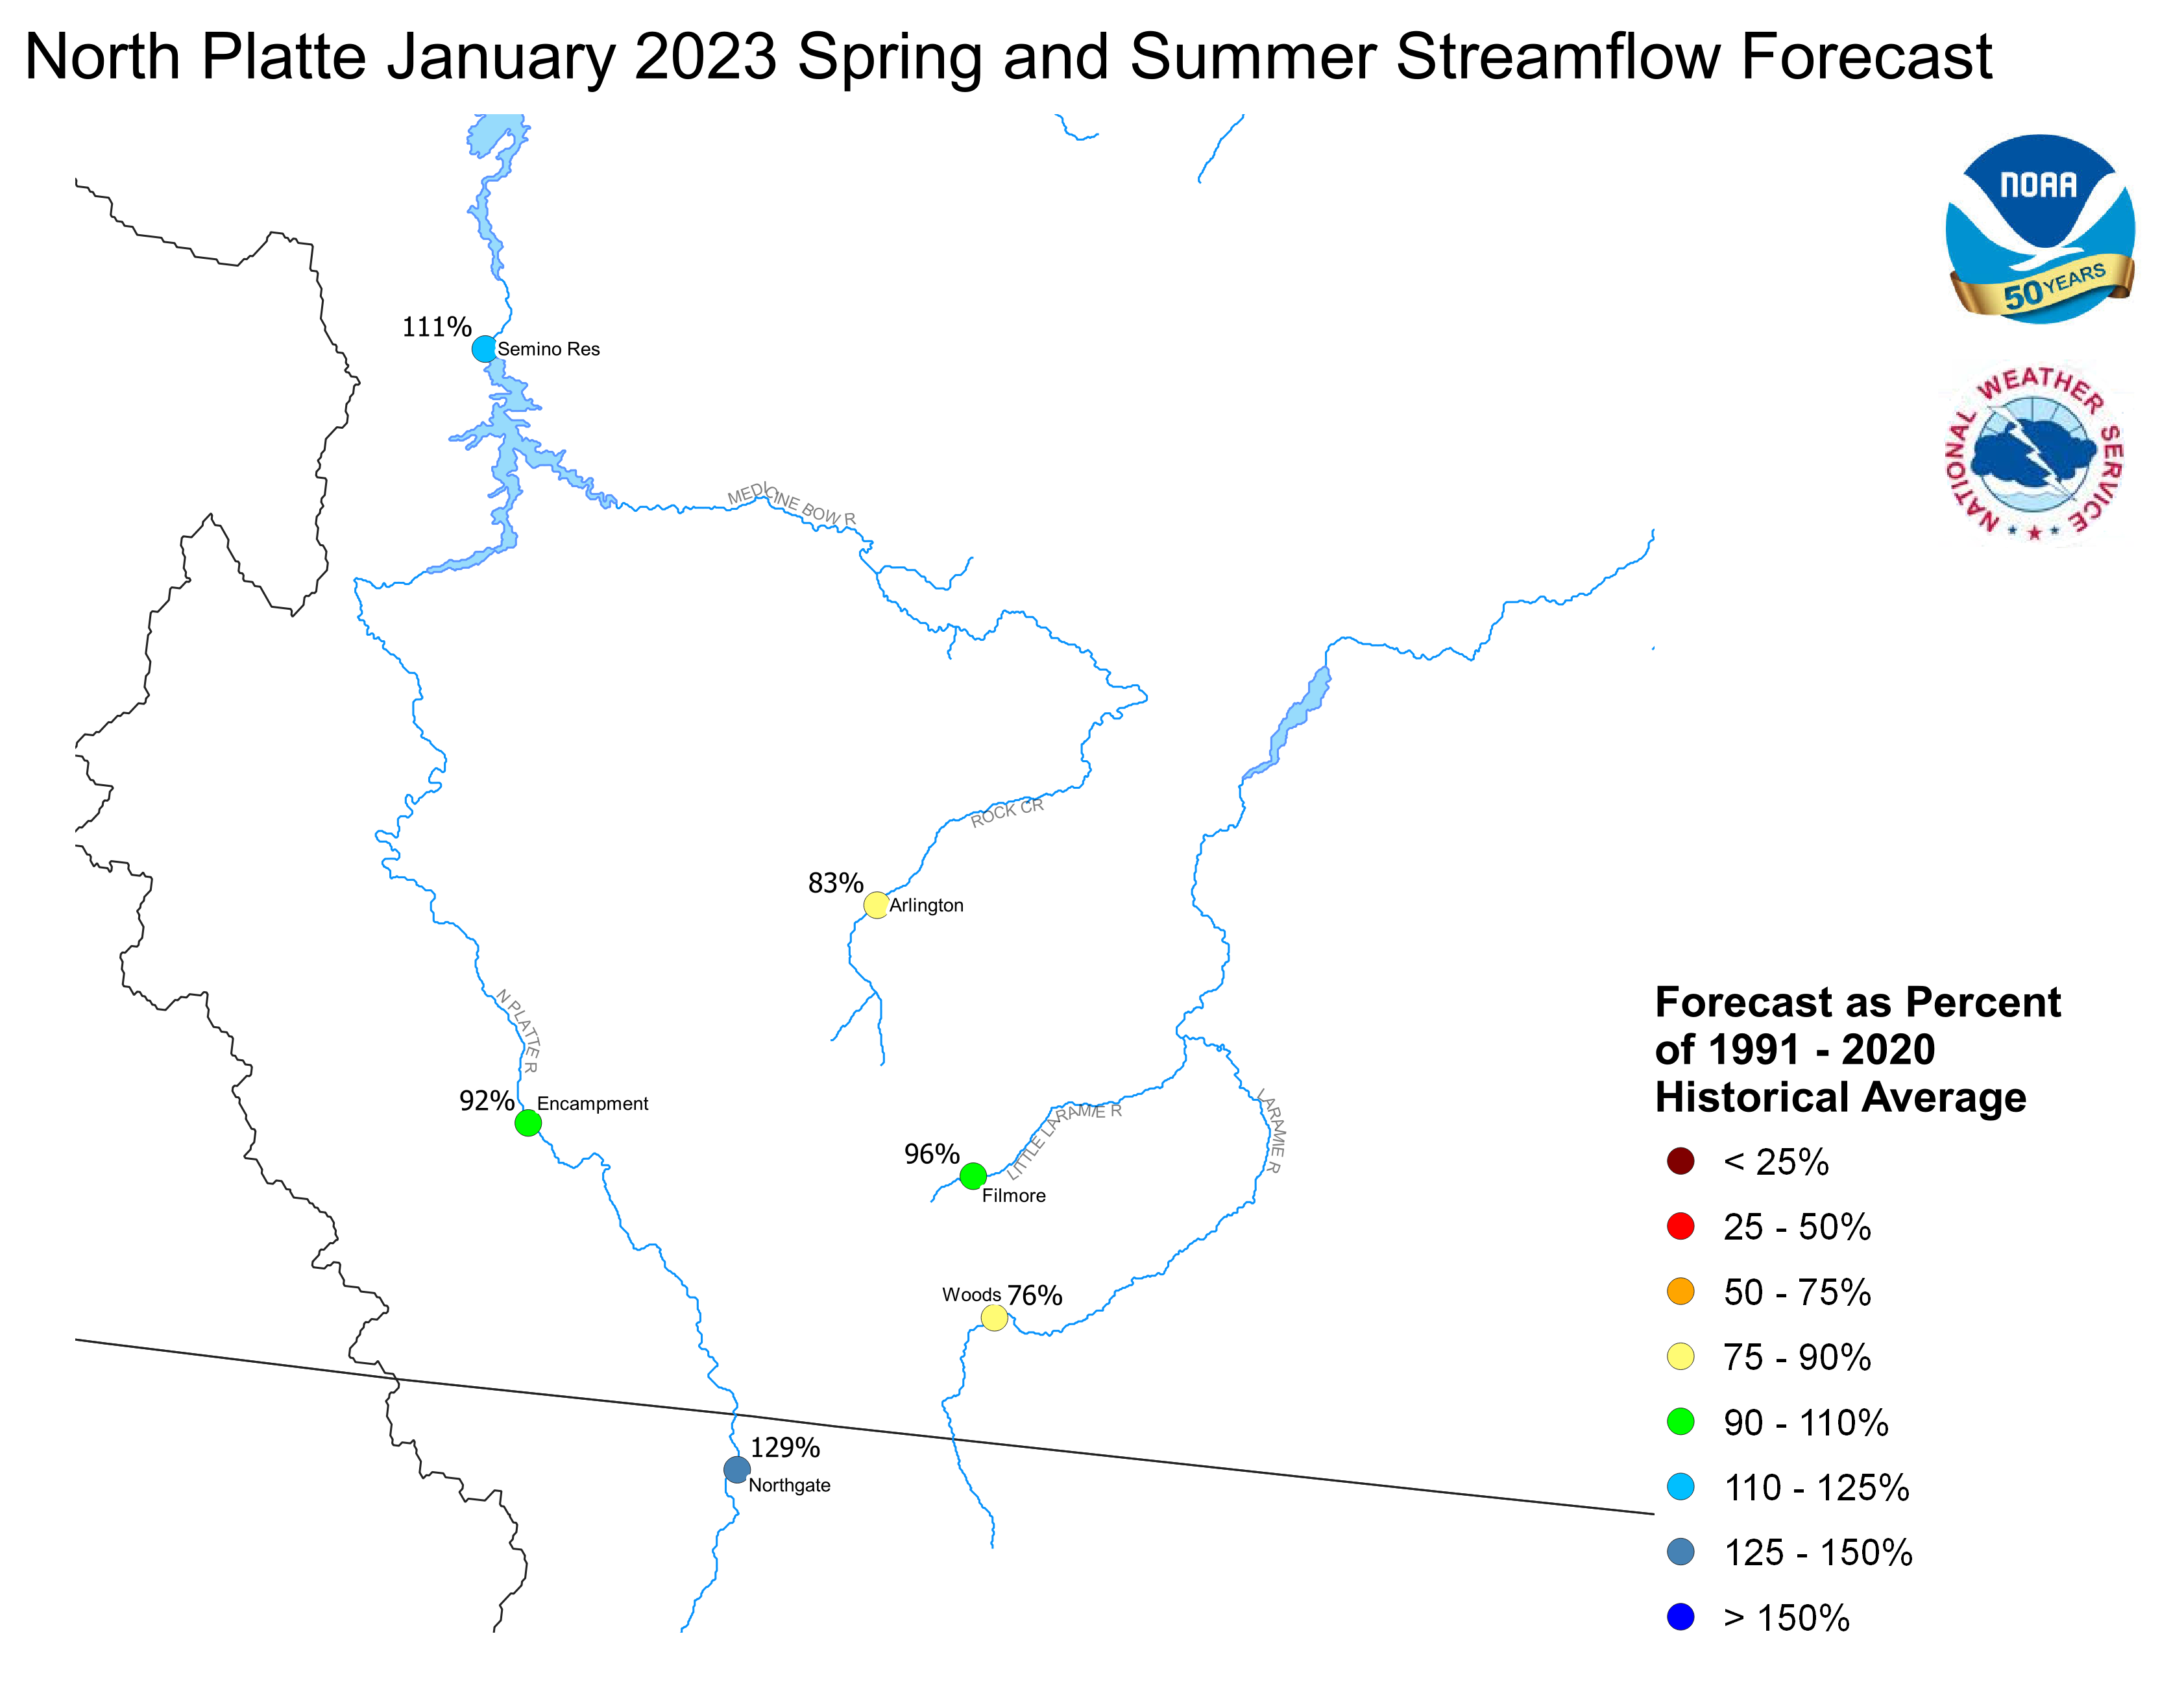
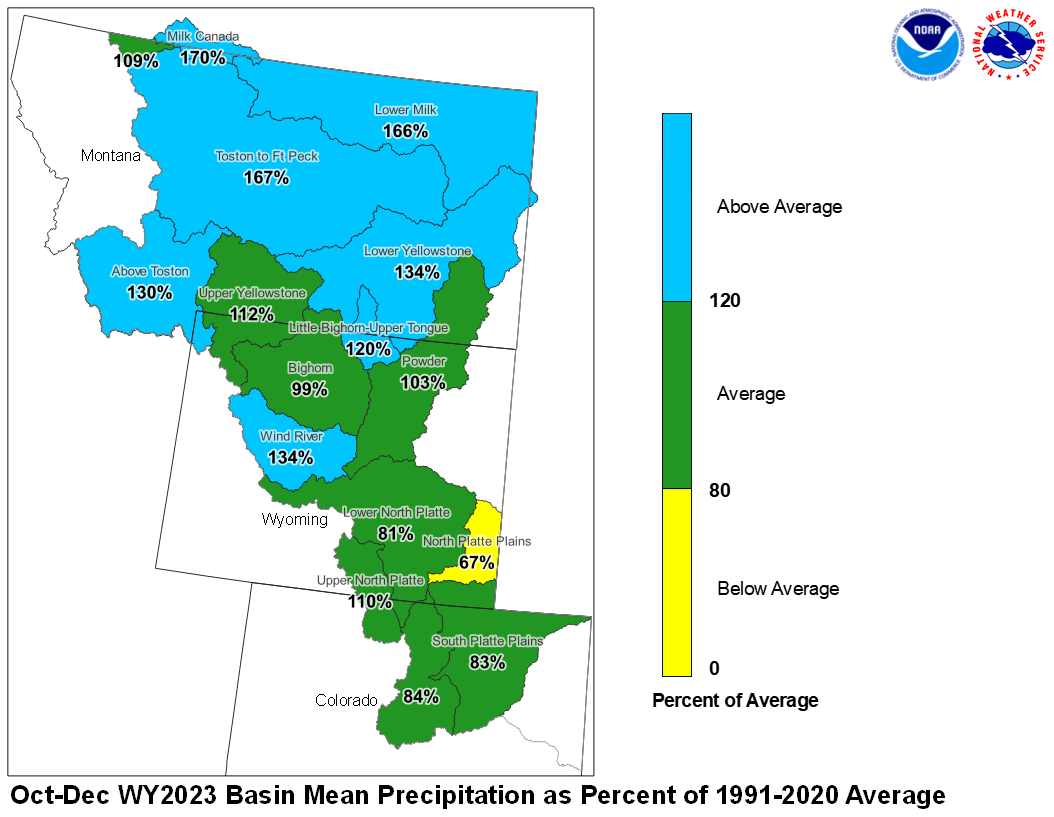
Platte Basin
The high elevation snow pack in the Upper North Platte Basin was
121 percent of average on January 1. The snow pack in the North Platte
Basin below Seminoe Reservoir was 93 percent of average. The snow
pack in the South Platte Basin was 85 percent of average.
Precipitation during December in the Upper North Platte Basin was 166
percent of average. In the Lower North Platte Basin, precipitation
was 120 percent of average. The North Platte Plains below Guernsy
Reservoir had 114 percent. The South Platte Mountains had 132
percent whereas the Plains had 212 percent of average December
precipitation.
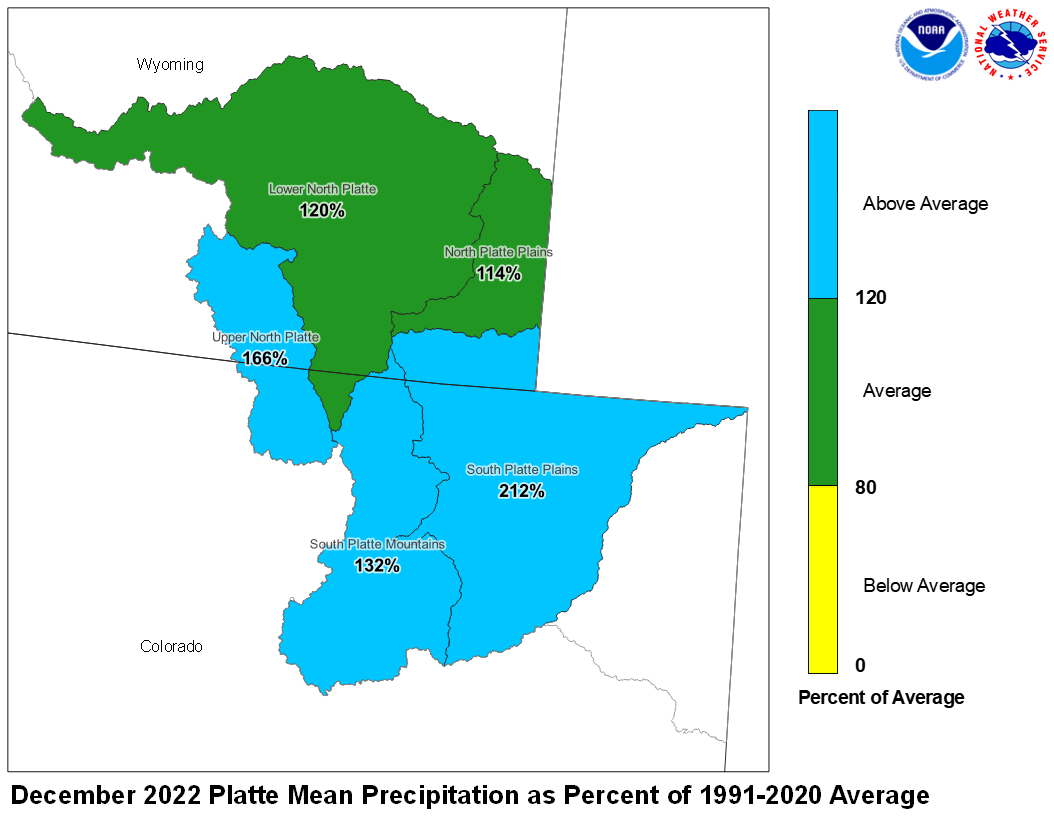
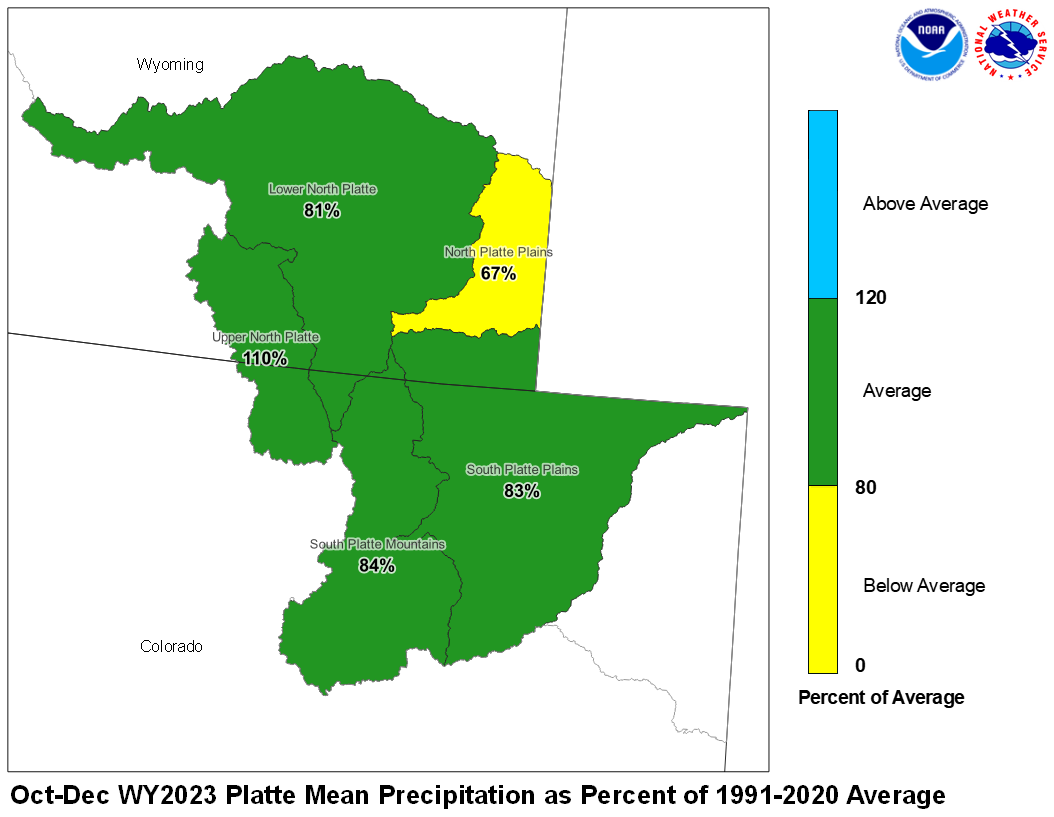
December 2022 Platte Mean Precip Oct-Dec WY2023 Platte Mean Precip
Stream flow in the Platte Basin is forecast to be below
average during the upcoming Spring and Summer. Runoff
for streams above Seminoe Reservoir are expected to be
about 98 percent of average. Streams in the South Platte
Basin above South Platte, Colorado can expect 81 percent
of average flow. For the remainder of the South Platte
basin, flows are expected near 90 percent.
Stored water in the South Platte Basin was 84 percent of average
on January 1.
North Platte Streamflow Fcst South Platte Streamflow Fcst
WATER SUPPLY FORECAST
NWS MISSOURI BASIN RIVER FORECAST CENTER
PLEASANT HILL MISSOURI

0932 CST WEDNESDAY JANUARY 04, 2023

DATA CURRENT AS OF: JANUARY 01, 2023

MISSOURI/YELLOWSTONE/PLATTE RIVER BASIN FORECASTS


                                          50%   %   10%   90%   AVG
FORECAST POINT                   PERIOD  (KAF) AVG (KAF) (KAF) (KAF)
--------------------------------------------------------------------

Boysen Resvr Inflow              Apr-Sep  599   83  1259  278    720
 SBDW4

Boysen Resvr Inflow              Apr-Sep 1089  122  1809  669    890
 SBDW4N

Bighorn R at Kane                Apr-Sep 1087  110  1887  635    985
 LVEW4

Bighorn R at Kane                Apr-Sep 1792  124  2685 1142   1440
 LVEW4N

Greybull R at Meeteetse          Apr-Sep  192   98   279   94    196
 MEEW4

Greybull R at Meeteetse          Apr-Sep  192   94   279   94    205
 MEEW4N

Buffalo Bill Resvr Inflow        Apr-Sep  563   69   906  367    815
 CDYW4

Buffalo Bill Resvr Inflow        Apr-Sep  650   71  1000  442    910
 CDYW4N

St. Mary R nr Babb               Apr-Sep  299   65   407  243    460
 SMYM8

St. Mary R nr Babb               Apr-Sep  308   58   418  251    535
 SMYM8N

St. Mary R at Intl Boundary      Apr-Sep  226   58   366  159    390
 SMBM8

St. Mary R at Intl Boundary      Apr-Sep  367   56   502  302    660
 SMBM8N

Milk R nr Western Crossing       Apr-Sep   19   17    53    8    113
 PDBM8

Milk R nr Western Crossing       Apr-Sep   29   71    70   14     41
 PDBM8N

Milk R nr Eastern Crossing       Apr-Sep  152   71   227  138    215
 ERNM8

Milk R nr Eastern Crossing       Apr-Sep   53   47   156   30    112
 ERNM8N

North Platte R nr Northgate      Apr-Sep  327  133   536  138    245
 NGTC2

North Platte R nr Northgate      Apr-Sep  380  129   588  185    295
 NGTC2N

Encampment R nr Encampment       Apr-Sep  142   91   195   93    156
 ECRW4

Encampment R nr Encampment       Apr-Sep  153   92   206  104    166
 ECRW4N

Rock Cr nr Arlington             Apr-Sep   43   81    60   29     53
 KCRW4

Rock Cr nr Arlington             Apr-Sep   44   83    61   30     53
 KCRW4N

Seminoe Resvr Inflow             Apr-Sep  860  112  1214  410    765
 SETW4

Seminoe Resvr Inflow             Apr-Sep 1022  111  1380  561    920
 SETW4N

Laramie R nr Woods Landing       Apr-Sep   73   68   142   28    108
 WODW4

Laramie R nr Woods Landing       Apr-Sep  108   76   177   60    142
 WODW4N

Little Laramie R nr Filmore      Apr-Sep   53   96    94   32     55
 SMTW4

Little Laramie R nr Filmore      Apr-Sep   55   96    96   34     57
 SMTW4N

Antero Resvr Inflow              Apr-Sep   11   79    18    6     14
 ANRC2

Antero Resvr Inflow              Apr-Sep   11   79    18    6     14
 ANRC2N

Spinney Mountain Resvr Inflow    Apr-Sep   41   72    86   30     57
 SPYC2

Spinney Mountain Resvr Inflow    Apr-Sep   37   82    82   17     45
 SPYC2N

Elevenmile Canyon Resvr Inflow   Apr-Sep   37   63    59   33     59
 EVNC2

Elevenmile Canyon Resvr Inflow   Apr-Sep   40   80    88   19     50
 EVNC2N

Cheesman Lk Inflow               Apr-Sep   70   70   122   48    100
 CHEC2

Cheesman Lk Inflow               Apr-Sep   77   83   157   44     93
 CHEC2N

S Platte R at S Platte           Apr-Sep  336  140   427  300    240
 SPTC2

S Platte R at S Platte           Apr-Sep  157   77   266   86    205
 SPTC2N

Bear Cr at Morrison              Apr-Sep   17   65    33    9     26
 MRRC2

Bear Cr at Morrison              Apr-Sep   17   65    33    9     26
 MRRC2N

Clear Cr at Golden               Apr-Sep   93   79   136   52    118
 GLDC2

Clear Cr at Golden               Apr-Sep  106   81   150   60    131
 GLDC2N

St. Vrain Cr at Lyons            Apr-Sep   73   92   104   49     79
 LNSC2

St. Vrain Cr at Lyons            Apr-Sep  103   94   141   70    109
 LNSC2N

Boulder Cr nr Orodell            Apr-Sep   38   81    59   25     47
 OROC2

Boulder Cr nr Orodell            Apr-Sep   53  102    77   36     52
 OROC2N

S Boulder Cr nr Eldorado Sprgs   Apr-Sep   37  106    48   23     35
 BELC2

S Boulder Cr nr Eldorado Sprgs   Apr-Sep   39   98    58   23     40
 BELC2N

Cache La Poudre at Canyon Mouth  Apr-Sep  197  182   302  101    108
 FTDC2

Cache La Poudre at Canyon Mouth  Apr-Sep  236  112   345  123    210
 FTDC2N

Lima Resvr Inflow                Apr-Sep   68   89   101   37     76
 LRRM8

Lima Resvr Inflow                Apr-Sep   68   86   101   37     79
 LRRM8N

Clark Canyon Resvr Inflow        Apr-Sep   62   56   104   47    110
 CLKM8

Clark Canyon Resvr Inflow        Apr-Sep  155   78   217   95    198
 CLKM8N

Beaverhead R at Barretts         Apr-Sep  155   78   196  140    199
 BARM8

Beaverhead R at Barretts         Apr-Sep  188   67   257  121    280
 BARM8N

Ruby R Resvr Inflow              Apr-Sep   92  105   113   67     88
 ALRM8

Ruby R Resvr Inflow              Apr-Sep   92   95   113   67     97
 ALRM8N

Big Hole R nr Melrose            Apr-Sep  495   83   691  314    595
 MLRM8

Big Hole R nr Melrose            Apr-Sep  560   85   758  384    660
 MLRM8N

Hebgen Resvr Inflow              Apr-Sep  522  112   650  381    465
 HBDM8

Hebgen Resvr Inflow              Apr-Sep  522  112   650  381    465
 HBDM8N

Ennis Resvr Inflow               Apr-Sep  784  110   972  610    715
 ELMM8

Ennis Resvr Inflow               Apr-Sep  865  118  1058  643    730
 ELMM8N

Gallatin R nr Gateway            Apr-Sep  381   80   469  288    475
 GLGM8

Gallatin R nr Gateway            Apr-Sep  381   80   469  288    475
 GLGM8N

Gallatin R at Logan              Apr-Sep  373   74   525  231    505
 LOGM8

Gallatin R at Logan              Apr-Sep  526   81   670  376    650
 LOGM8N

Missouri R at Toston             Apr-Sep 1957   95  2657 1240   2060
 TOSM8

Missouri R at Toston             Apr-Sep 2709   96  3443 1912   2830
 TOSM8N

Missouri R at Fort Benton        Apr-Sep 2096   68  2933 1659   3060
 FBNM8

Missouri R at Fort Benton        Apr-Sep 3836   94  4835 2803   4100
 FBNM8N

Missouri R nr Virgelle           Apr-Sep 2254   66  3180 1781   3420
 VRGM8

Missouri R nr Virgelle           Apr-Sep 4439   97  5528 3234   4560
 VRGM8N

Missouri R nr Landusky           Apr-Sep 2434   66  3397 1884   3680
 LDKM8

Missouri R nr Landusky           Apr-Sep 4653   95  5803 3373   4890
 LDKM8N

Missouri R below Fort Peck Dam   Apr-Sep 2613   68  3588 1990   3840
 FPKM8

Missouri R below Fort Peck Dam   Apr-Sep 4903   95  6061 3512   5180
 FPKM8N

Gibson Resvr Inflow              Apr-Sep  344   76   570  249    450
 AGSM8

Gibson Resvr Inflow              Apr-Sep  344   76   570  249    450
 AGSM8N

Marias R nr Shelby               Apr-Sep  336   77   641  192    435
 SHLM8

Marias R nr Shelby               Apr-Sep  396   81   701  237    490
 SHLM8N

Musselshell R at Harlowton       Apr-Sep   43   54    83   23     80
 HLWM8

Musselshell R at Harlowton       Apr-Sep   53   56    94   32     95
 HLWM8N

Yellowstone R at Yellowstone Lk  Apr-Sep  637   78   787  443    815
 YLOW4

Yellowstone R at Yellowstone Lk  Apr-Sep  851  101  1044  595    840
 YLOW4N

Yellowstone R at Corwin Sprgs    Apr-Sep 1586   80  2023 1107   1980
 CORM8

Yellowstone R at Corwin Sprgs    Apr-Sep 1891   91  2372 1361   2070
 CORM8N

Yellowstone R at Livingston      Apr-Sep 1819   79  2286 1305   2290
 LIVM8

Yellowstone R at Livingston      Apr-Sep 2185   90  2699 1611   2440
 LIVM8N

Yellowstone R at Billings        Apr-Sep 2642   65  3647 1824   4070
 BILM8

Yellowstone R at Billings        Apr-Sep 3632   76  4743 2732   4790
 BILM8N

Yellowstone R at Miles City      Apr-Sep 4102   70  7216 2984   5850
 MILM8

Yellowstone R at Miles City      Apr-Sep 6489   84  9698 4960   7690
 MILM8N

Yellowstone R at Sidney          Apr-Sep 4079   71  7317 2913   5710
 SIDM8

Yellowstone R at Sidney          Apr-Sep 6767   84 10410 5065   8060
 SIDM8N

Boulder R at Big Timber          Apr-Sep  218   65   285  148    335
 BTMM8

Boulder R at Big Timber          Apr-Sep  259   69   327  191    375
 BTMM8N

Stillwater R nr Absarokee        Apr-Sep  384   71   473  268    540
 SRAM8

Stillwater R nr Absarokee        Apr-Sep  438   74   532  327    595
 SRAM8N

Clks Fk Yellowstone R nr Belfry  Apr-Sep  416   67   642  285    620
 BFYM8

Clks Fk Yellowstone R nr Belfry  Apr-Sep  486   70   715  358    695
 BFYM8N

Bighorn R nr St. Xavier          Apr-Sep 1191   83  2070  860   1430
 STXM8

Bighorn R nr St. Xavier          Apr-Sep 2538  103  3640 1775   2460
 STXM8N

Little Bighorn R nr Hardin       Apr-Sep   93   73   272   56    127
 HRDM8

Little Bighorn R nr Hardin       Apr-Sep   93   73   272   56    127
 HRDM8N

Tongue R nr Dayton               Apr-Sep   60   62    80   41     96
 DAYW4

Tongue R nr Dayton               Apr-Sep   66   65    86   46    101
 DAYW4N

Tongue R nr Decker               Apr-Sep  123   52   204   55    235
 DSLM8

Tongue R nr Decker               Apr-Sep  170   71   254   98    240
 DSLM8N

Tongue R Resvr Inflow            Apr-Sep  126   54   215   56    235
 DKRM8

Tongue R Resvr Inflow            Apr-Sep  172   70   265   99    245
 DKRM8N

Powder R at Moorhead             Apr-Sep  128   57   309   48    225
 MHDM8

Powder R at Moorhead             Apr-Sep  171   63   345   73    270
 MHDM8N

Powder R nr Locate               Apr-Sep  152   58   415   68    260
 LOCM8

Powder R nr Locate               Apr-Sep  197   65   451   91    305
 LOCM8N


Locations with an `N` suffix indicate natural flows excluding
stream augmentations.

KAF: Thousands of Acre-feet

%AVG: Current 50%/AVG

AVG: Average(50%) seasonal runoff voulme as simulated by the river
forecast model considering acontinuous simulation of the basin
response to historic climate data (observed precipitation and
temperatures) over the period of 1991-2020.

The 50%, 10% and 90% columns indicate the probability that the
actual volume will exceed the forecast for the valid time period.

Beginning April 1, May and June official forecasts include observed
runoff volume up to official forecast date.

For more information, please visit: www.weather.gov/mbrfc/water

