March 1, 2021 Spring and Summer Streamflow Forecasts
Upper Missouri Basin
The high elevation snow pack in the Upper Missouri Basin as of March 1
was near to above average. The snow pack in the St. Mary Basin was 103 percent, and the
Milk River Basin was 115 percent.
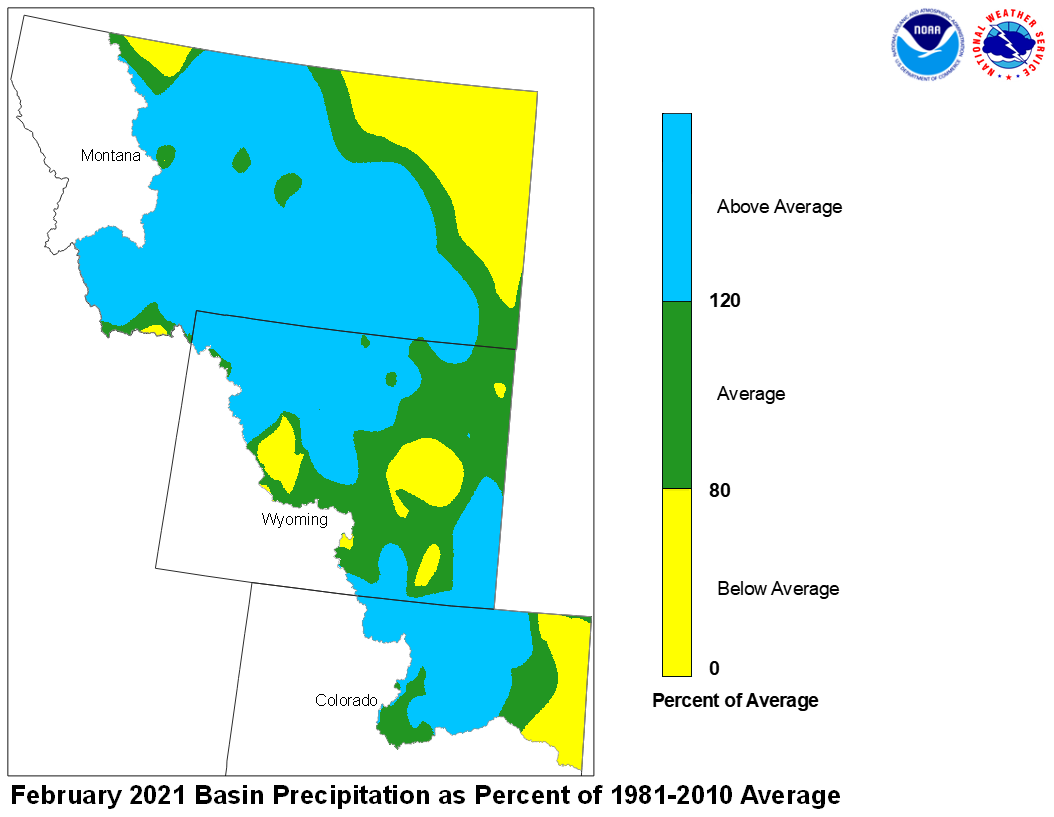
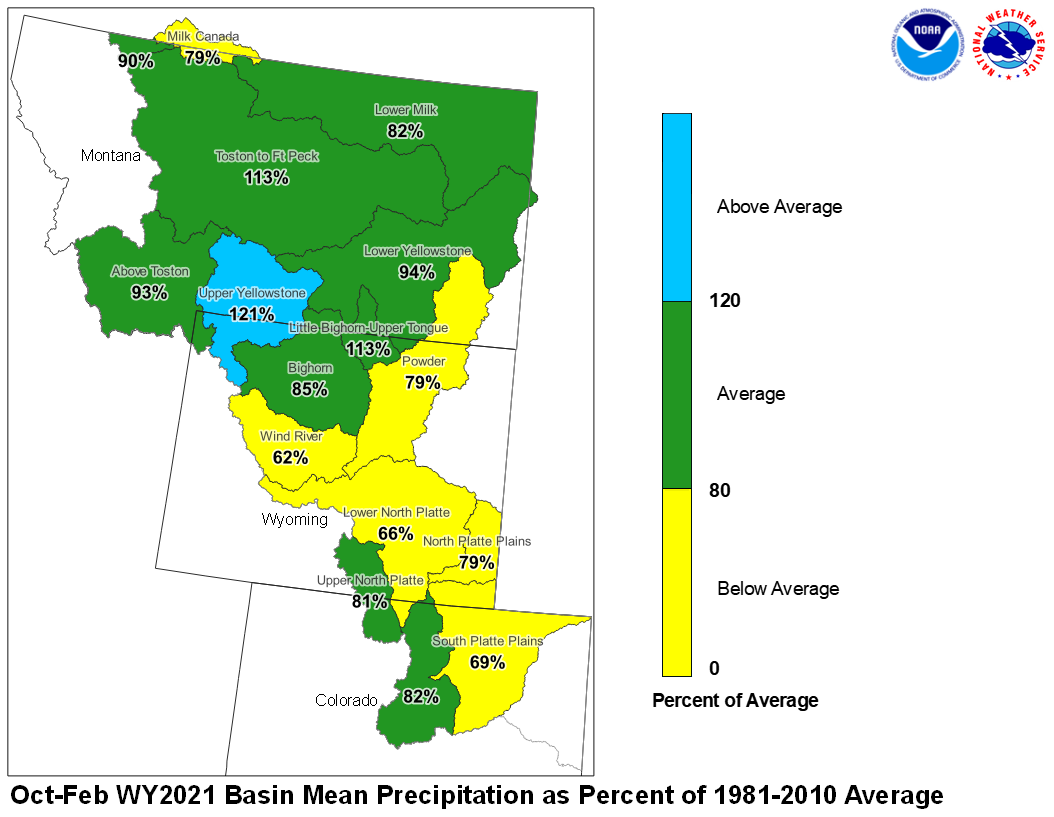
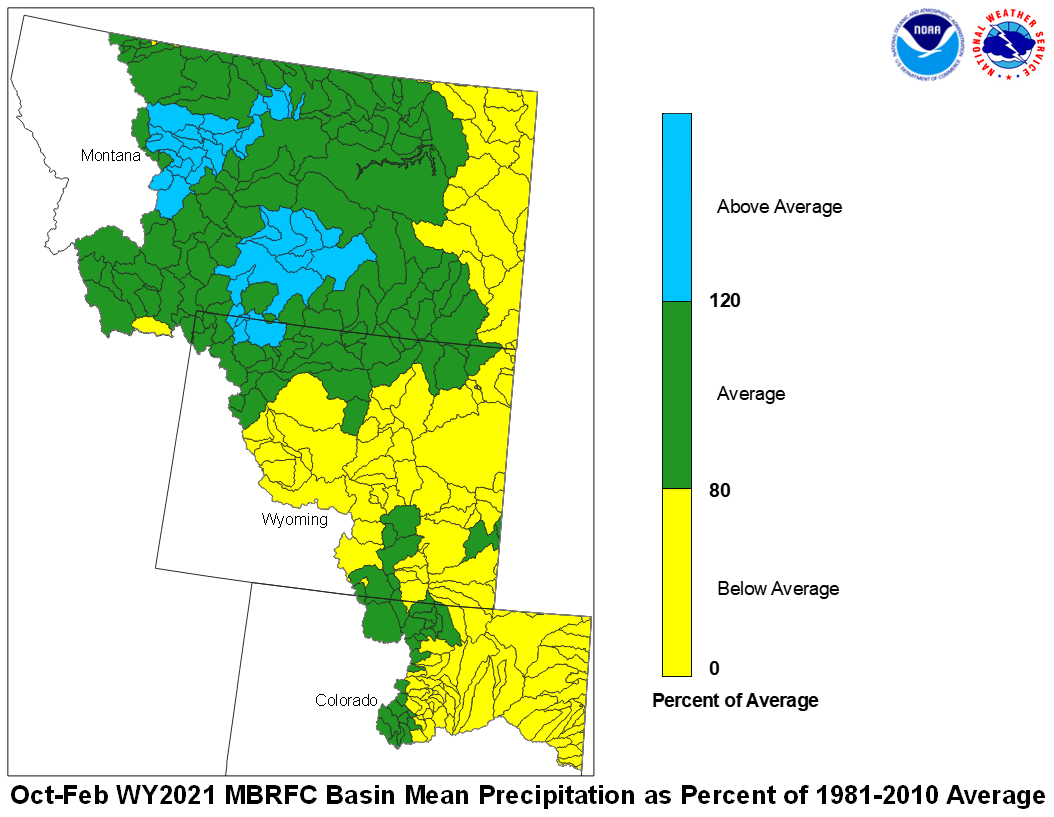
February precipitation across the Upper Missouri Basin was near to above average.
Basin precipitation summaries for the Missouri Basin include: Milk St. Mary,
79 percent; Milk Canada, 93 percent; Lower Milk, 78 percent; above Toston,
172 percent; Toston to Ft. Peck, 167 percent.
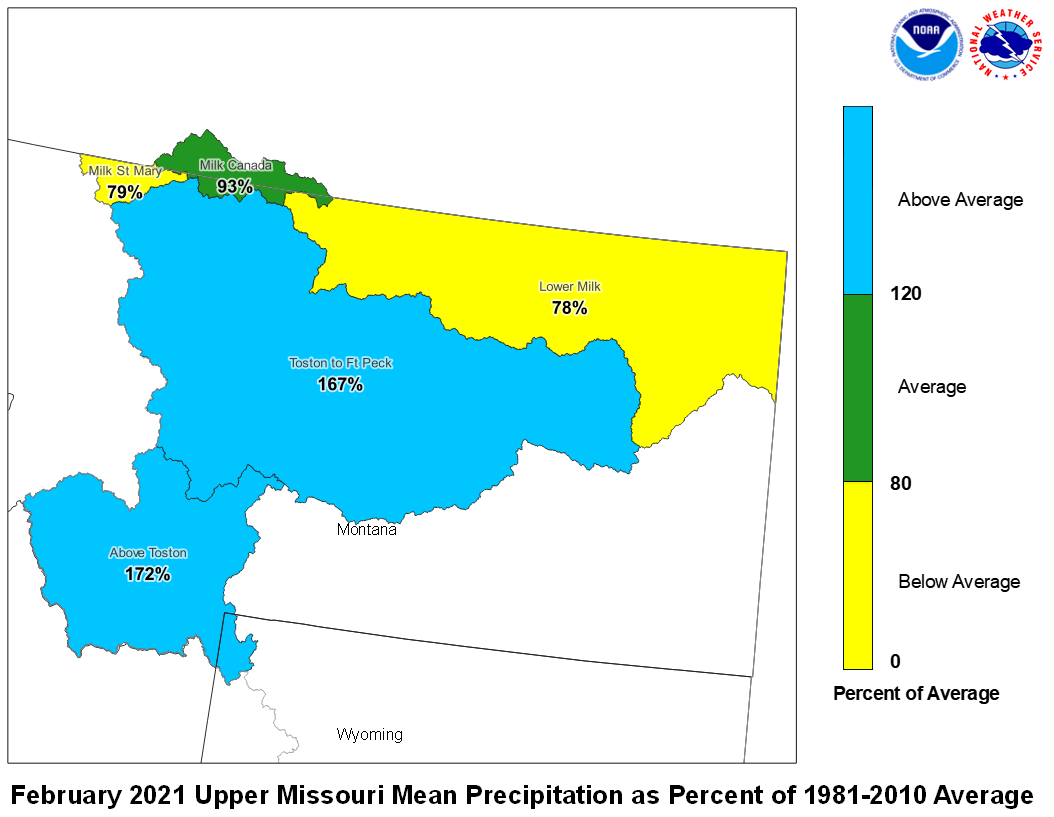
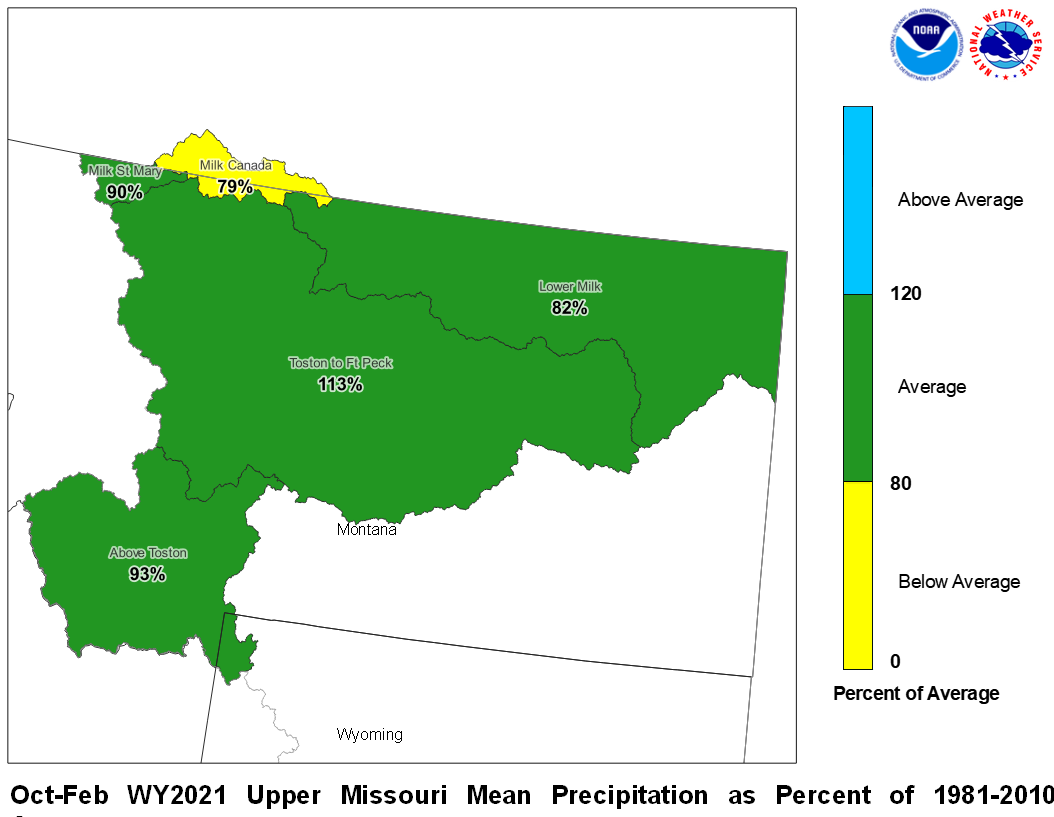
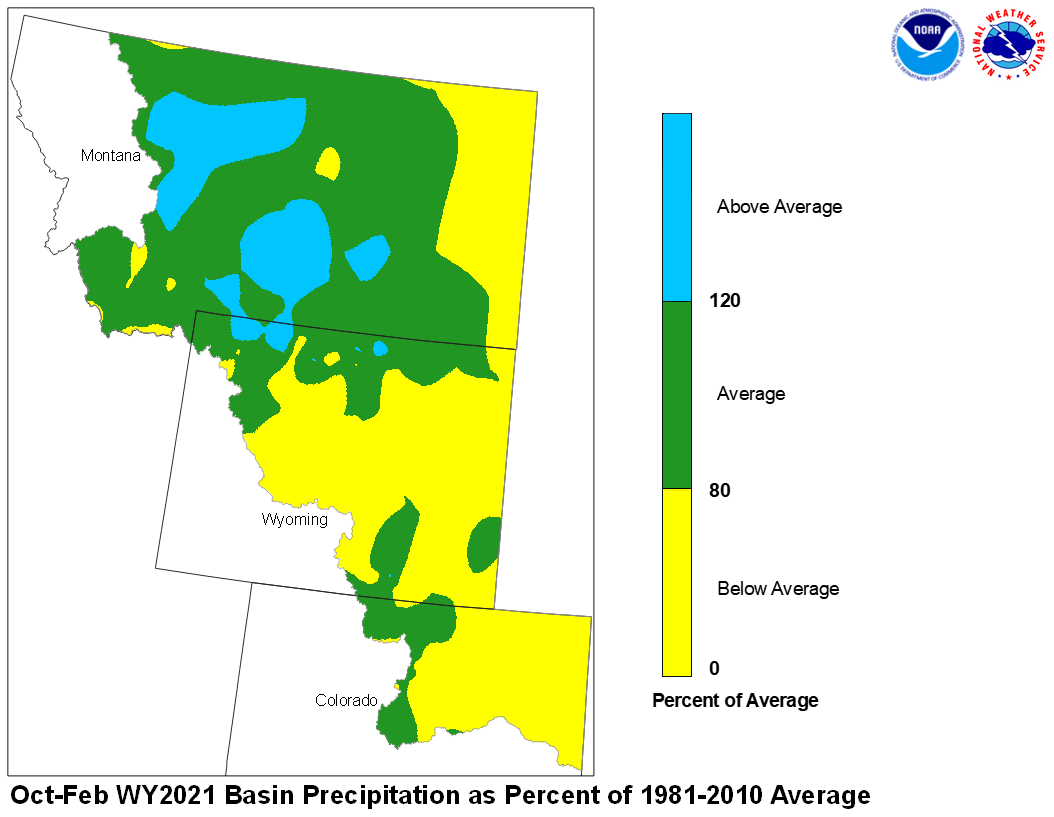
February 2021 Upper Missouri Mean Precip Oct-Feb WY2021 Upper Missouri Mean Precip
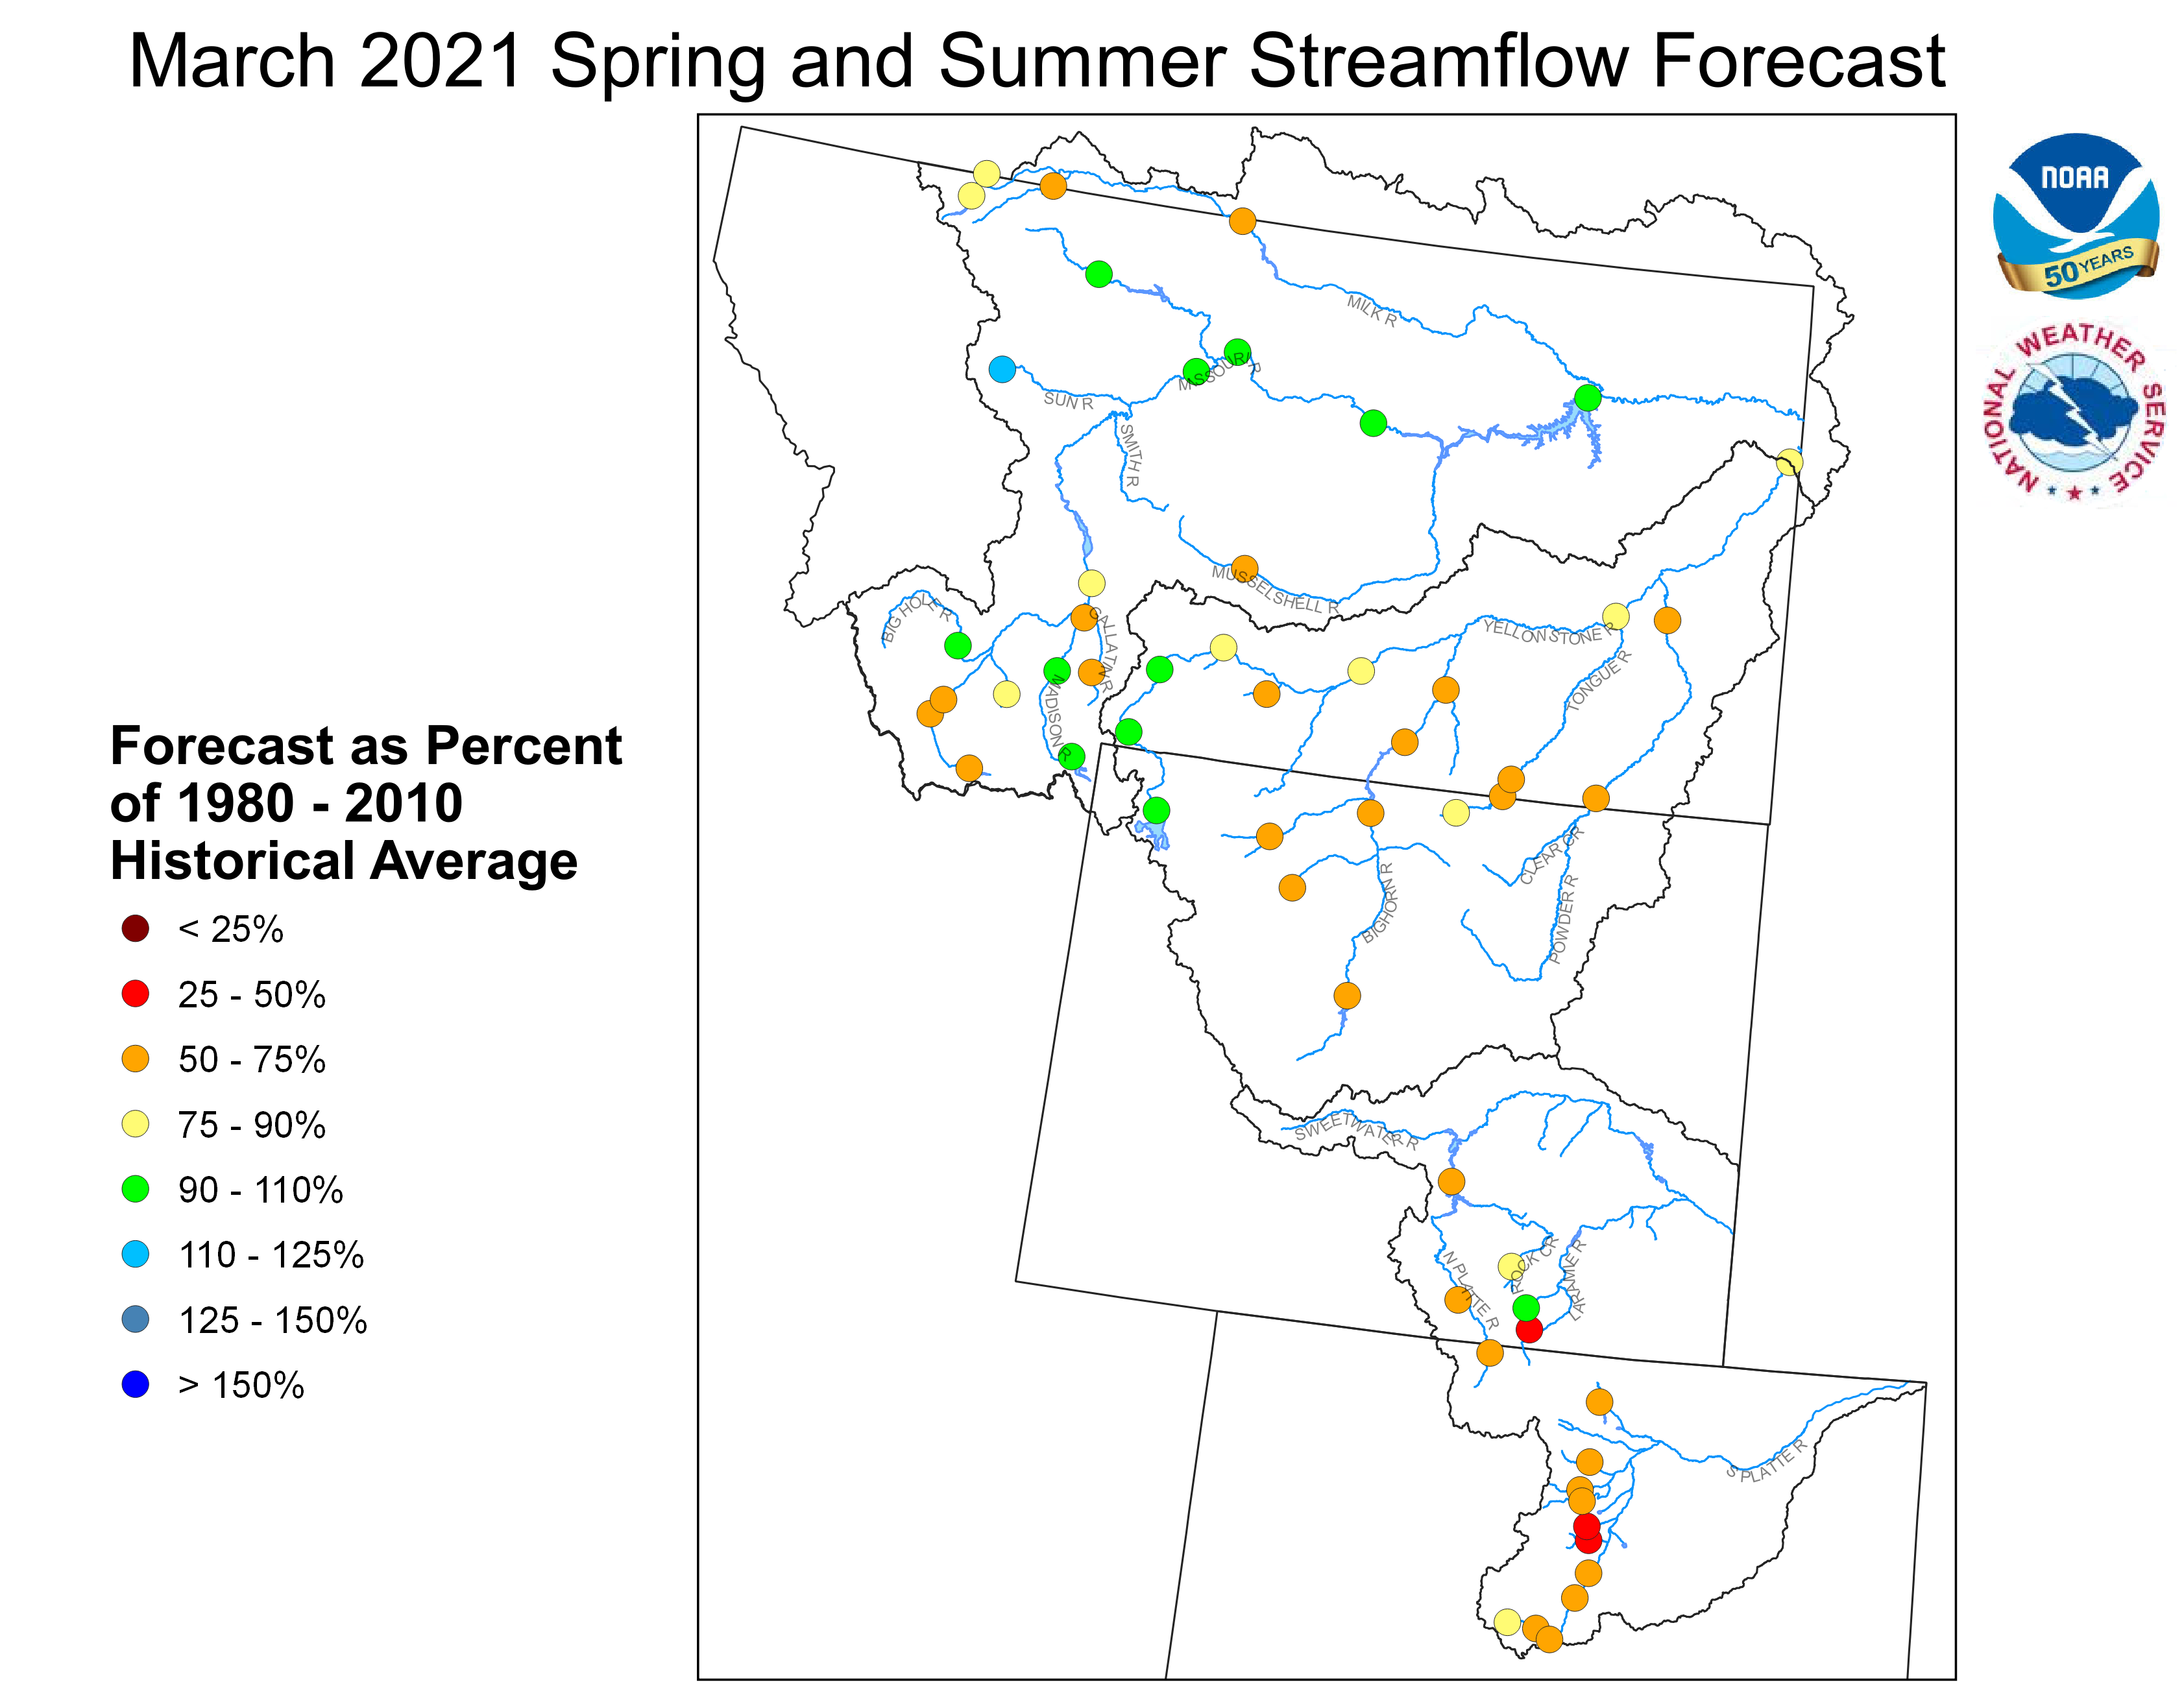
Stream flow in the Upper Missouri Basin is forecast to be
below average during the upcoming Spring and Summer.
The St. Mary River is forecast to have 75 percent of average
April-September flows. Runoff is expected to range around
93 percent of average for the Missouri Basin above Fort Peck,
Montana.
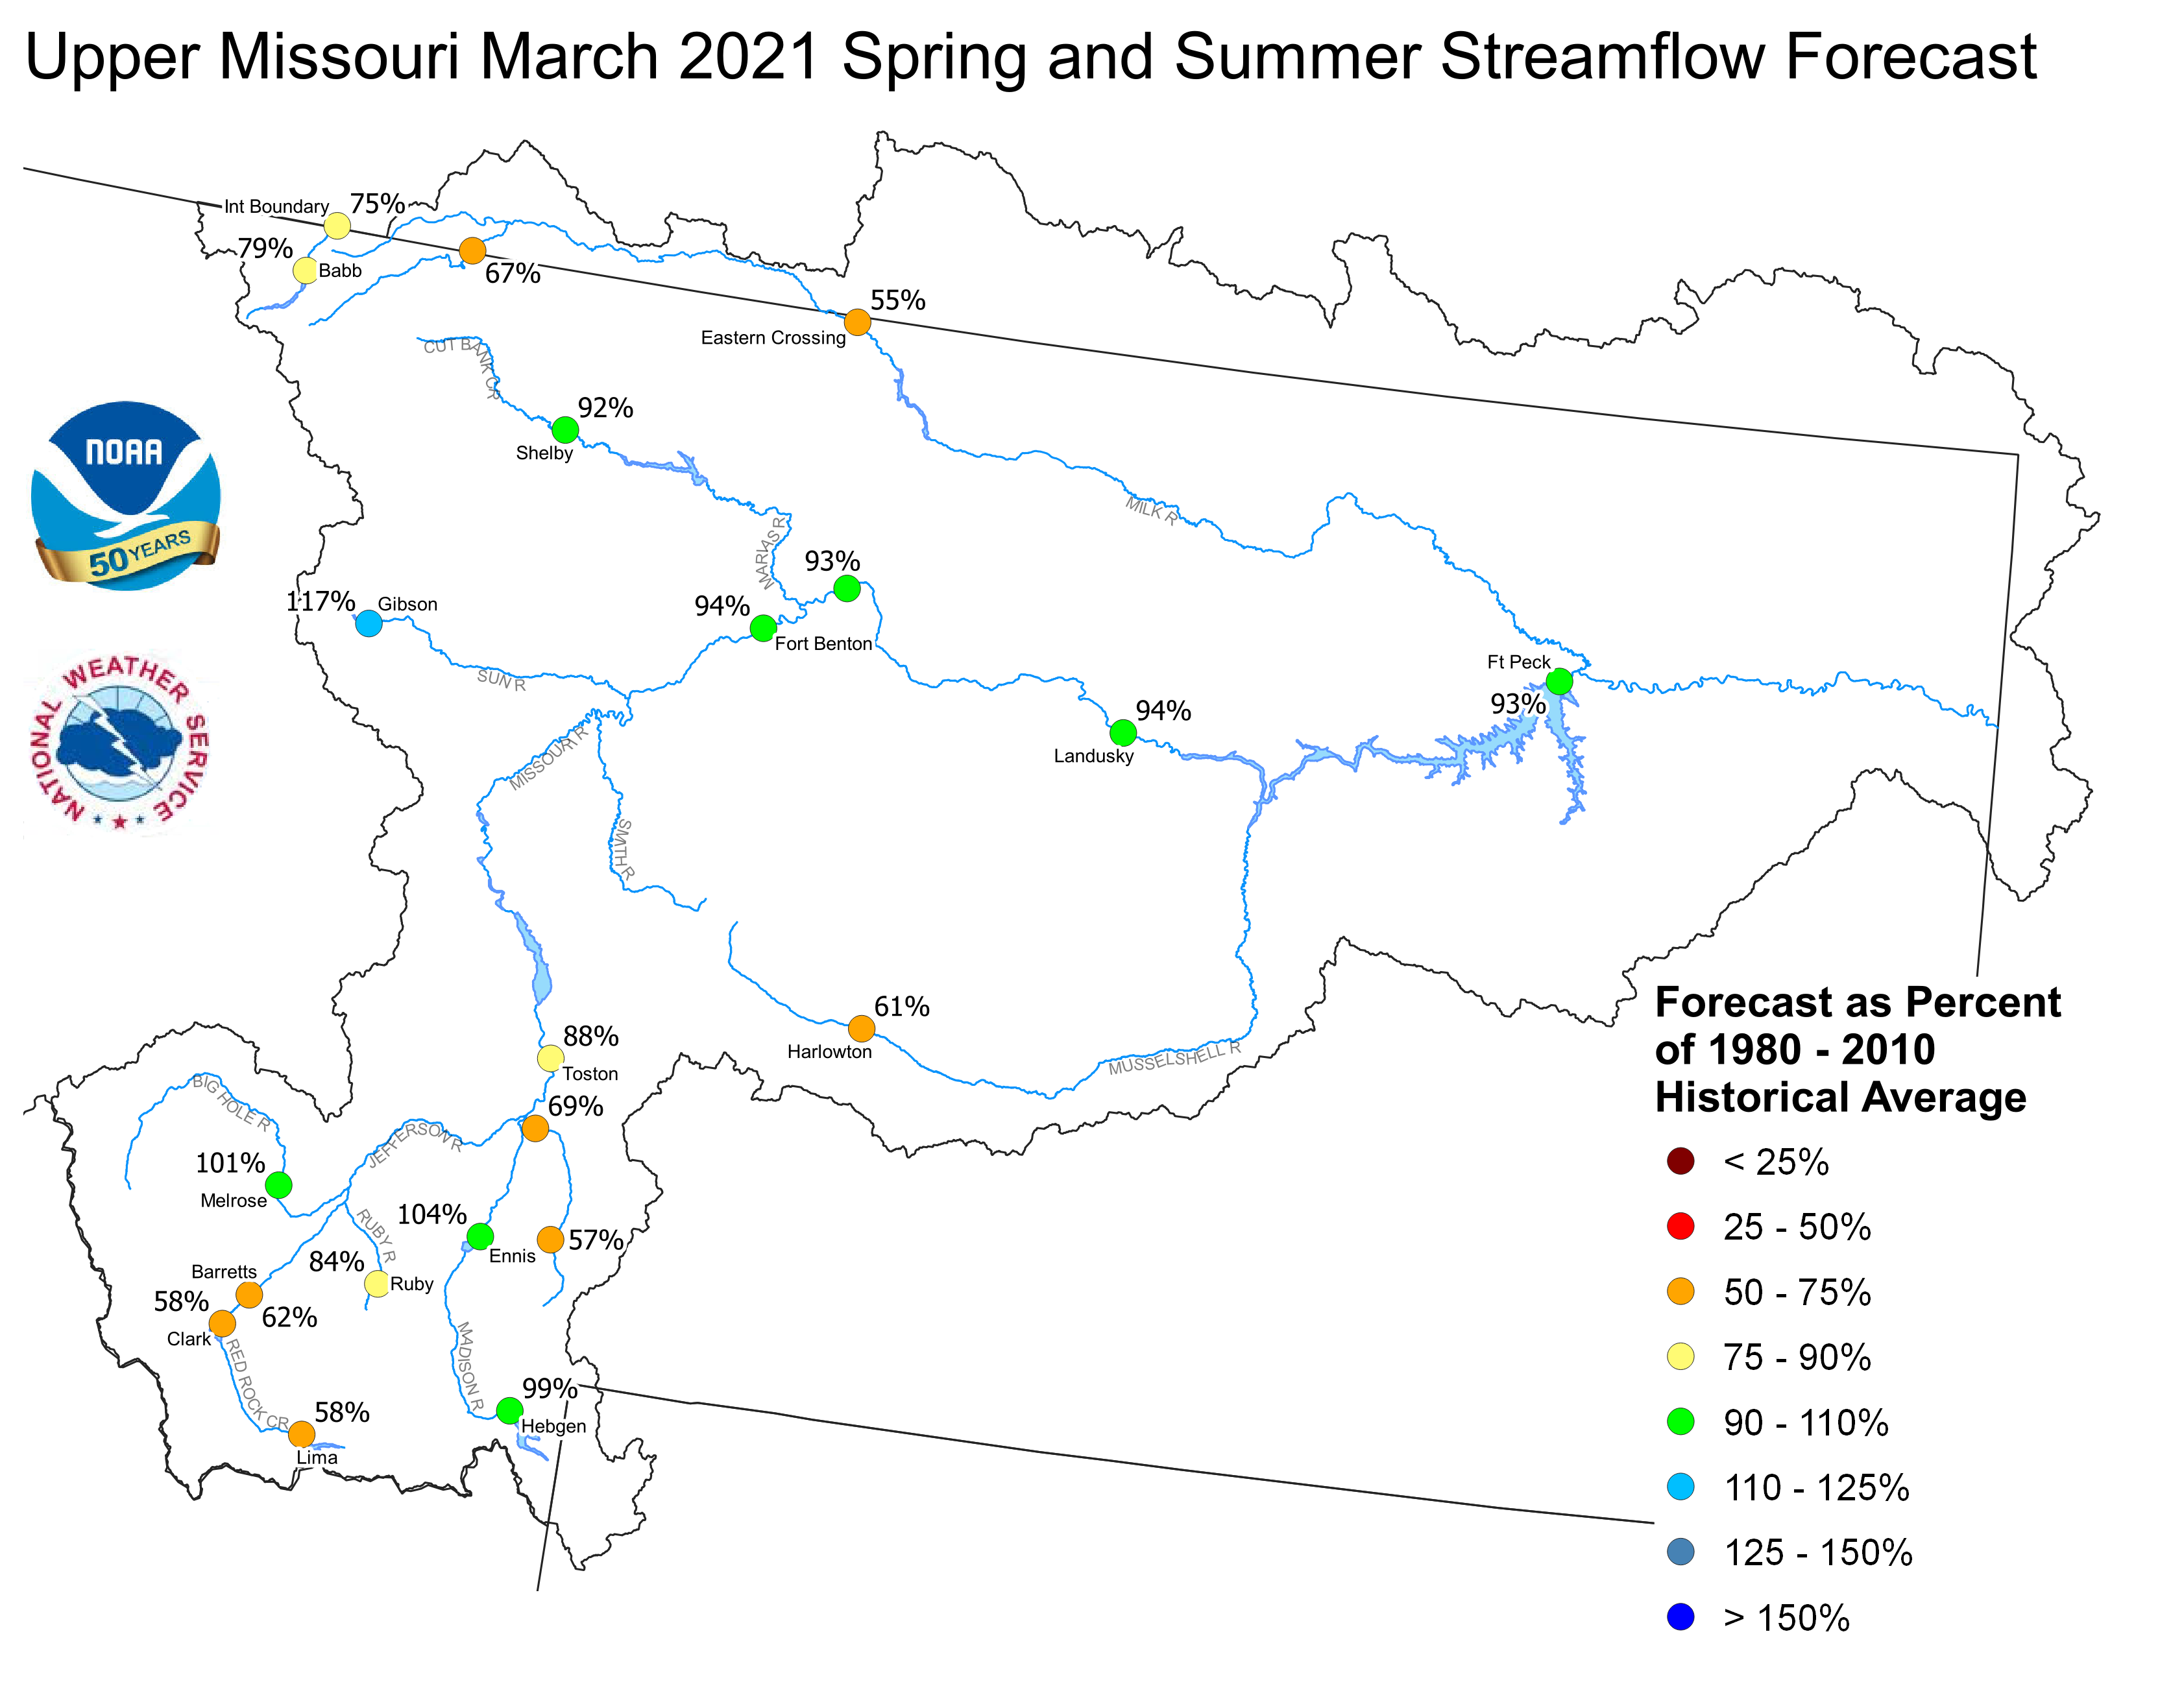
Upper Missouri March 1, 2021 Spring and Summer Streamflow Forecasts
Of the four major irrigation reservoirs in Montana; Lima
Reservoir had 133 percent average storage, Clark Canyon was
holding 106 percent of average water, Gibson Reservoir had 69
percent of average stored water, and Fresno Reservoir had
65 percent of average stored water.
Yellowstone Basin
The high elevation snow pack in the Yellowstone Basin was near average
on March 1. The snow pack in the Upper Yellowstone Basin was 110 percent
of average. The snow packs in the Wind, Bighorn, and Shoshone Basins were 79,
94, and 111 percent of average, respectively. The snow packs in the Tongue
and Powder basins were 99 and 98 percent of average, respectively.
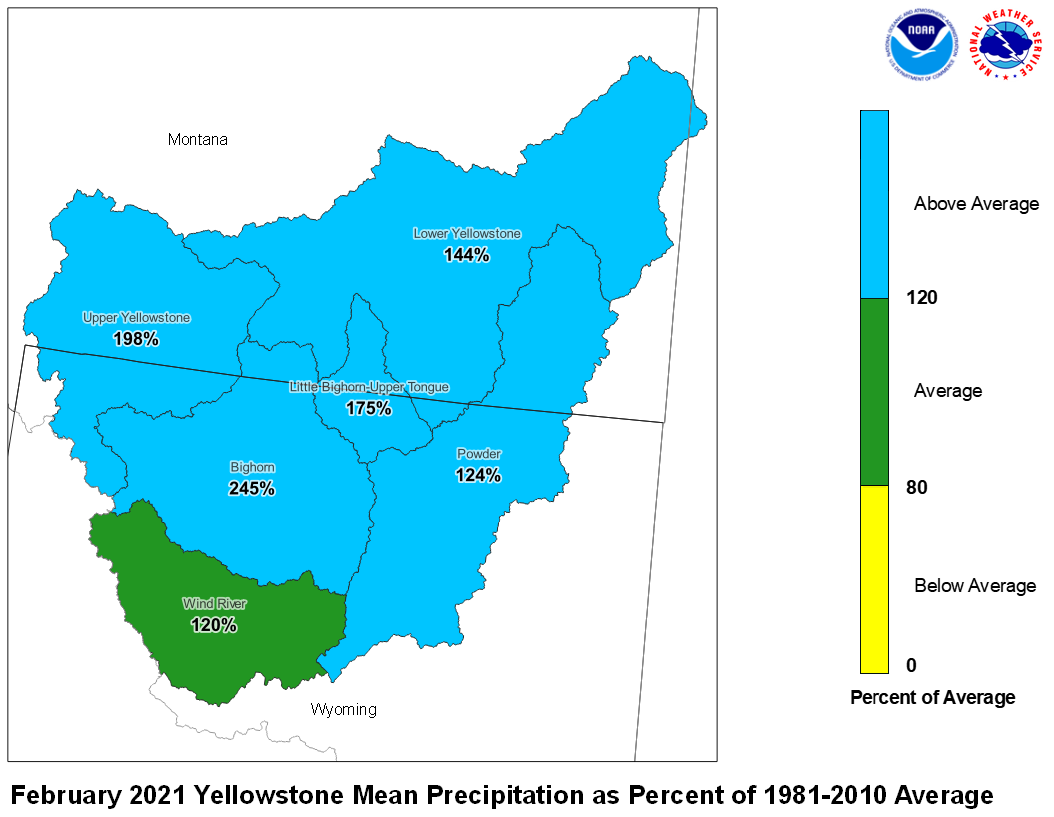
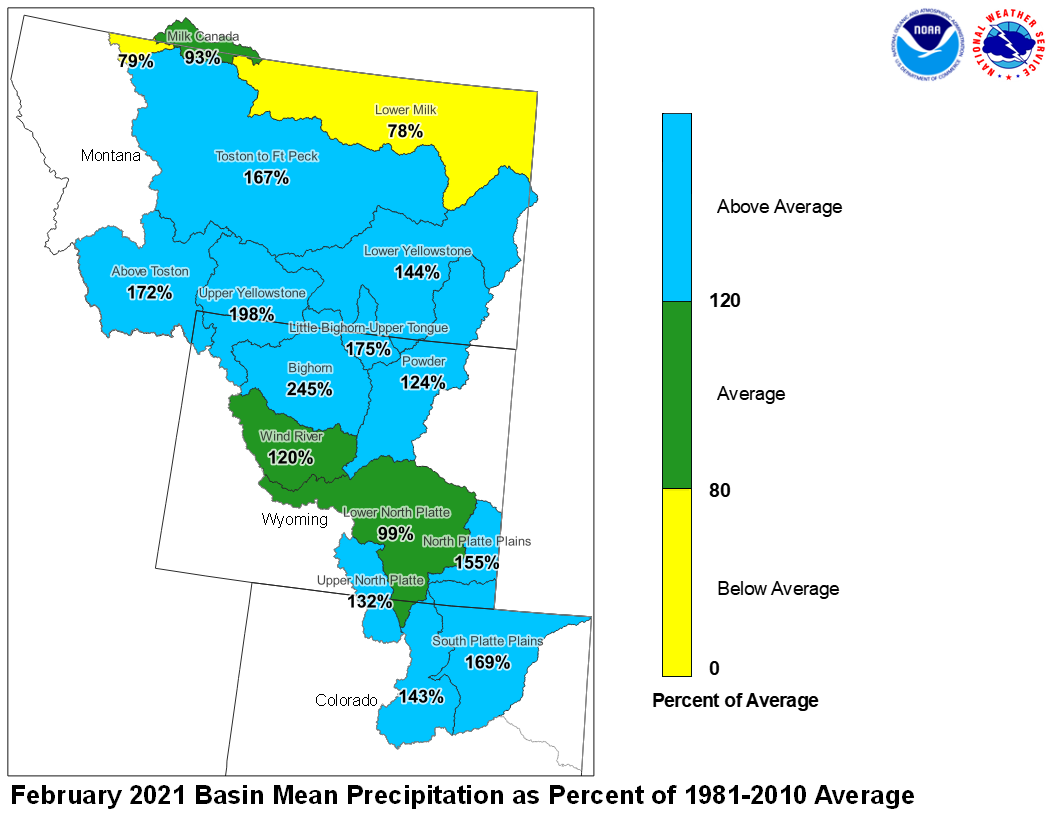
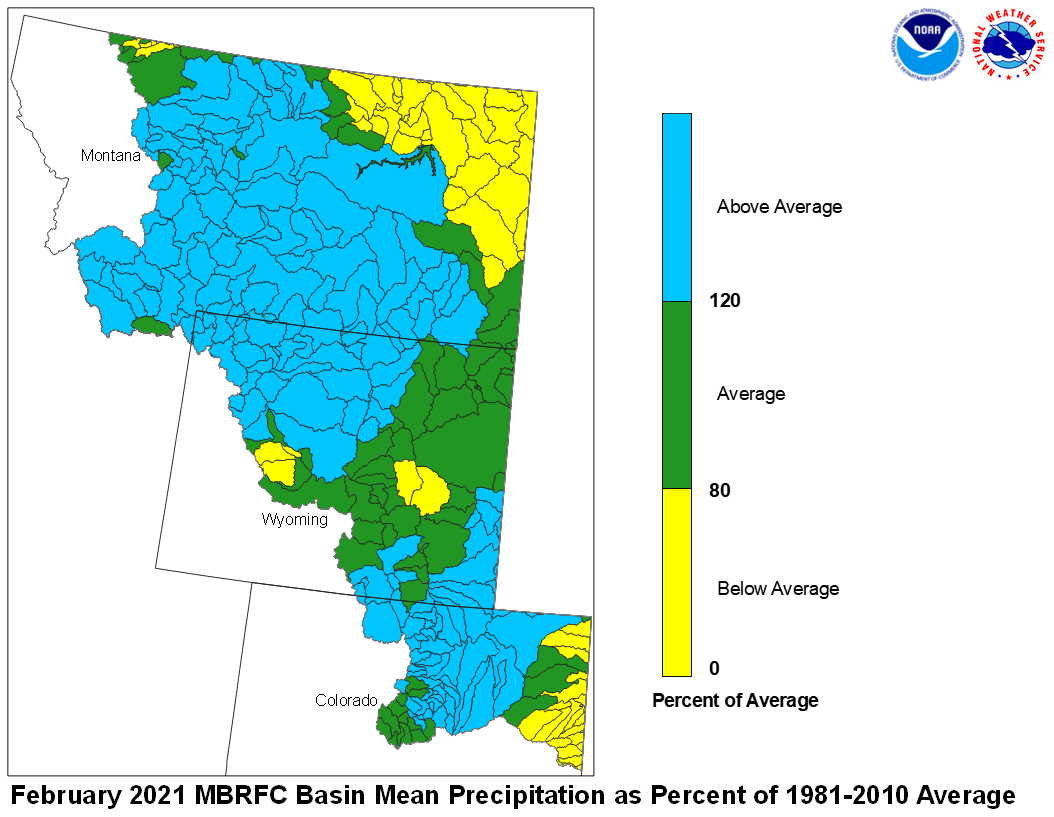
Precipitation during February was above average. The upper Yellowstone
River Basin received 198 percent of average precipitation while the
Lower Yellowstone River Basin reported 144 percent of average. The
Bighorn Basin received 245 percent of average precipitation while the
Wind River Basin received 120 percent of average. The Little Bighorn -
Upper Tongue Basin received 175 percent of average and the Powder River
had 124 percent of average precipitation.
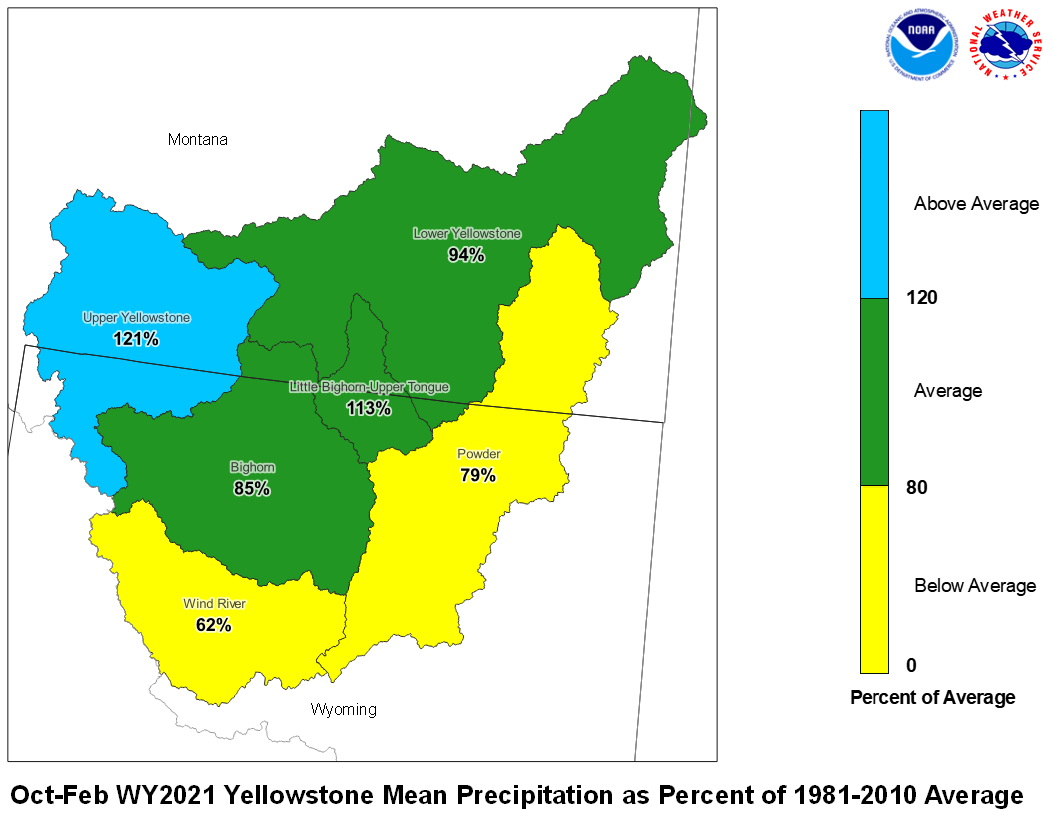
February 2021 Yellowstone Mean Precip Oct-Feb WY2021 Yellowstone Mean Precip
Forecast stream flow in the Yellowstone Basin is below average
for the upcoming Spring and Summer. Stream flow for the
Yellowstone River above Sidney, Montana is forecast to be about
88 percent of average. Flow in the Tongue Basin is expected to be
72 percent of average. Flows in the Powder River are expected
to be about 58 percent of average.
Monthend storage at Boysen Reservoir was 103 percent of average.
Stored water in Buffalo Bill Reservoir was 129 percent of average.
Monthend storage was 103 percent of average at Bighorn Reservoir.

Yellowstone March 1, 2021 Spring and Summer Streamflow Forecasts
Platte Basin
The high elevation snow pack in the Upper North Platte Basin was
93 percent of average on March 1. The snow pack in the North Platte
Basin below Seminoe Reservoir was 91 percent of average. The snow
pack in the South Platte Basin was 90 percent of average.
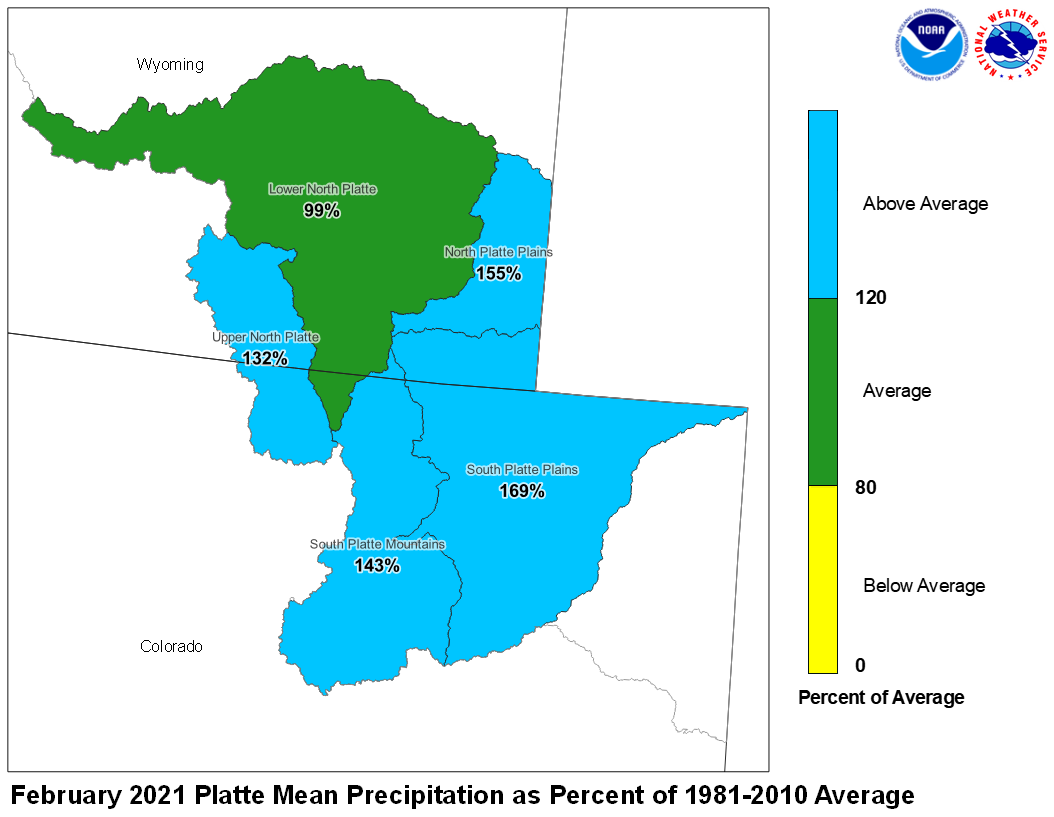
Precipitation during February in the Upper North Platte Basin was 132
percent of average. In the Lower North Platte Basin, precipitation
was 99 percent of average. The North Platte Plains below Guernsy
Reservoir had 155 percent. The South Platte Mountains had 143
percent whereas the Plains had 169 percent of average December
precipitation.
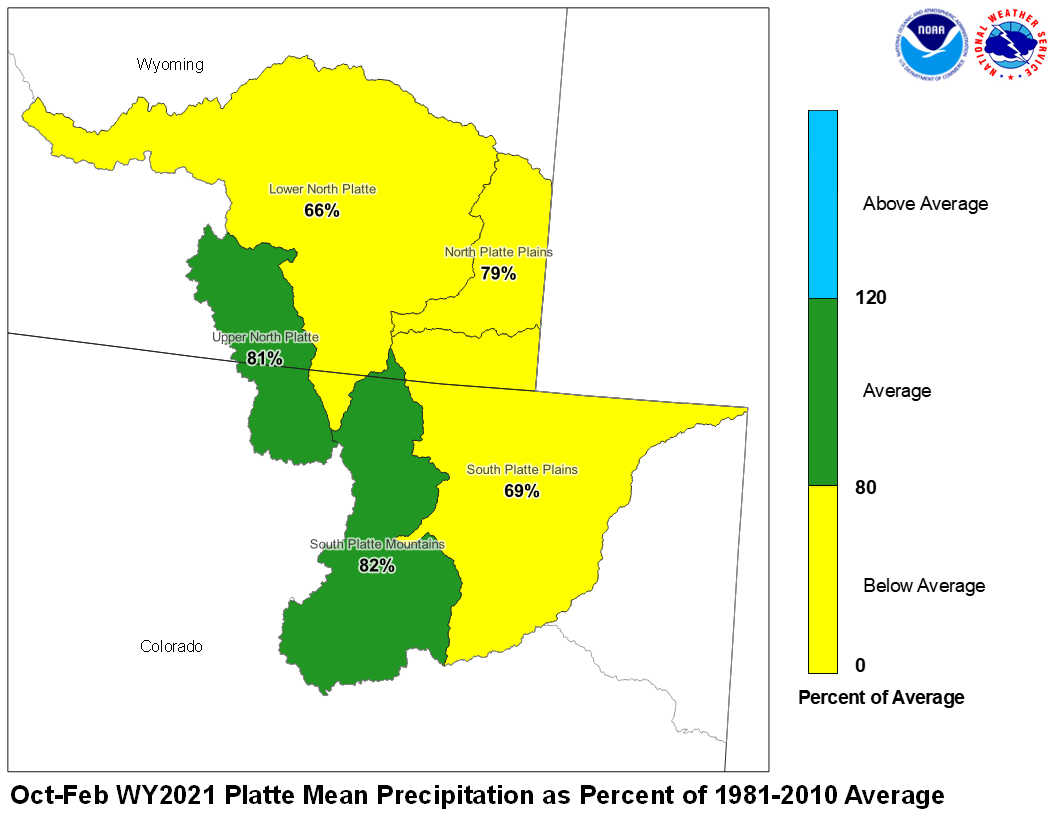
DecemberFebruary 2021 Platte Mean Precip Oct-Feb WY2021 Platte Mean Precip
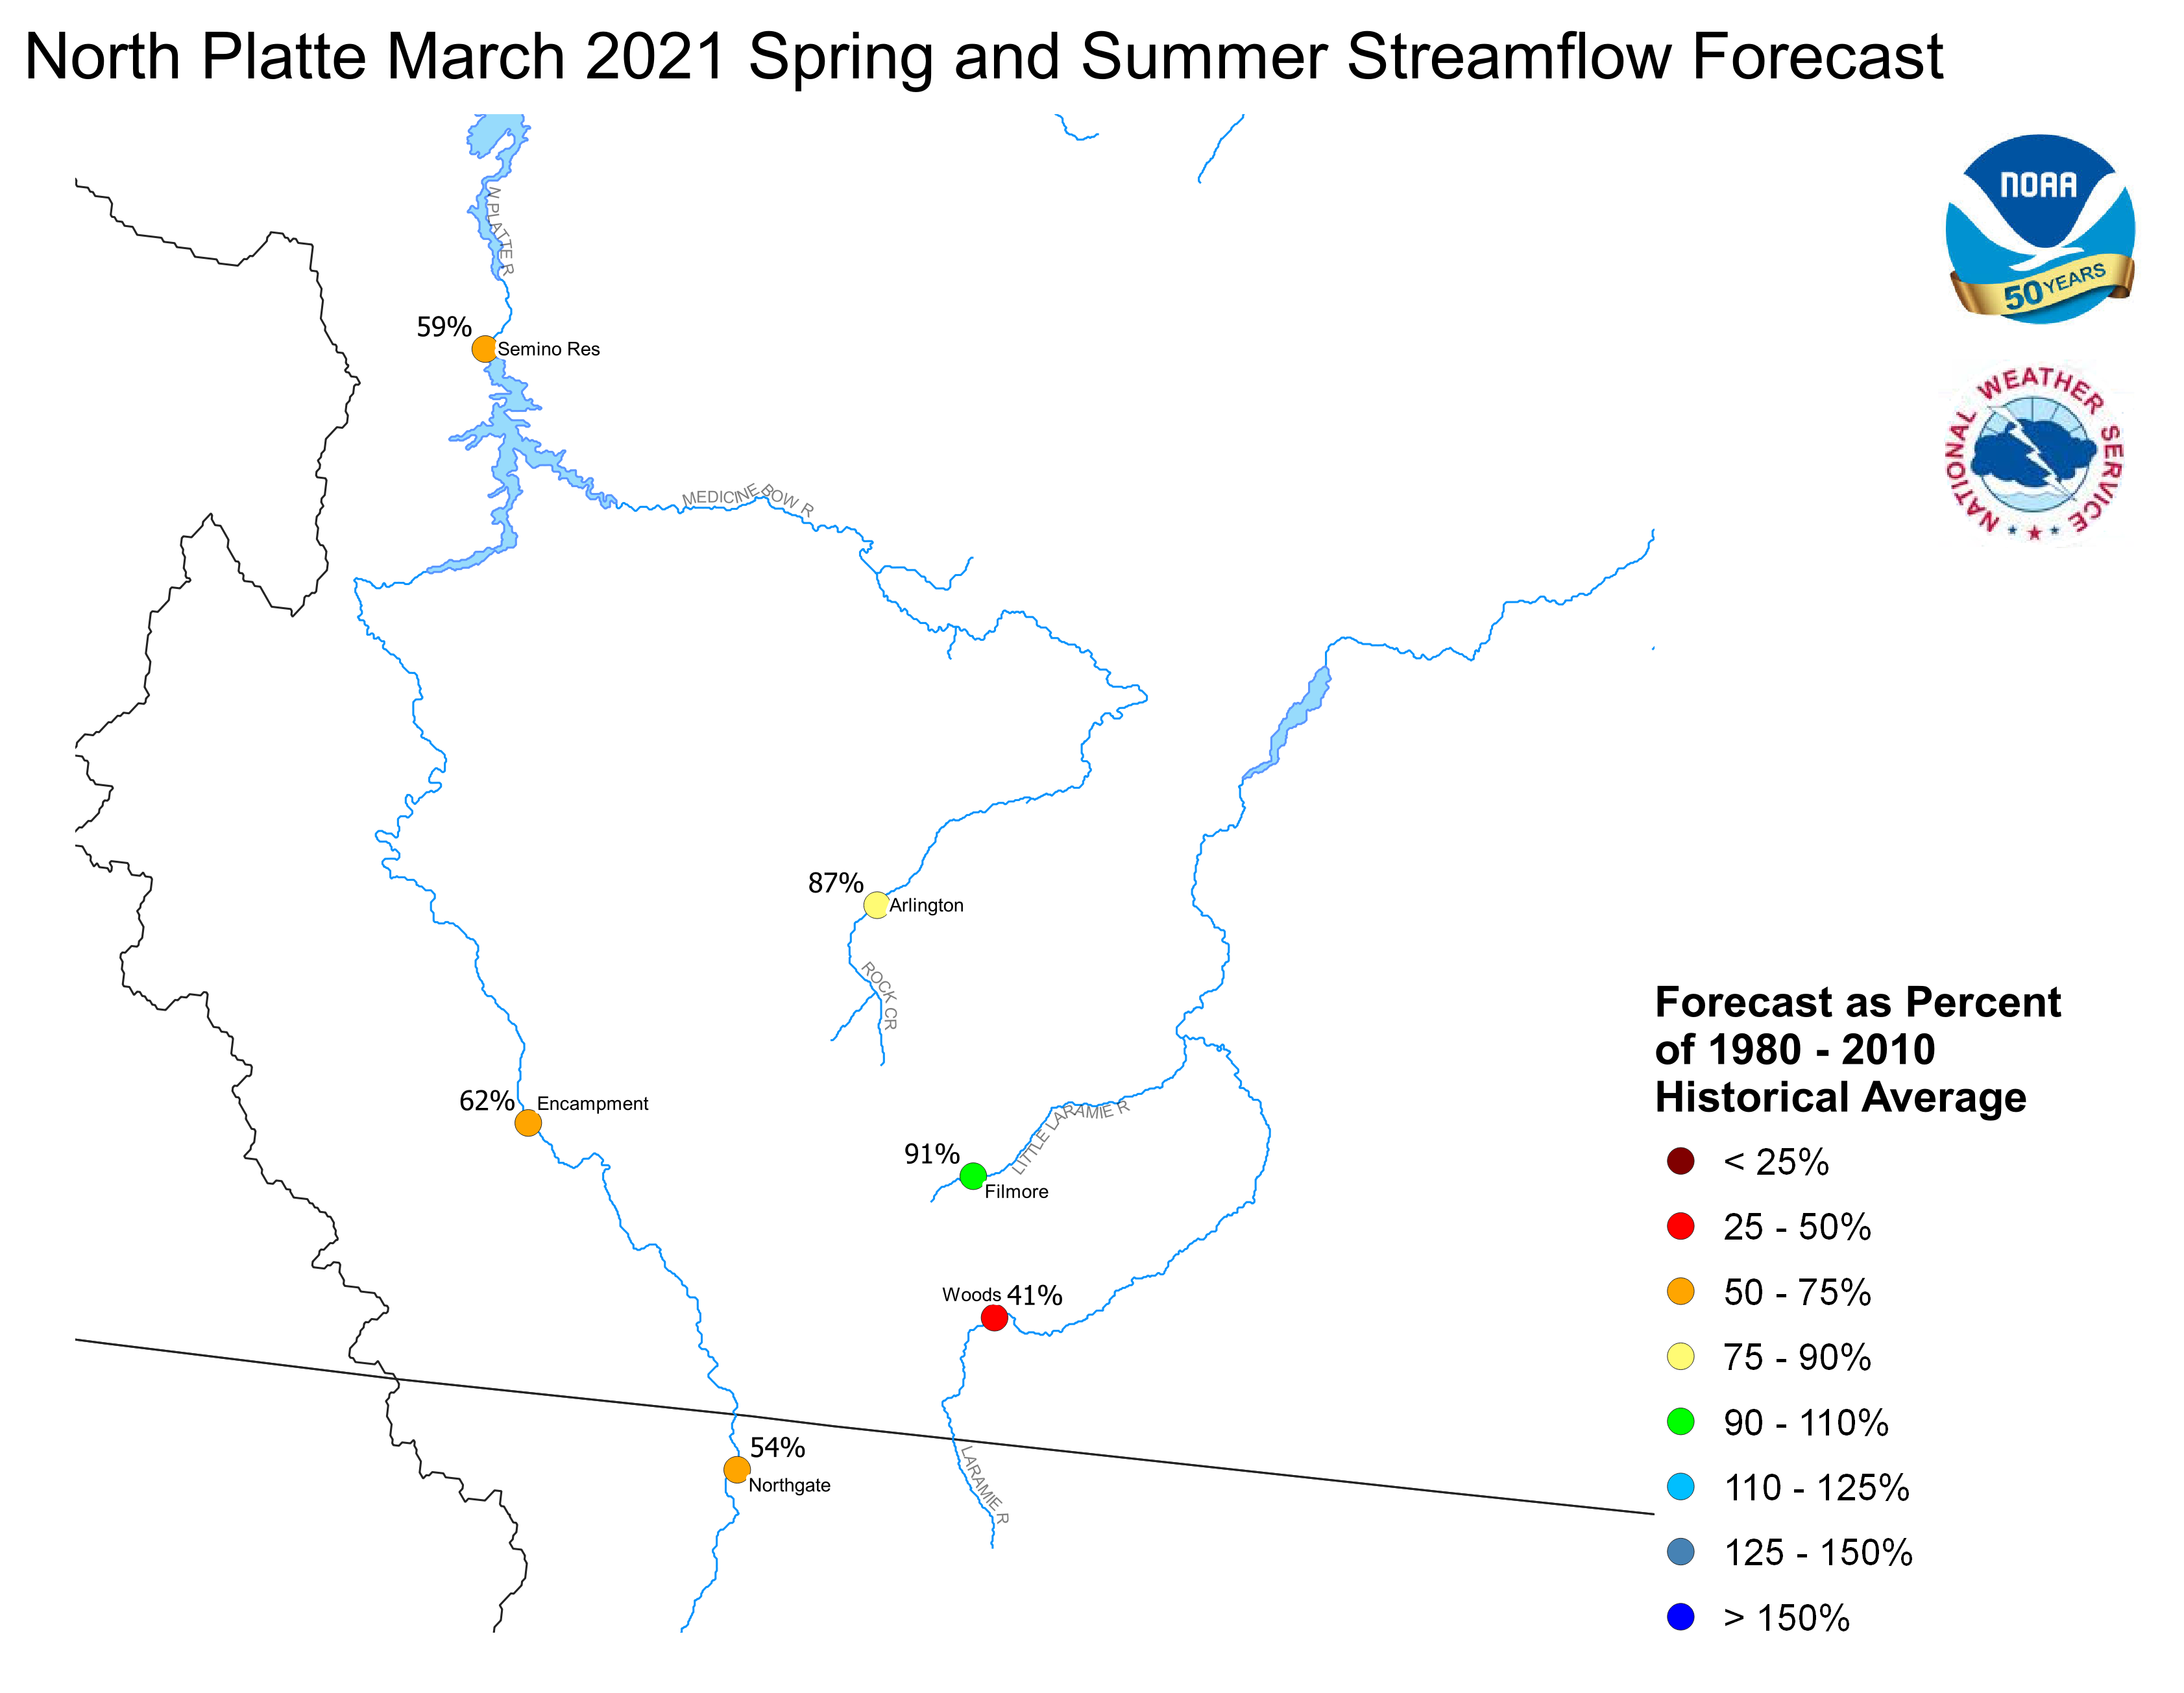
Stream flow in the Platte Basin is forecast to be below
average during the upcoming Spring and Summer. Runoff
for streams above Seminoe Reservoir are expected to be
about 75 percent of average. Streams in the South Platte
Basin above South Platte, Colorado can expect 68 percent
of average flow. For the remainder of the South Platte
basin, flows are expected near 64 percent.
Stored water in the South Platte Basin was 93 percent of average
on March 1.
North Platte Streamflow Fcst South Platte Streamflow Fcst
FGUS63 KKRF 021337
ESPKRF
WATER SUPPLY FORECAST
NWS MISSOURI BASIN RIVER FORECAST CENTER
PLEASANT HILL MISSOURI

*** UPDATED VERSION WITH ALL FORECAST LOCATIONS ***

0728 AM CST TUESDAY MARCH 02, 2021

DATA CURRENT AS OF: MARCH 01, 2021

MISSOURI/YELLOWSTONE/PLATTE RIVER BASIN FORECASTS


                                          50%   %   10%   90%   AVG
FORECAST POINT                   PERIOD  (KAF) AVG (KAF) (KAF) (KAF)
--------------------------------------------------------------------

Boysen Resvr Inflow              Apr-Sep  676   59  1177  416   1140
 SBDW4N

Bighorn R at Kane                Apr-Sep 1051   62  1768  660   1690
 LVEW4N

Greybull R at Meeteetse          Apr-Sep  116   65   211   58    177
 MEEW4N

Buffalo Bill Resvr Inflow        Apr-Sep  533   70   733  408    765
 CDYW4N

St. Mary R nr Babb               Apr-Sep  420   79   482  357    535
 SMYM8N

St. Mary R at Intl Boundary      Apr-Sep  492   75   578  413    660
 SMBM8N

Milk R nr Western Crossing       Apr-Sep   27   67    58   14     41
 PDBM8N

Milk R nr Eastern Crossing       Apr-Sep   44   55   109   22     81
 ERNM8N

North Platte R nr Northgate      Apr-Sep  162   54   314   81    300
 NGTC2

Encampment R nr Encampment       Apr-Sep   91   60   137   57    150
 ECRW4

Encampment R nr Encampment       Apr-Sep  100   62   146   66    160
 ECRW4N

Rock Cr nr Arlington             Apr-Sep   46   88    61   34     52
 KCRW4

Rock Cr nr Arlington             Apr-Sep   46   87    61   34     53
 KCRW4N

Seminoe Resvr Inflow             Apr-Sep  418   52   798  221    805
 SETW4

Seminoe Resvr Inflow             Apr-Sep  559   59   942  351    955
 SETW4N

Laramie R nr Woods Landing       Apr-Sep   24   23    75   13    108
 WODW4

Laramie R nr Woods Landing       Apr-Sep   58   41   111   39    142
 WODW4N

Little Laramie R nr Filmore      Apr-Sep   50   91    78   36     55
 SMTW4

Little Laramie R nr Filmore      Apr-Sep   52   91    80   38     57
 SMTW4N

Antero Resvr Inflow              Apr-Sep   14   83    22   10     17
 ANRC2N

Spinney Mountain Resvr Inflow    Apr-Sep   33   58    58   21     56
 SPYC2N

Elevenmile Canyon Resvr Inflow   Apr-Sep   35   59    64   23     60
 EVNC2N

Cheesman Lk Inflow               Apr-Sep   68   60   130   44    114
 CHEC2N

S Platte R at S Platte           Apr-Sep  125   61   227   81    205
 SPTC2N

Bear Cr at Morrison              Apr-Sep    9   45    22    6     21
 MRRC2N

Clear Cr at Golden               Apr-Sep   55   47    92   37    117
 GLDC2N

St. Vrain Cr at Lyons            Apr-Sep   67   60   107   50    111
 LNSC2N

Boulder Cr nr Orodell            Apr-Sep   38   72    54   26     52
 OROC2N

S Boulder Cr nr Eldorado Sprgs   Apr-Sep   20   51    34   10     40
 BELC2N

Cache La Poudre at Canyon Mouth  Apr-Sep  138   66   247   78    210
 FTDC2N

Lima Resvr Inflow                Apr-Sep   45   58    72   27     78
 LRRM8N

Clark Canyon Resvr Inflow        Apr-Sep   91   58   141   58    159
 CLKM8N

Beaverhead R at Barretts         Apr-Sep  121   62   177   85    194
 BARM8N

Ruby R Resvr Inflow              Apr-Sep   82   84   100   61     97
 ALRM8N

Big Hole R nr Melrose            Apr-Sep  517   92   787  390    560
 MLRM8

Big Hole R nr Melrose            Apr-Sep  576  101   844  448    570
 MLRM8N

Hebgen Resvr Inflow              Apr-Sep  426   99   499  364    430
 HBDM8N

Ennis Resvr Inflow               Apr-Sep  778  104   890  635    745
 ELMM8N

Gallatin R nr Gateway            Apr-Sep  260   57   347  206    455
 GLGM8

Gallatin R nr Gateway            Apr-Sep  260   57   347  206    455
 GLGM8N

Gallatin R at Logan              Apr-Sep  276   55   420  190    505
 LOGM8

Gallatin R at Logan              Apr-Sep  408   69   540  316    595
 LOGM8N

Missouri R at Toston             Apr-Sep 2206   88  2969 1842   2510
 TOSM8N

Missouri R at Fort Benton        Apr-Sep 3466   94  4637 2790   3690
 FBNM8N

Missouri R nr Virgelle           Apr-Sep 3975   93  5354 3188   4280
 VRGM8N

Missouri R nr Landusky           Apr-Sep 4240   94  5686 3384   4490
 LDKM8N

Missouri R below Fort Peck Dam   Apr-Sep 4391   93  5891 3479   4730
 FPKM8N

Gibson Resvr Inflow              Apr-Sep  468  117   640  387    400
 AGSM8N

Marias R nr Shelby               Apr-Sep  415   92   611  325    450
 SHLM8N

Musselshell R at Harlowton       Apr-Sep   64   61   112   37    104
 HLWM8N

Yellowstone R at Yellowstone Lk  Apr-Sep  592   74   747  476    795
 YLOW4

Yellowstone R at Yellowstone Lk  Apr-Sep  781   93   961  650    840
 YLOW4N

Yellowstone R at Corwin Sprgs    Apr-Sep 1478   79  1823 1239   1880
 CORM8

Yellowstone R at Corwin Sprgs    Apr-Sep 1784   90  2135 1487   1980
 CORM8N

Yellowstone R at Livingston      Apr-Sep 1809   85  2210 1523   2130
 LIVM8

Yellowstone R at Livingston      Apr-Sep 2176   94  2582 1805   2310
 LIVM8N

Yellowstone R at Billings        Apr-Sep 2766   74  3463 2162   3730
 BILM8

Yellowstone R at Billings        Apr-Sep 3784   89  4446 3097   4260
 BILM8N

Yellowstone R at Miles City      Apr-Sep 5643   78  7303 4462   7250
 MILM8N

Yellowstone R at Sidney          Apr-Sep 5799   77  7562 4585   7540
 SIDM8N

Boulder R at Big Timber          Apr-Sep  211   70   256  155    300
 BTMM8

Boulder R at Big Timber          Apr-Sep  252   78   297  195    325
 BTMM8N

Stillwater R nr Absarokee        Apr-Sep  334   66   420  267    505
 SRAM8

Stillwater R nr Absarokee        Apr-Sep  392   71   477  325    550
 SRAM8N

Clks Fk Yellowstone R nr Belfry  Apr-Sep  415   75   533  324    550
 BFYM8

Clks Fk Yellowstone R nr Belfry  Apr-Sep  486   81   602  398    600
 BFYM8N

Bighorn R nr St. Xavier          Apr-Sep 1660   65  2512 1160   2550
 STXM8N

Little Bighorn R nr Hardin       Apr-Sep   68   66   100   42    103
 HRDM8N

Tongue R nr Dayton               Apr-Sep   65   78    83   47     83
 DAYW4N

Tongue R nr Decker               Apr-Sep  146   68   216   98    215
 DSLM8N

Tongue R Resvr Inflow            Apr-Sep  148   69   223   99    215
 DKRM8N

Powder R at Moorhead             Apr-Sep  130   59   257   72    220
 MHDM8N

Powder R nr Locate               Apr-Sep  139   57   318   77    245
 LOCM8N


Locations with an `N` suffix indicate natural flows excluding
stream augmentations.

KAF: Thousands of Acre-feet

%AVG: Current 50%/AVG

AVG: Average(50%) seasonal runoff voulme as simulated by the river
forecast model considering acontinuous simulation of the basin
response to historic climate data (observed precipitation and
temperatures) over the period of 1981-2010.

The 50%, 10% and 90% columns indicate the probability that the
actual volume will exceed the forecast for the valid time perion
for more information, please visit: www.weather.gov/mbrfc/water

