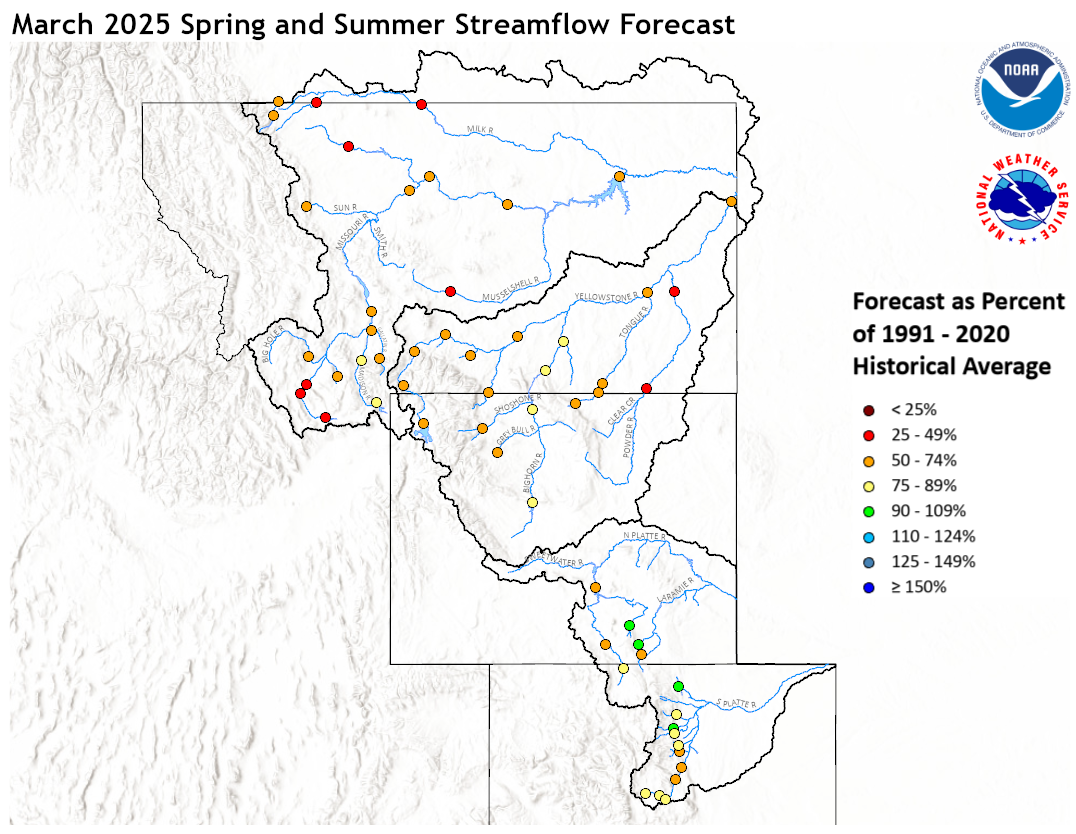
March 1, 2025 Spring and Summer Streamflow Forecasts
Upper Missouri Basin
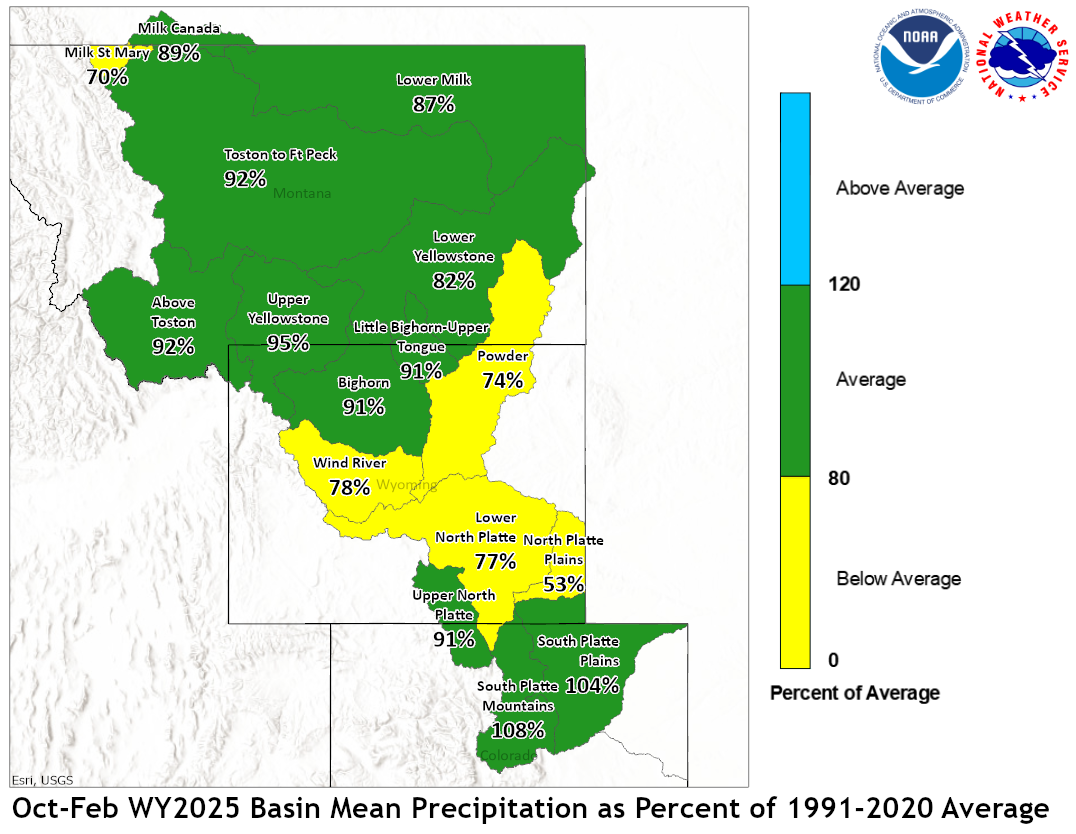
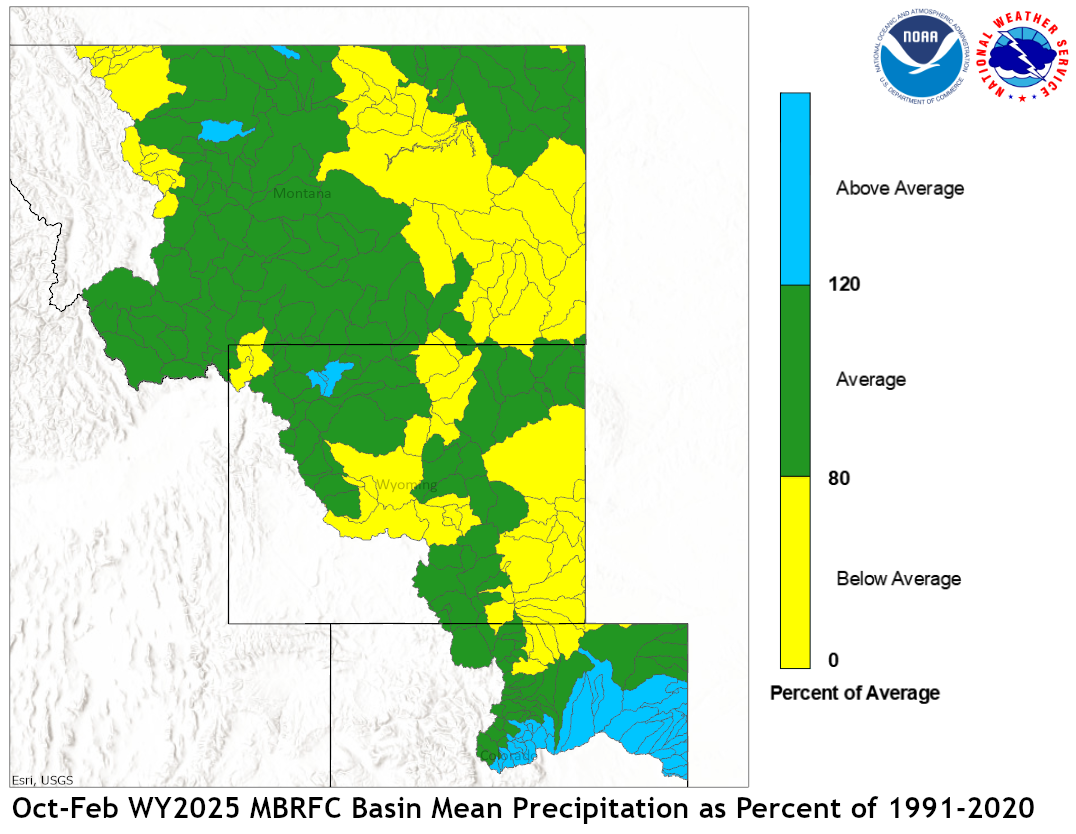
The high elevation snow pack in the Upper Missouri Basin as of March 1
was below average. The snow pack in the St. Mary Basin was 72 percent,
and the Jefferson River Basin was 95 percent.
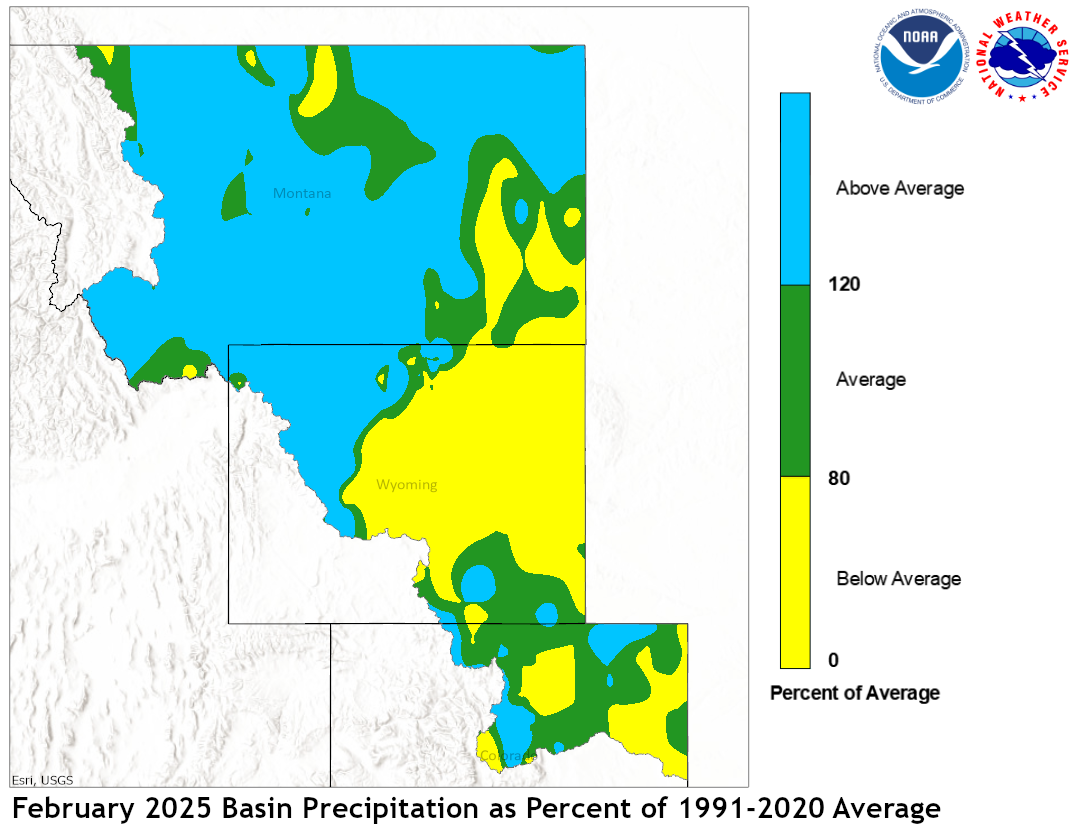
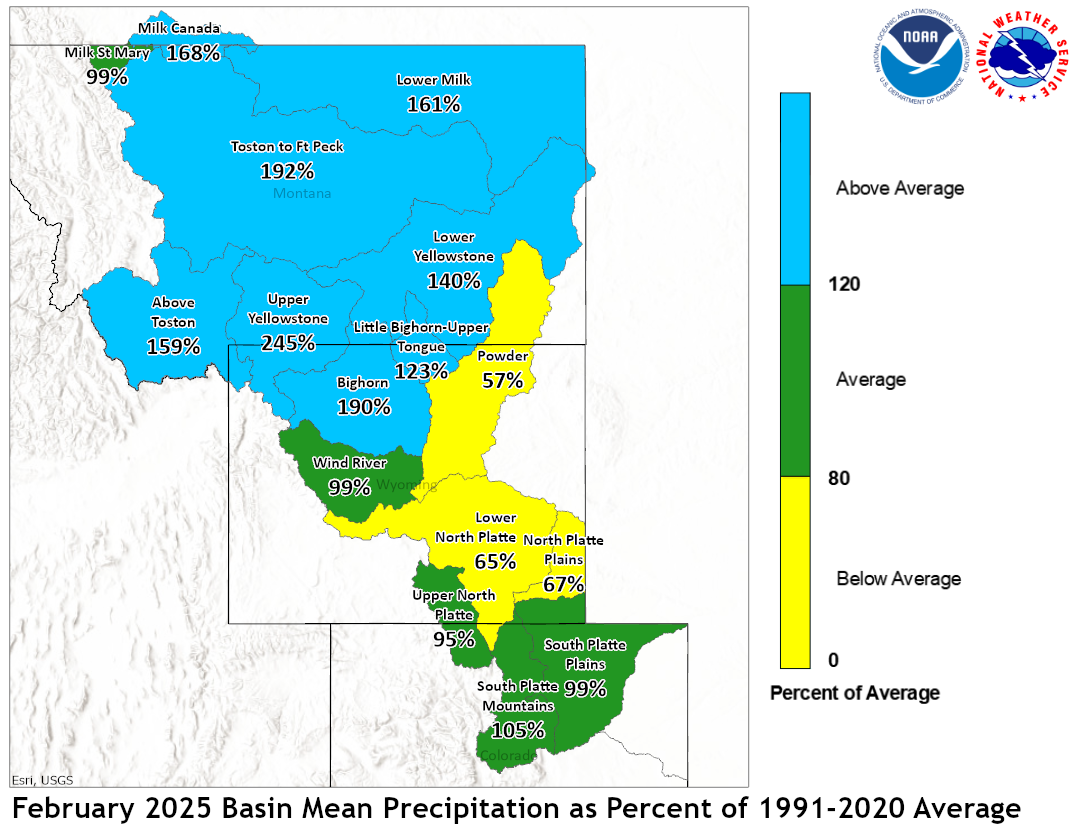
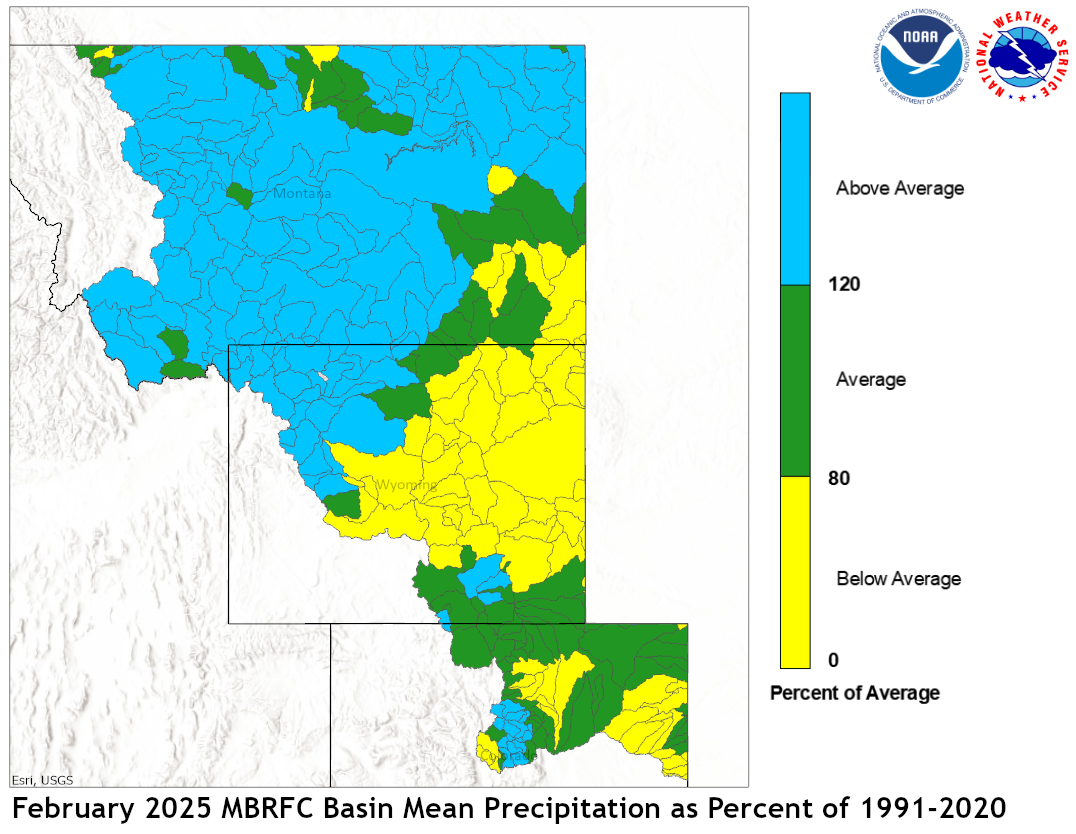
February precipitation across the Upper Missouri Basin was above average.
Basin precipitation summaries for the Missouri Basin include: Milk St. Mary,
99 percent; Milk Canada, 168 percent; Lower Milk, 161 percent; above Toston,
159 percent; Toston to Ft. Peck, 192 percent.
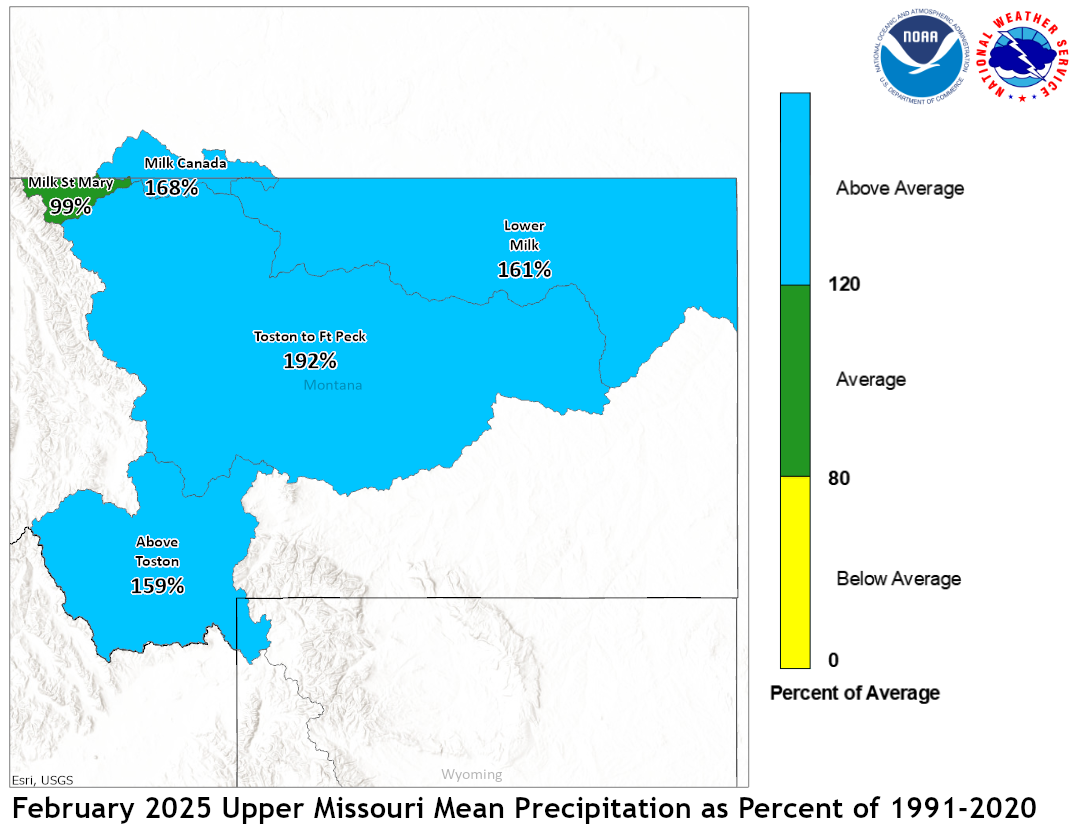
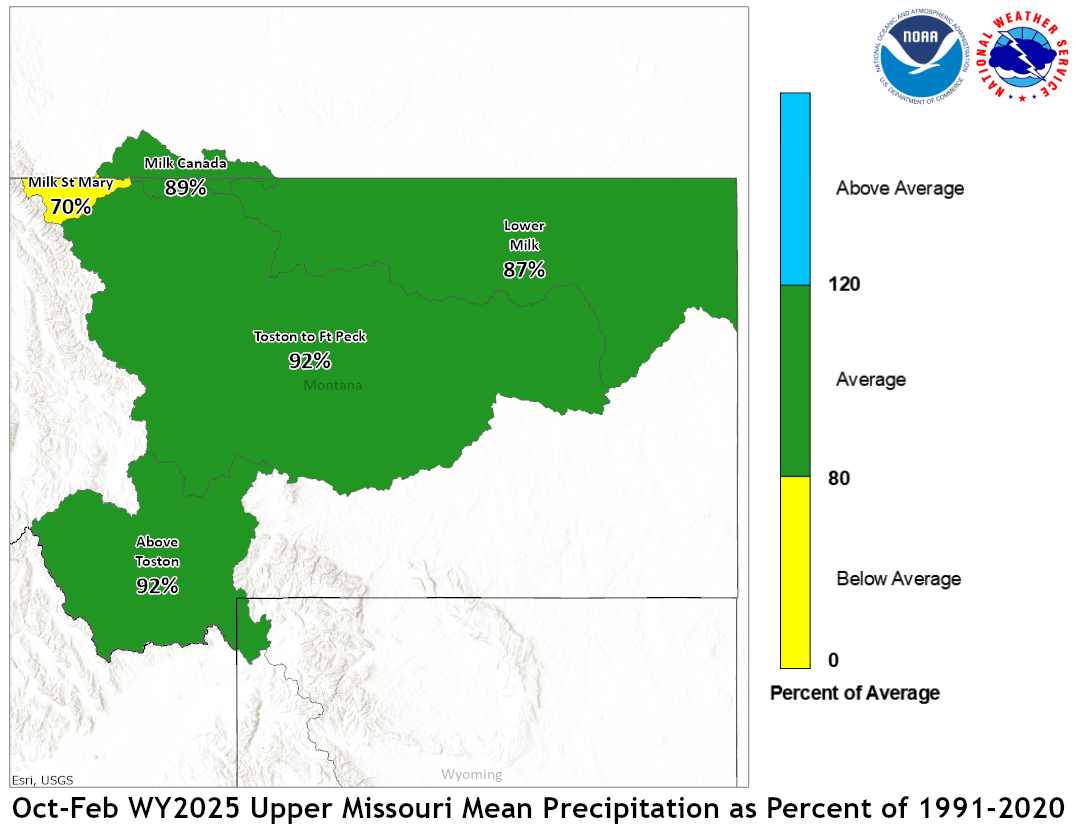
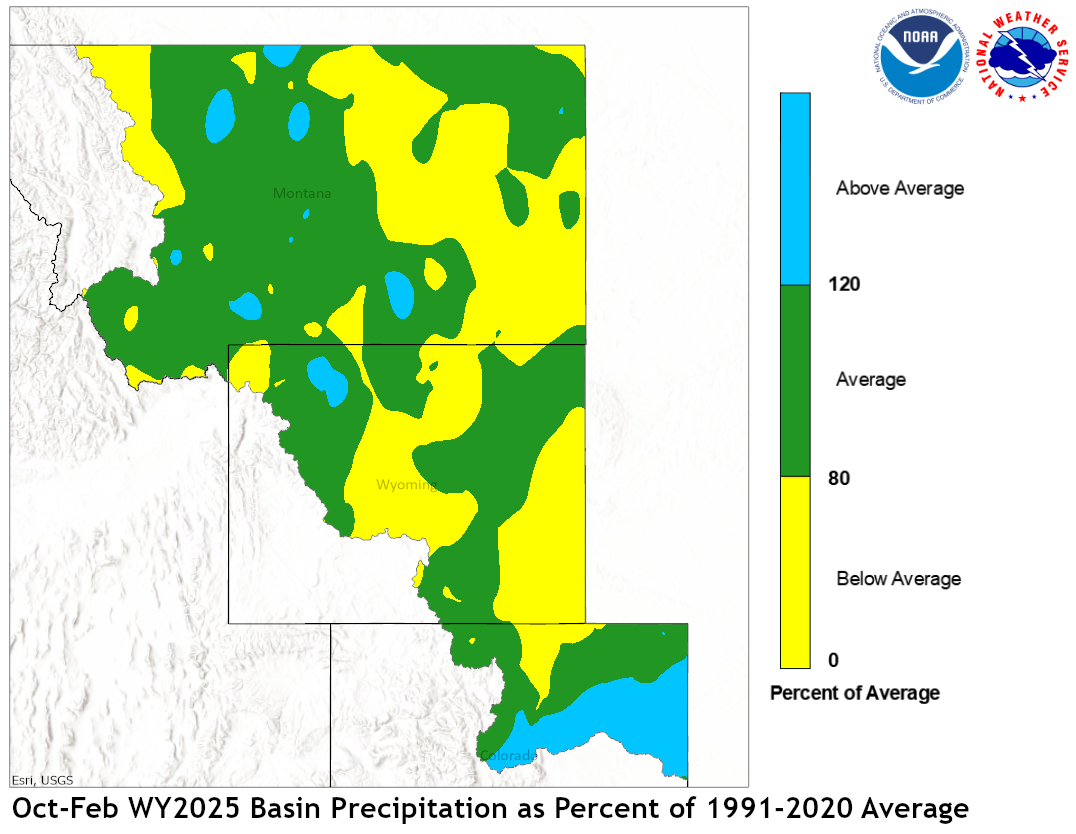
February 2025 Upper Missouri Mean Precip Oct-Feb WY2025 Upper Missouri Mean Precip
Stream flow in the Upper Missouri Basin is forecast to be
below average during the upcoming Spring and Summer.
The St. Mary River is forecast to have 51 percent of average
April-September flows. Runoff is expected to range around
71 percent of average for the Missouri Basin above Fort Peck,
Montana.
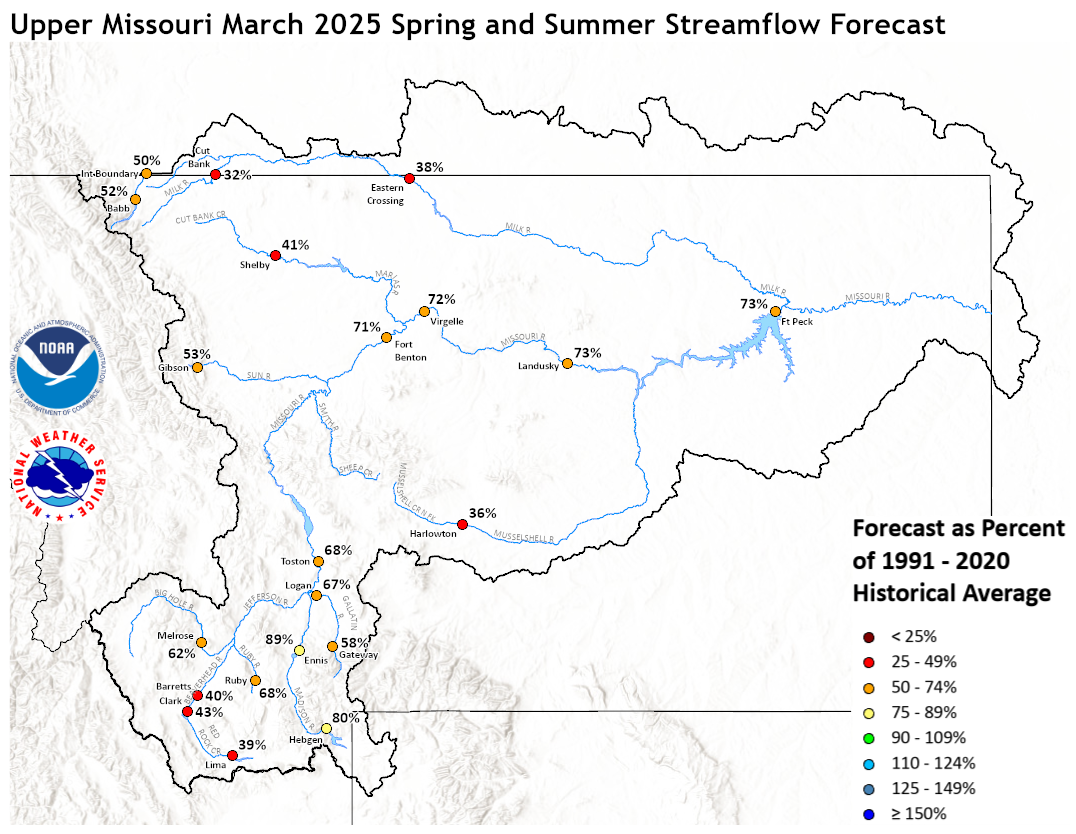
Upper Missouri March 1, 2025 Spring and Summer Streamflow Forecasts
Of the four major irrigation reservoirs in Montana; Lima
Reservoir had 102 percent average storage, Clark Canyon was
holding 115 percent of average water, Gibson Reservoir had 18
percent of average stored water, and Fresno Reservoir had
61 percent of average stored water.
Yellowstone Basin
The high elevation snow pack in the Yellowstone Basin was near average
on March 1. The snow pack in the Upper Yellowstone Basin was 98 percent
of average. The snow packs in the Wind, Bighorn, and Shoshone Basins were 107,
99, and 98 percent of average, respectively. The snow packs in the Tongue
and Powder basins were 94 and 74 percent of average, respectively.
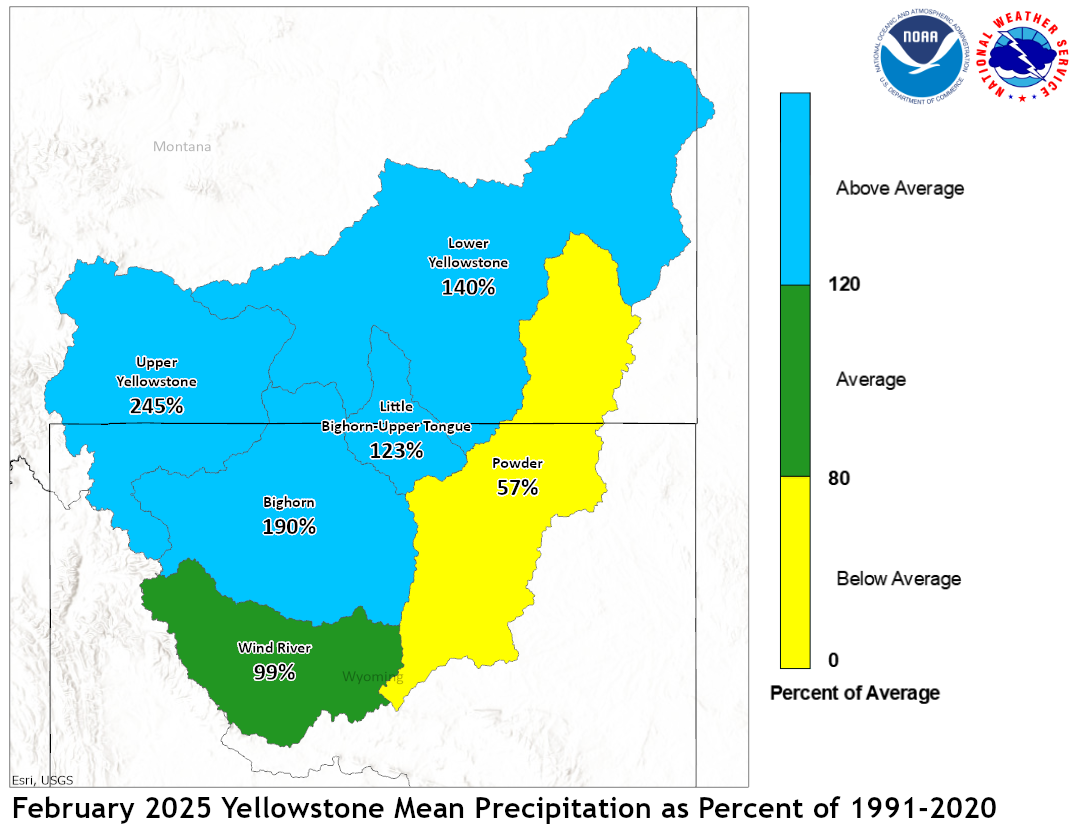
Precipitation during February was above average. The upper Yellowstone
River Basin received 245 percent of average precipitation while the
Lower Yellowstone River Basin reported 140 percent of average. The
Bighorn Basin received 190 percent of average precipitation while the
Wind River Basin received 99 percent of average. The Little Bighorn -
Upper Tongue Basin received 123 percent of average and the Powder River
had 57 percent of average precipitation.
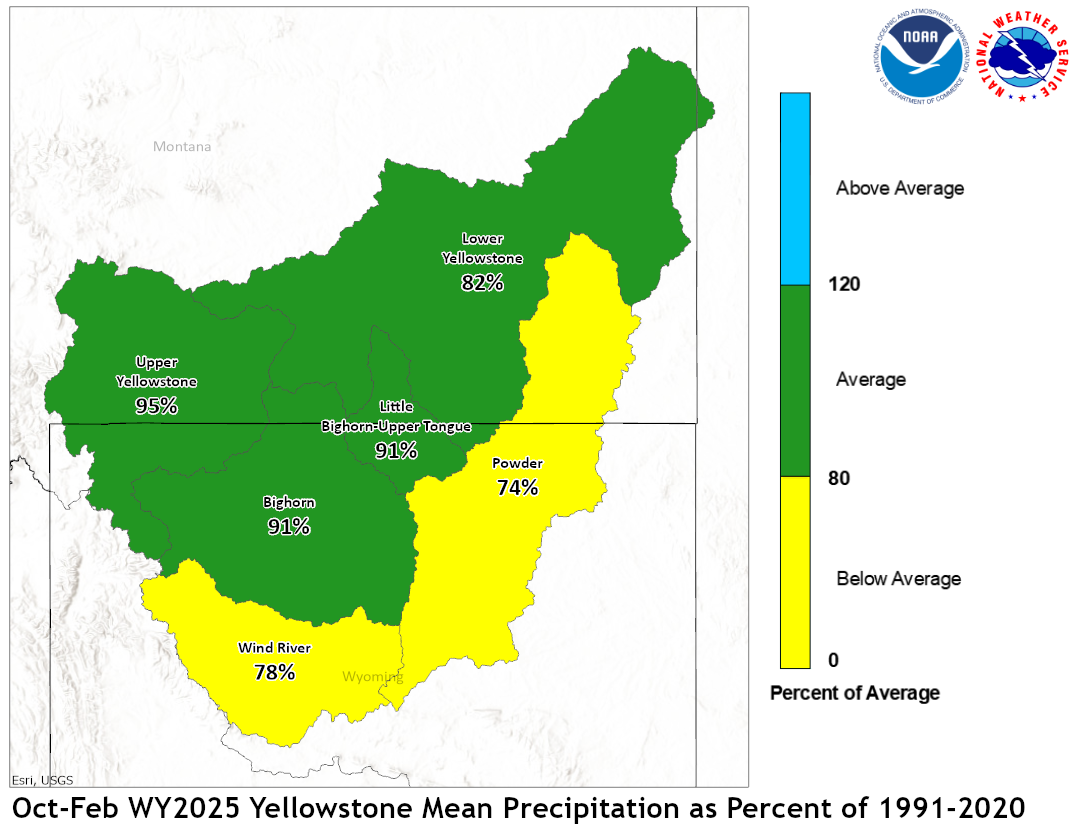
February 2025 Yellowstone Mean Precip Oct-Feb WY2025 Yellowstone Mean Precip
Forecast stream flow in the Yellowstone Basin is below average
for the upcoming Spring and Summer. Stream flow for the
Yellowstone River above Sidney, Montana is forecast to be about
62 percent of average. Flow in the Tongue Basin is expected to be
62 percent of average. Flows in the Powder River are expected
to be about 41 percent of average.
Monthend storage at Boysen Reservoir was 86 percent of average.
Stored water in Buffalo Bill Reservoir was 85 percent of average.
Monthend storage was 96 percent of average at Bighorn Reservoir.
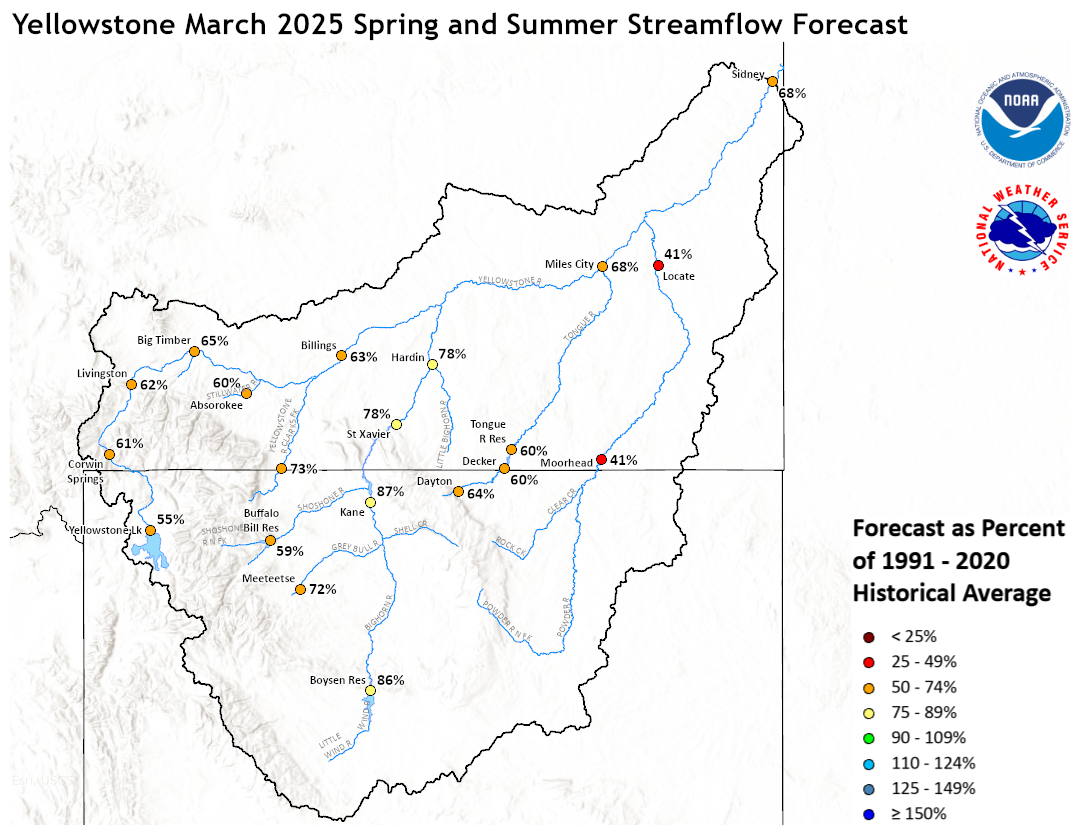
Yellowstone March 1, 2025 Spring and Summer Streamflow Forecasts
Platte Basin
The high elevation snow pack in the Upper North Platte Basin was
95 percent of average on March 1. The snow pack in the North Platte
Basin below Seminoe Reservoir was 78 percent of average. The snow
pack in the South Platte Basin was 105 percent of average.
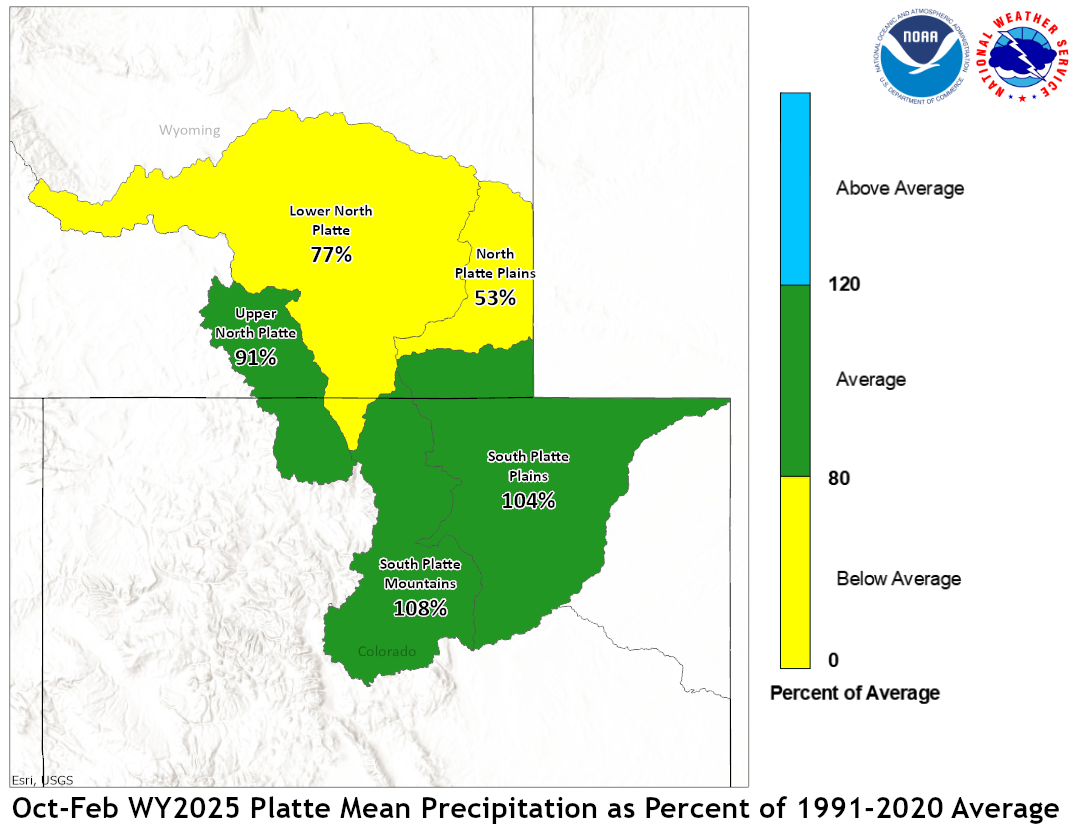
Precipitation during February in the Upper North Platte Basin was 95
percent of average. In the Lower North Platte Basin, precipitation
was 65 percent of average. The North Platte Plains below Guernsy
Reservoir had 67 percent. The South Platte Mountains had 105
percent whereas the Plains had 99 percent of average February
precipitation.
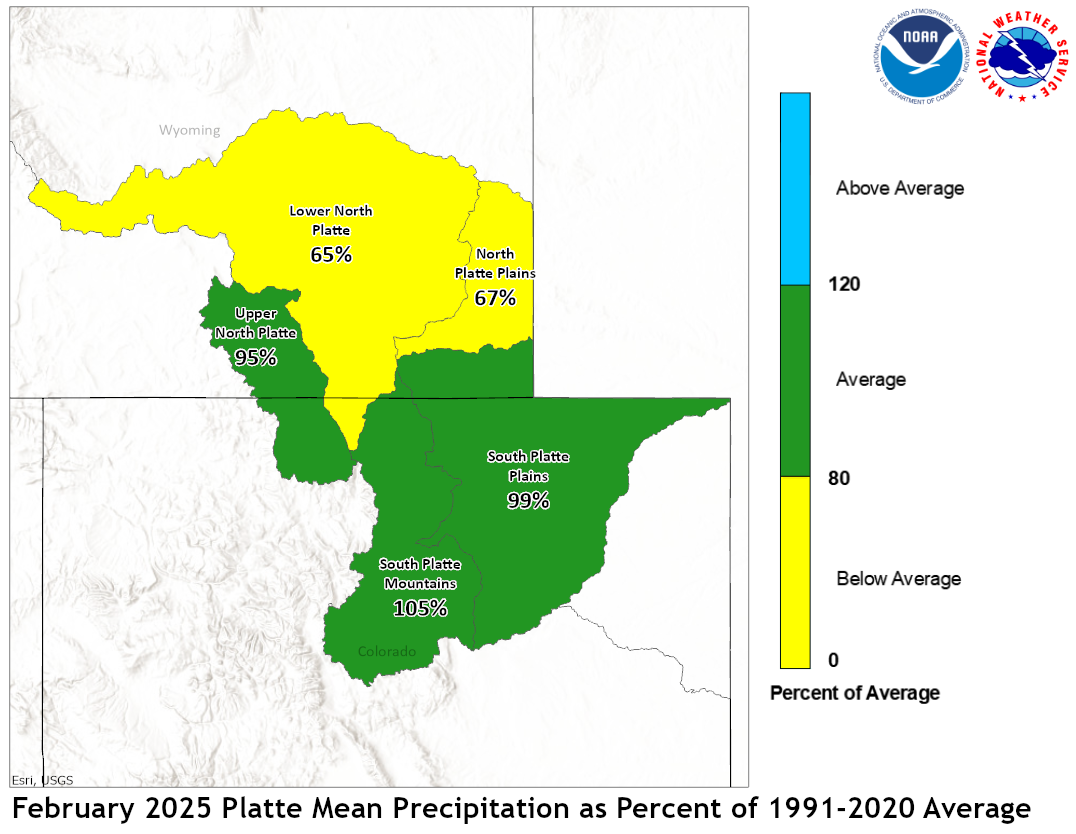
February 2025 Platte Mean Precip Oct-Feb WY2025 Platte Mean Precip
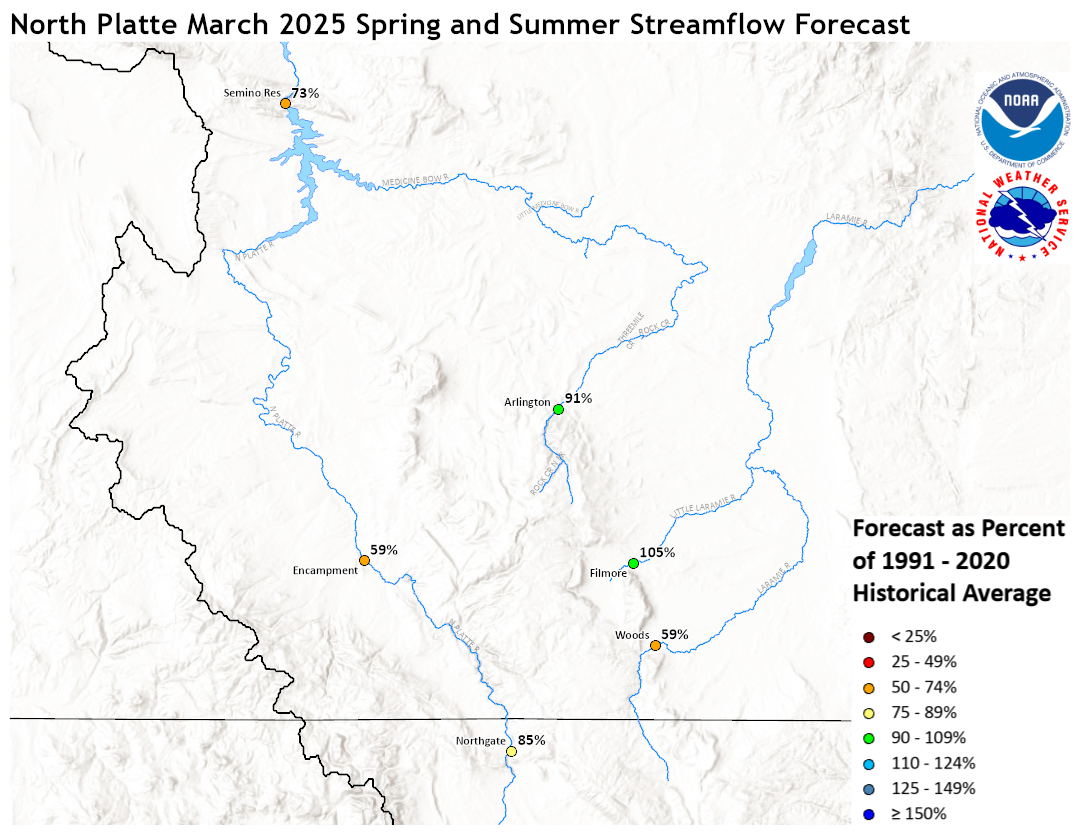
Stream flow in the Platte Basin is forecast to be below
average during the upcoming Spring and Summer. Runoff
for streams above Seminoe Reservoir are expected to be
about 71 percent of average. Streams in the South Platte
Basin above South Platte, Colorado can expect 73 percent
of average flow. For the remainder of the South Platte
basin, flows are expected near 75 percent.
Stored water in the South Platte Basin was 101 percent of average
on March 1.
North Platte Streamflow Fcst South Platte Streamflow Fcst
       WATER SUPPLY FORECAST
NWS MISSOURI BASIN RIVER FORECAST CENTER
PLEASANT HILL MISSOURI

1156 CST WEDNESDAY MARCH 05, 2025

DATA CURRENT AS OF: MARCH 01, 2025

MISSOURI/YELLOWSTONE/PLATTE RIVER BASIN FORECASTS


                                          50%   %   10%   90%   AVG
FORECAST POINT                   PERIOD  (KAF) AVG (KAF) (KAF) (KAF)
--------------------------------------------------------------------

Boysen Resvr Inflow              Apr-Sep  318   44   787  132    720
 SBDW4

Boysen Resvr Inflow              Apr-Sep  766   86  1319  428    890
 SBDW4N

Bighorn R at Kane                Apr-Sep  637   65  1089  400    985
 LVEW4

Bighorn R at Kane                Apr-Sep 1254   87  2028  693   1440
 LVEW4N

Greybull R at Meeteetse          Apr-Sep  148   76   230   68    196
 MEEW4

Greybull R at Meeteetse          Apr-Sep  148   72   230   68    205
 MEEW4N

Buffalo Bill Resvr Inflow        Apr-Sep  459   56   622  319    815
 CDYW4

Buffalo Bill Resvr Inflow        Apr-Sep  536   59   702  398    910
 CDYW4N

Keyhole Resvr Inflow             Apr-Sep    6  150    15    2      4
 KEYW4

St. Mary R nr Babb               Apr-Sep  288   63   351  248    460
 SMYM8

St. Mary R nr Babb               Apr-Sep  280   52   341  239    535
 SMYM8N

St. Mary R at Intl Boundary      Apr-Sep  338   87   417  290    390
 SMBM8

St. Mary R at Intl Boundary      Apr-Sep  330   50   409  282    660
 SMBM8N

Milk R nr Western Crossing       Apr-Sep    9    8    28    5    113
 PDBM8

Milk R nr Western Crossing       Apr-Sep   13   32    40    6     41
 PDBM8N

Milk R nr Eastern Crossing       Apr-Sep   14    7   104    7    215
 ERNM8

Milk R nr Eastern Crossing       Apr-Sep   42   38   156   19    112
 ERNM8N

North Platte R nr Northgate      Apr-Sep  196   80   338  111    245
 NGTC2

North Platte R nr Northgate      Apr-Sep  250   85   391  159    295
 NGTC2N

Encampment R nr Encampment       Apr-Sep   88   56   147   61    156
 ECRW4

Encampment R nr Encampment       Apr-Sep   98   59   157   73    166
 ECRW4N

Rock Cr nr Arlington             Apr-Sep   48   91    61   37     53
 KCRW4

Rock Cr nr Arlington             Apr-Sep   48   91    62   37     53
 KCRW4N

Seminoe Resvr Inflow             Apr-Sep  508   66   863  311    765
 SETW4

Seminoe Resvr Inflow             Apr-Sep  673   73  1023  477    920
 SETW4N

Laramie R nr Woods Landing       Apr-Sep   49   45    97   21    108
 WODW4

Laramie R nr Woods Landing       Apr-Sep   84   59   133   51    142
 WODW4N

Little Laramie R nr Filmore      Apr-Sep   58  105    82   41     55
 SMTW4

Little Laramie R nr Filmore      Apr-Sep   60  105    84   43     57
 SMTW4N

Antero Resvr Inflow              Apr-Sep   12   86    21    7     14
 ANRC2

Antero Resvr Inflow              Apr-Sep   12   86    21    7     14
 ANRC2N

Spinney Mountain Resvr Inflow    Apr-Sep   41   72    65   28     57
 SPYC2

Spinney Mountain Resvr Inflow    Apr-Sep   36   80    62   20     45
 SPYC2N

Elevenmile Canyon Resvr Inflow   Apr-Sep   36   61    47   31     59
 EVNC2

Elevenmile Canyon Resvr Inflow   Apr-Sep   38   76    66   22     50
 EVNC2N

Cheesman Lk Inflow               Apr-Sep   44   44    77   34    100
 CHEC2

Cheesman Lk Inflow               Apr-Sep   66   71   115   40     93
 CHEC2N

S Platte R at S Platte           Apr-Sep  309  129   390  275    240
 SPTC2

S Platte R at S Platte           Apr-Sep  141   69   233   78    205
 SPTC2N

Bear Cr at Morrison              Apr-Sep   15   58    31    6     26
 MRRC2

Bear Cr at Morrison              Apr-Sep   15   58    31    6     26
 MRRC2N

Clear Cr at Golden               Apr-Sep   96   81   140   68    118
 GLDC2

Clear Cr at Golden               Apr-Sep  110   84   153   78    131
 GLDC2N

St. Vrain Cr at Lyons            Apr-Sep   58   73    97   39     79
 LNSC2

St. Vrain Cr at Lyons            Apr-Sep   84   77   132   59    109
 LNSC2N

Boulder Cr nr Orodell            Apr-Sep   38   81    59   26     47
 OROC2

Boulder Cr nr Orodell            Apr-Sep   53  102    76   39     52
 OROC2N

S Boulder Cr nr Eldorado Sprgs   Apr-Sep   29   83    41   20     35
 BELC2

S Boulder Cr nr Eldorado Sprgs   Apr-Sep   31   78    50   20     40
 BELC2N

Cache La Poudre at Canyon Mouth  Apr-Sep  164  152   263   97    108
 FTDC2

Cache La Poudre at Canyon Mouth  Apr-Sep  206   98   302  118    210
 FTDC2N

Lima Resvr Inflow                Apr-Sep   31   41    55   19     76
 LRRM8

Lima Resvr Inflow                Apr-Sep   31   39    55   19     79
 LRRM8N

Clark Canyon Resvr Inflow        Apr-Sep   47   43    60   38    110
 CLKM8

Clark Canyon Resvr Inflow        Apr-Sep   85   43   132   61    198
 CLKM8N

Beaverhead R at Barretts         Apr-Sep  125   63   144  116    199
 BARM8

Beaverhead R at Barretts         Apr-Sep  111   40   164   87    280
 BARM8N

Ruby R Resvr Inflow              Apr-Sep   66   75    82   53     88
 ALRM8

Ruby R Resvr Inflow              Apr-Sep   66   68    82   53     97
 ALRM8N

Big Hole R nr Melrose            Apr-Sep  344   58   577  233    595
 MLRM8

Big Hole R nr Melrose            Apr-Sep  408   62   642  297    660
 MLRM8N

Hebgen Resvr Inflow              Apr-Sep  373   80   433  306    465
 HBDM8

Hebgen Resvr Inflow              Apr-Sep  373   80   433  306    465
 HBDM8N

Ennis Resvr Inflow               Apr-Sep  612   86   691  525    715
 ELMM8

Ennis Resvr Inflow               Apr-Sep  653   89   754  535    730
 ELMM8N

Gallatin R nr Gateway            Apr-Sep  276   58   364  237    475
 GLGM8

Gallatin R nr Gateway            Apr-Sep  276   58   364  237    475
 GLGM8N

Gallatin R at Logan              Apr-Sep  290   57   439  221    505
 LOGM8

Gallatin R at Logan              Apr-Sep  437   67   575  372    650
 LOGM8N

Missouri R at Toston             Apr-Sep 1282   62  1889  963   2060
 TOSM8

Missouri R at Toston             Apr-Sep 1925   68  2506 1534   2830
 TOSM8N

Missouri R at Fort Benton        Apr-Sep 1821   60  2109 1696   3060
 FBNM8

Missouri R at Fort Benton        Apr-Sep 2915   71  3683 2335   4100
 FBNM8N

Missouri R nr Virgelle           Apr-Sep 1984   58  2247 1811   3420
 VRGM8

Missouri R nr Virgelle           Apr-Sep 3304   72  4069 2534   4560
 VRGM8N

Missouri R nr Landusky           Apr-Sep 2176   59  2574 1962   3680
 LDKM8

Missouri R nr Landusky           Apr-Sep 3558   73  4441 2722   4890
 LDKM8N

Missouri R below Fort Peck Dam   Apr-Sep 2391   62  2855 2079   3840
 FPKM8

Missouri R below Fort Peck Dam   Apr-Sep 3802   73  4890 2874   5180
 FPKM8N

Gibson Resvr Inflow              Apr-Sep  240   53   364  176    450
 AGSM8

Gibson Resvr Inflow              Apr-Sep  240   53   364  176    450
 AGSM8N

Marias R nr Shelby               Apr-Sep  164   38   324  107    435
 SHLM8

Marias R nr Shelby               Apr-Sep  199   41   364  133    490
 SHLM8N

Musselshell R at Harlowton       Apr-Sep   26   32    63   14     80
 HLWM8

Musselshell R at Harlowton       Apr-Sep   34   36    72   20     95
 HLWM8N

Yellowstone R at Yellowstone Lk  Apr-Sep  304   37   412  245    815
 YLOW4

Yellowstone R at Yellowstone Lk  Apr-Sep  461   55   606  359    840
 YLOW4N

Yellowstone R at Corwin Sprgs    Apr-Sep 1057   53  1301  862   1980
 CORM8

Yellowstone R at Corwin Sprgs    Apr-Sep 1270   61  1563 1014   2070
 CORM8N

Yellowstone R at Livingston      Apr-Sep 1226   54  1556 1025   2290
 LIVM8

Yellowstone R at Livingston      Apr-Sep 1518   62  1873 1236   2440
 LIVM8N

Yellowstone R at Billings        Apr-Sep 2098   52  2710 1621   4070
 BILM8

Yellowstone R at Billings        Apr-Sep 3039   63  3664 2501   4790
 BILM8N

Yellowstone R at Miles City      Apr-Sep 3151   54  4259 2588   5850
 MILM8

Yellowstone R at Miles City      Apr-Sep 5259   68  6627 4388   7690
 MILM8N

Yellowstone R at Sidney          Apr-Sep 3115   55  4188 2451   5710
 SIDM8

Yellowstone R at Sidney          Apr-Sep 5452   68  6942 4443   8060
 SIDM8N

Boulder R at Big Timber          Apr-Sep  201   60   264  157    335
 BTMM8

Boulder R at Big Timber          Apr-Sep  244   65   305  197    375
 BTMM8N

Stillwater R nr Absarokee        Apr-Sep  299   55   382  238    540
 SRAM8

Stillwater R nr Absarokee        Apr-Sep  357   60   434  297    595
 SRAM8N

Clks Fk Yellowstone R nr Belfry  Apr-Sep  434   70   523  339    620
 BFYM8

Clks Fk Yellowstone R nr Belfry  Apr-Sep  505   73   593  412    695
 BFYM8N

Bighorn R nr St. Xavier          Apr-Sep  805   56  1101  630   1430
 STXM8

Bighorn R nr St. Xavier          Apr-Sep 1908   78  2784 1216   2460
 STXM8N

Little Bighorn R nr Hardin       Apr-Sep   99   78   230   59    127
 HRDM8

Little Bighorn R nr Hardin       Apr-Sep   99   78   230   59    127
 HRDM8N

Tongue R nr Dayton               Apr-Sep   60   62    77   38     96
 DAYW4

Tongue R nr Dayton               Apr-Sep   65   64    82   44    101
 DAYW4N

Tongue R nr Decker               Apr-Sep   98   42   157   47    235
 DSLM8

Tongue R nr Decker               Apr-Sep  144   60   205   86    240
 DSLM8N

Tongue R Resvr Inflow            Apr-Sep  100   43   168   48    235
 DKRM8

Tongue R Resvr Inflow            Apr-Sep  146   60   214   87    245
 DKRM8N

Powder R at Moorhead             Apr-Sep   80   36   205   29    225
 MHDM8

Powder R at Moorhead             Apr-Sep  110   41   245   44    270
 MHDM8N

Powder R nr Locate               Apr-Sep   95   37   260   37    260
 LOCM8

Powder R nr Locate               Apr-Sep  125   41   296   53    305
 LOCM8N


Locations with an `N` suffix indicate natural flows excluding
stream augmentations.

KAF: Thousands of Acre-feet

%AVG: Current 50%/AVG

AVG: Average(50%) seasonal runoff voulme as simulated by the river
forecast model considering acontinuous simulation of the basin
response to historic climate data (observed precipitation and
temperatures) over the period of 1991-2020.

The 50%, 10% and 90% columns indicate the probability that the
actual volume will exceed the forecast for the valid time period.

Beginning April 1, May and June official forecasts include observed
runoff volume up to official forecast date.

For more information, please visit: www.weather.gov/mbrfc/water

