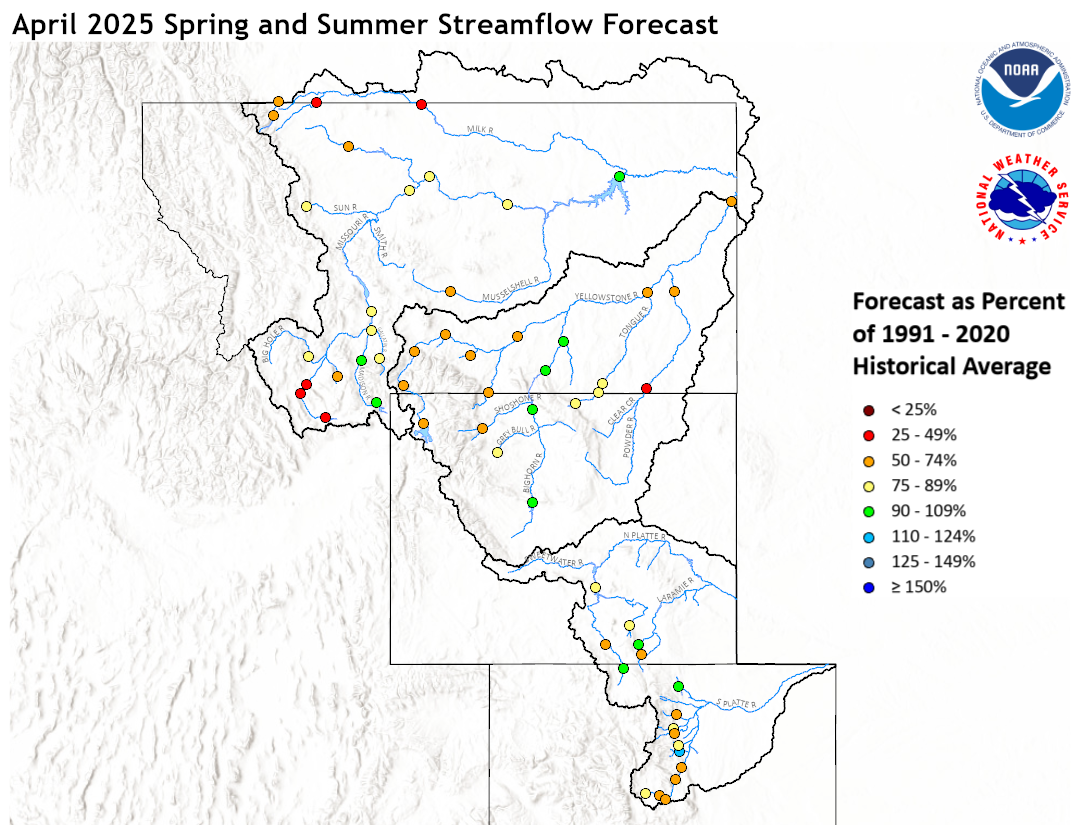
April 1, 2025 Spring and Summer Streamflow Forecasts
Upper Missouri Basin
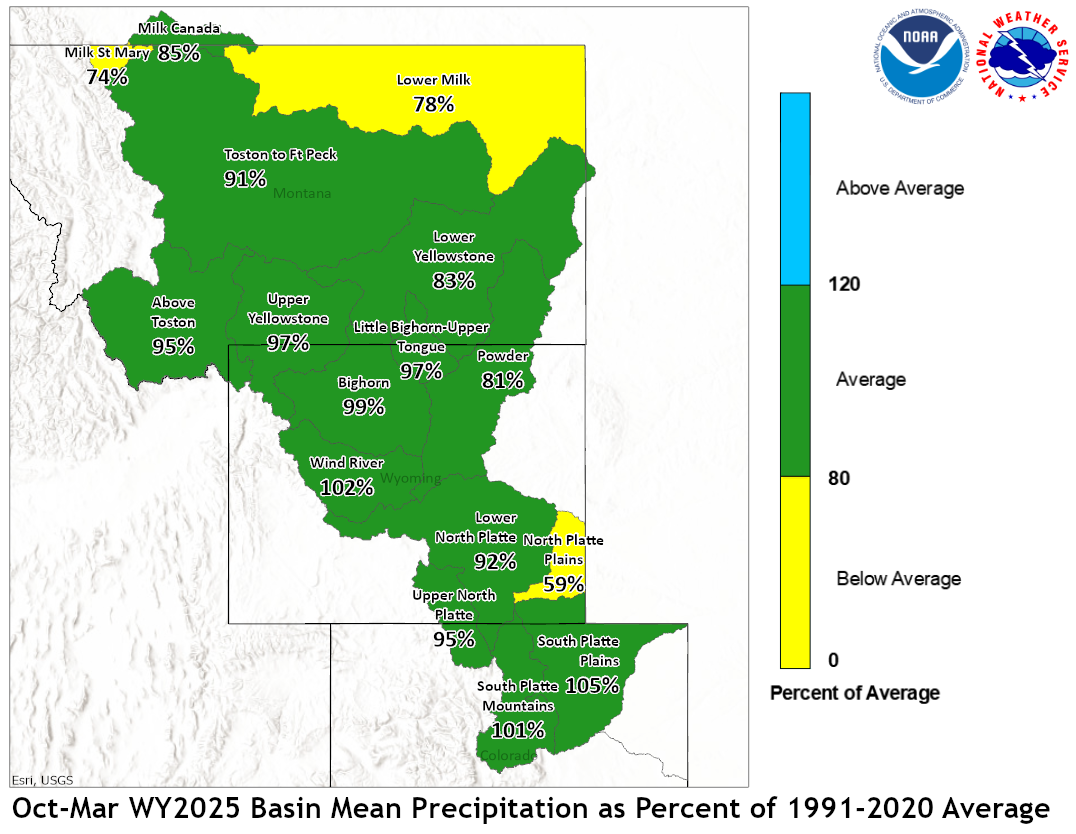
The high elevation snow pack in the Upper Missouri Basin as of April 1
was below average. The snow pack in the St. Mary Basin was 69 percent,
and the Milk River Basin was 72 percent.
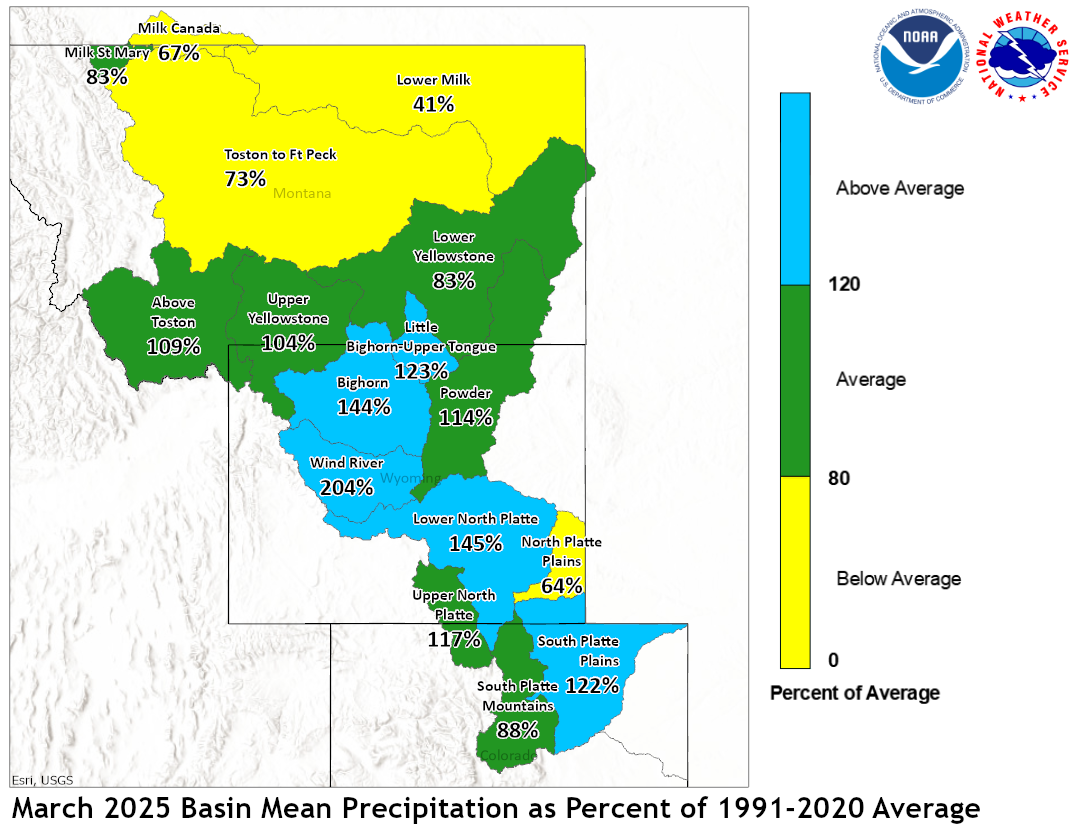
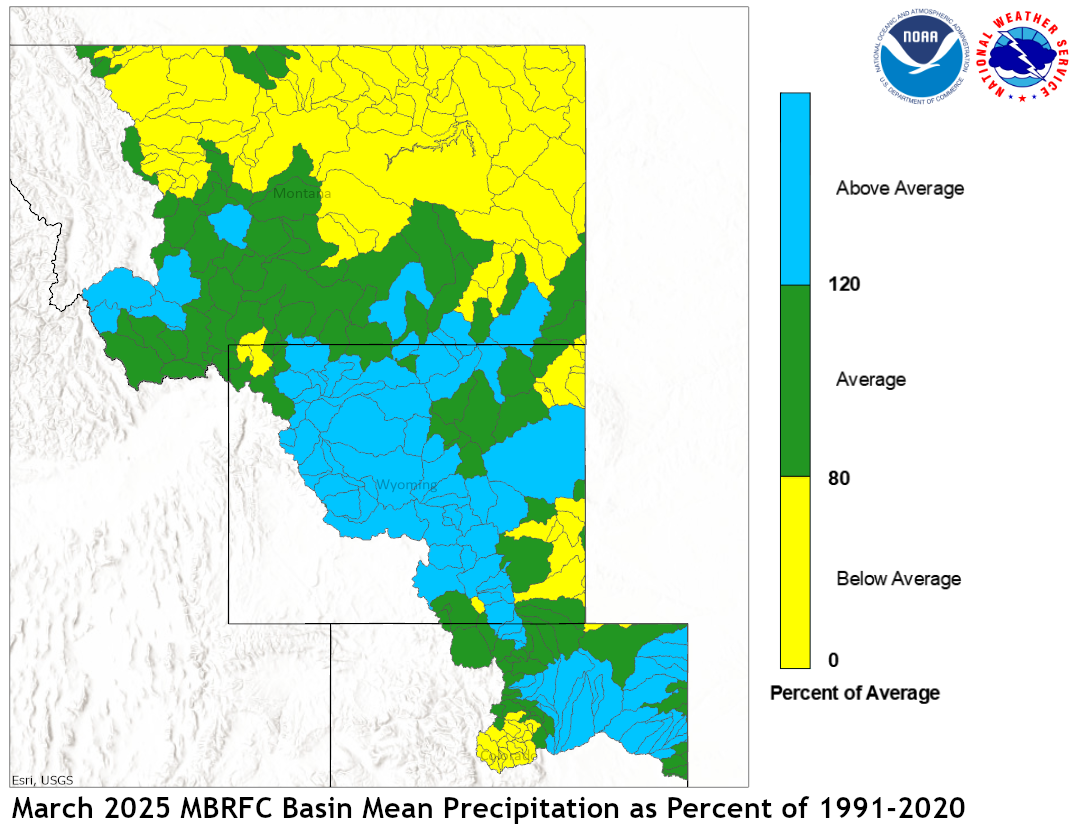
March precipitation across the Upper Missouri Basin was near to below average.
Basin precipitation summaries for the Missouri Basin include: Milk St. Mary,
83 percent; Milk Canada, 67 percent; Lower Milk, 41 percent; above Toston,
109 percent; Toston to Ft. Peck, 73 percent.
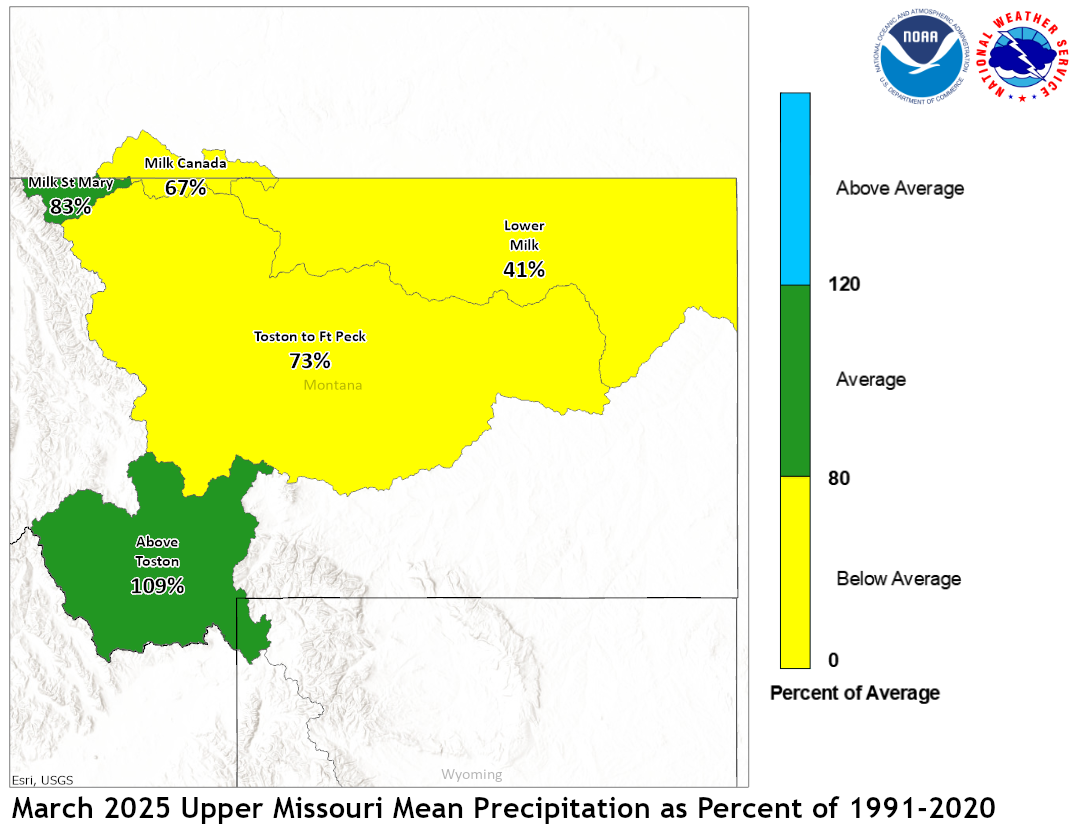
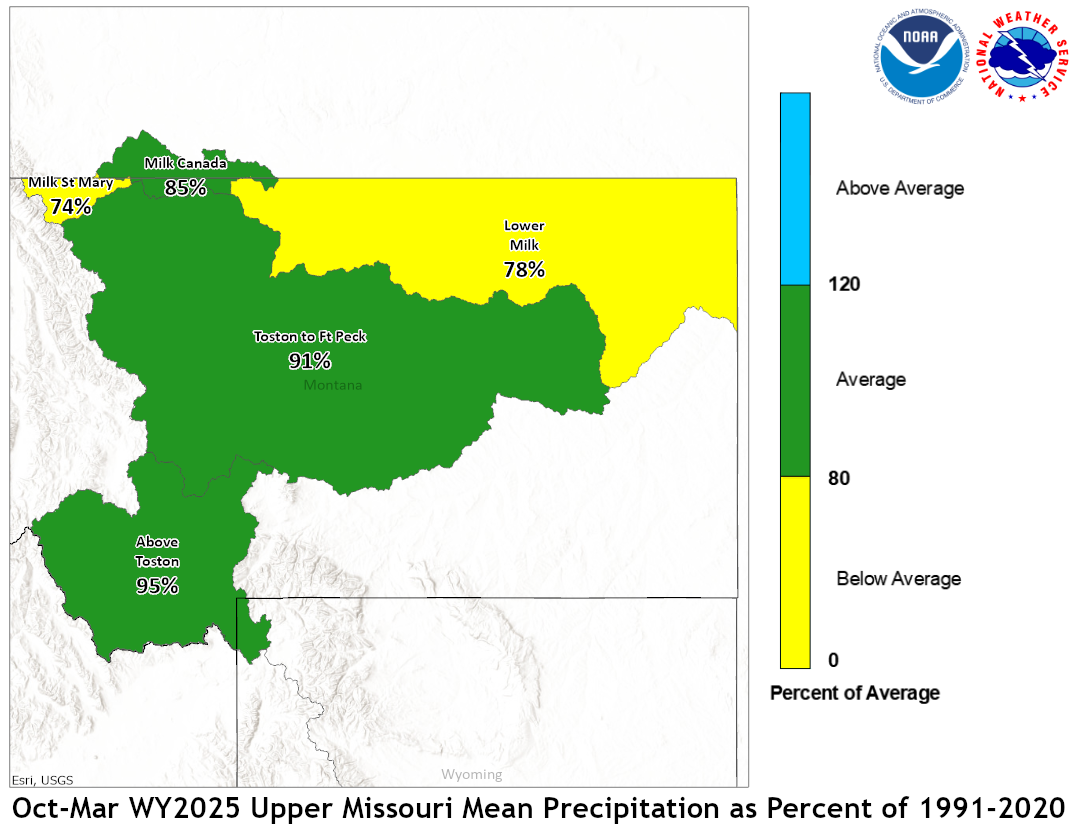
March 2025 Upper Missouri Mean Precip Oct-Mar WY2025 Upper Missouri Mean Precip
Stream flow in the Upper Missouri Basin is forecast to be
below average during the upcoming Spring and Summer.
The St. Mary River is forecast to have 62 percent of average
April-September flows. Runoff is expected to range around
87 percent of average for the Missouri Basin above Fort Peck,
Montana.
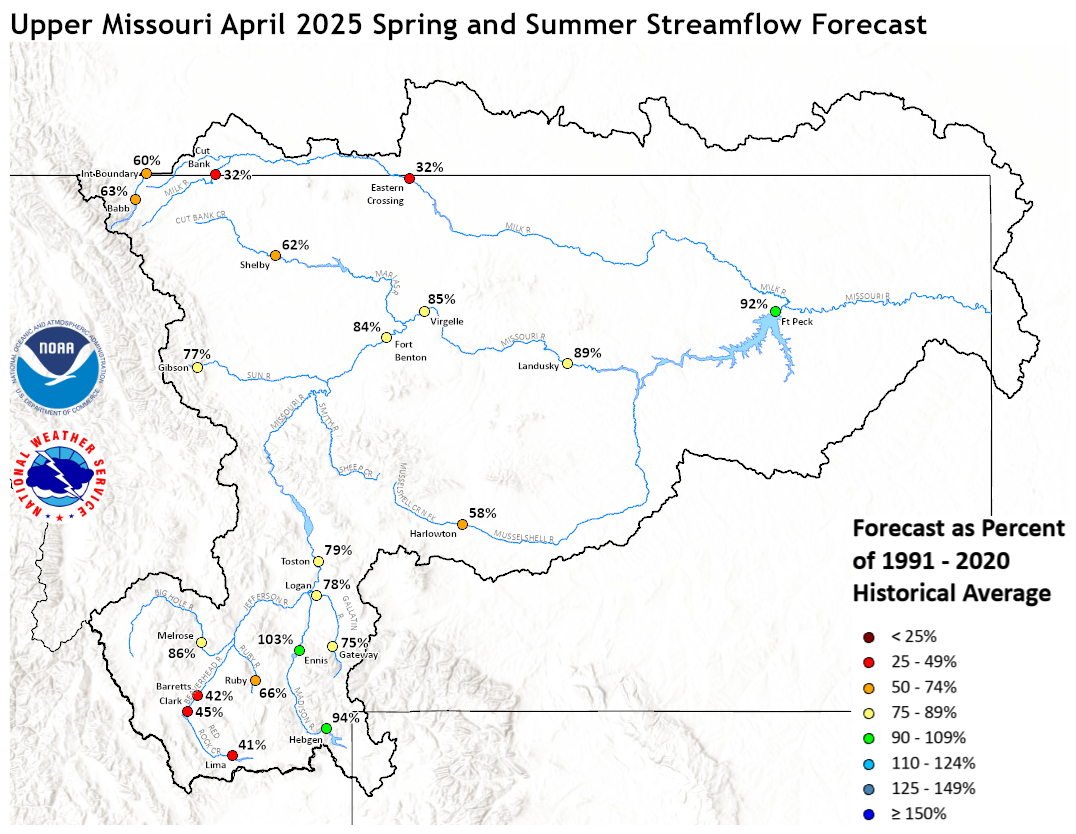
Upper Missouri April 1, 2025 Spring and Summer Streamflow Forecasts
Of the four major irrigation reservoirs in Montana; Lima
Reservoir had 93 percent average storage, Clark Canyon was
holding 110 percent of average water, Gibson Reservoir had 28
percent of average stored water, and Fresno Reservoir had
63 percent of average stored water.
Yellowstone Basin
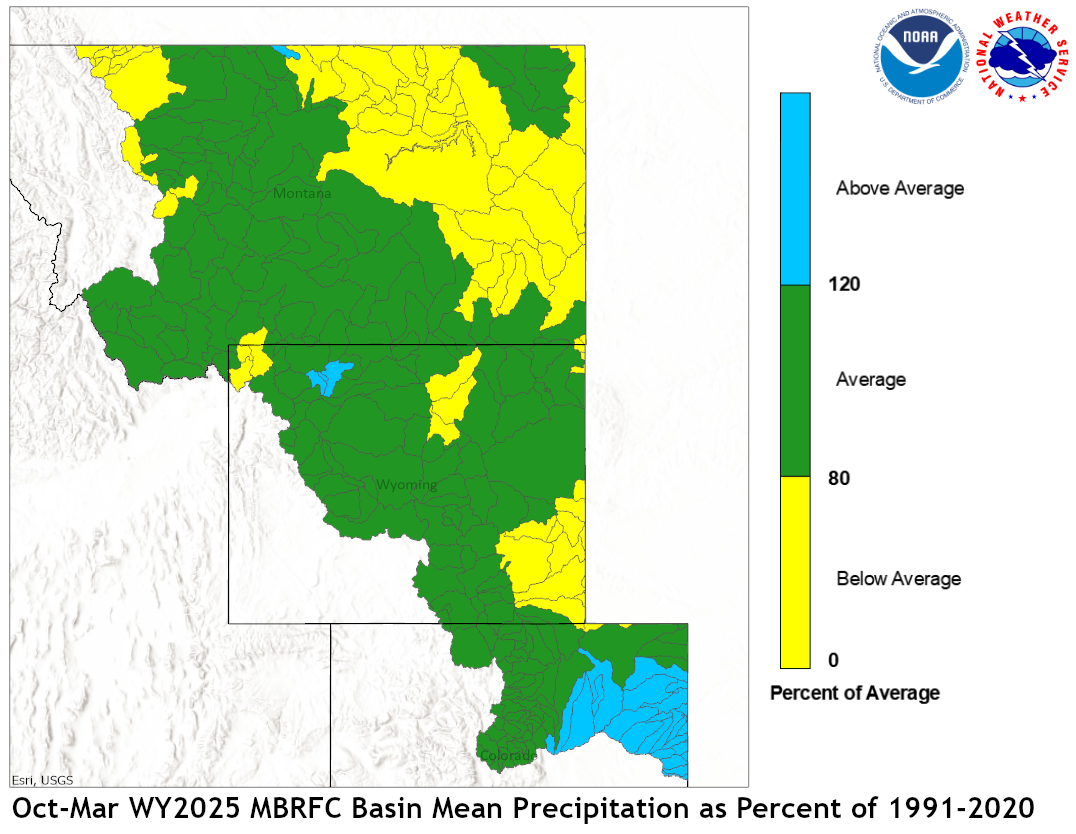
The high elevation snow pack in the Yellowstone Basin was above to near average
on April 1. The snow pack in the Upper Yellowstone Basin was 99 percent
of average. The snow packs in the Wind, Bighorn, and Shoshone Basins were 111,
103, and 96 percent of average, respectively. The snow packs in the Tongue
and Powder basins were 100 and 90 percent of average, respectively.
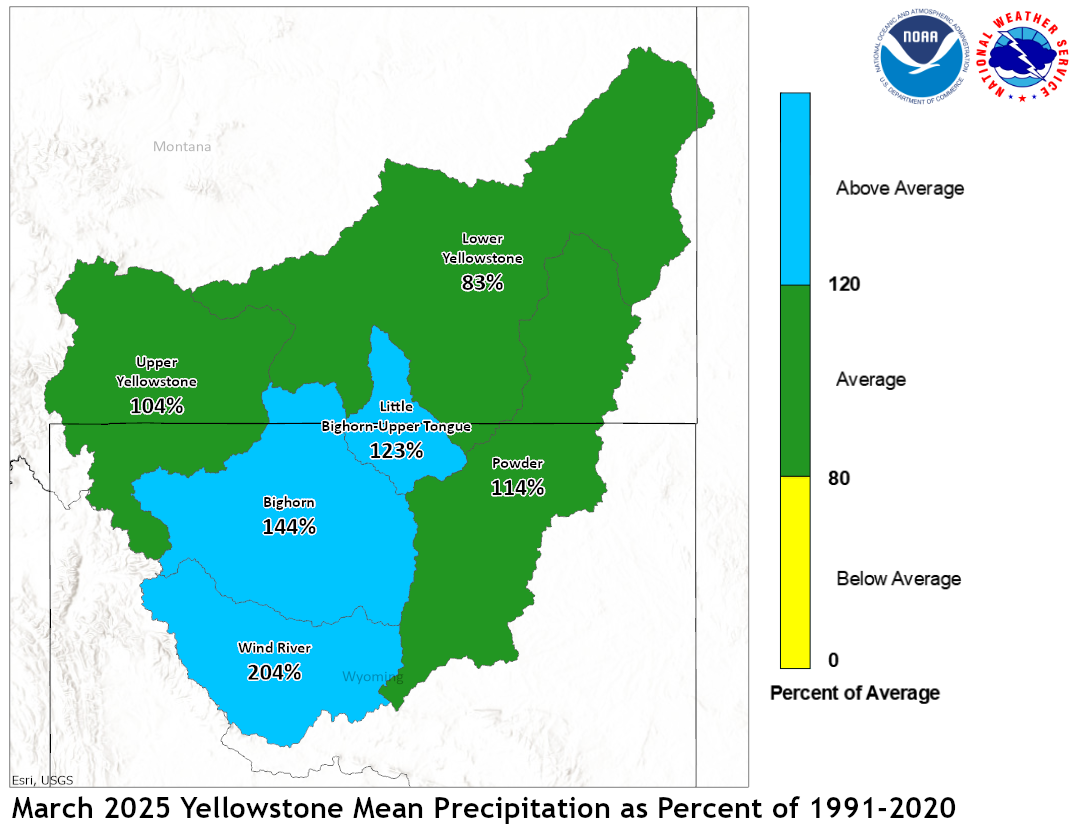
Precipitation during March ranged from above to above average. The
upper Yellowstone River Basin received 104 percent of average precipitation
while the Lower Yellowstone River Basin reported 83 percent of average. The
Bighorn Basin received 144 percent of average precipitation while the
Wind River Basin received 204 percent of average. The Little Bighorn -
Upper Tongue Basin received 123 percent of average and the Powder River
had 114 percent of average precipitation.
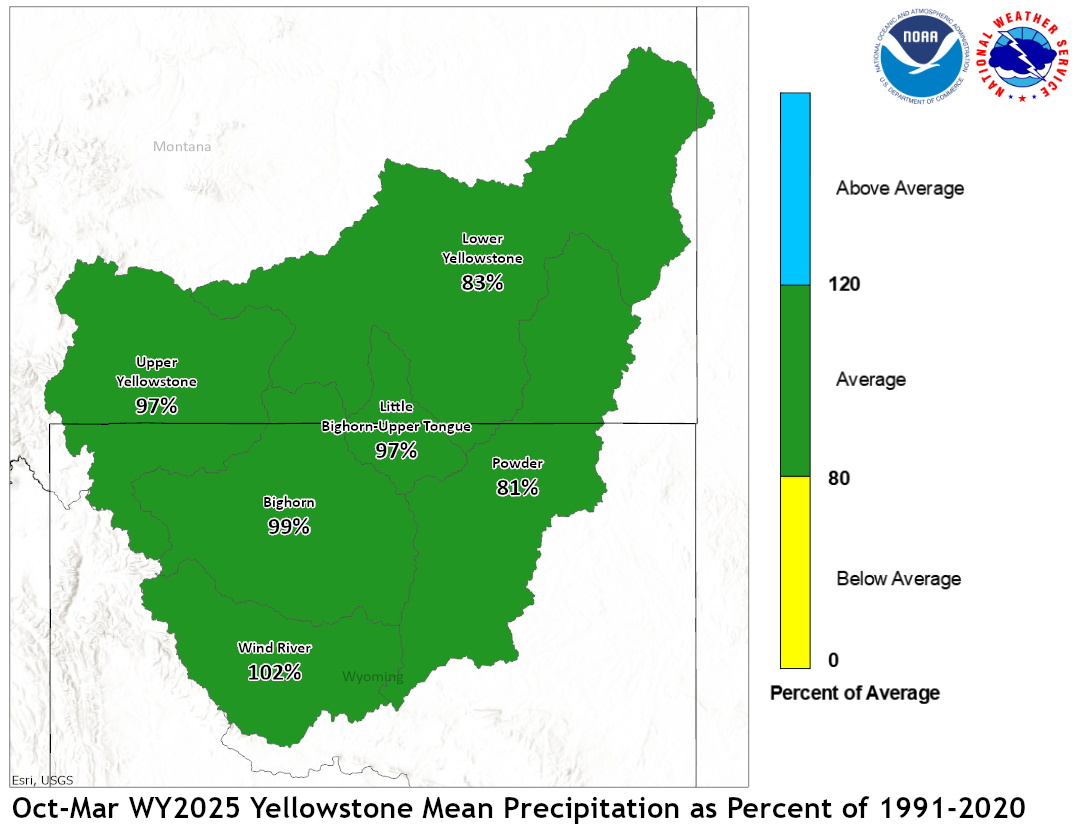
March 2025 Yellowstone Mean Precip Oct-Mar WY2025 Yellowstone Mean Precip
Forecast streamflow in the Yellowstone Basin is below average
for the upcoming Spring and Summer. Stream flow for the
Yellowstone River above Sidney, Montana is forecast to be about
70 percent of average. Flow in the Tongue Basin is expected to be
83 percent of average. Flows in the Powder River are expected
to be about 50 percent of average.
Monthend storage at Boysen Reservoir was 89 percent of average.
Stored water in Buffalo Bill Reservoir was 89 percent of average.
Monthend storage was 98 percent of average at Bighorn Reservoir.
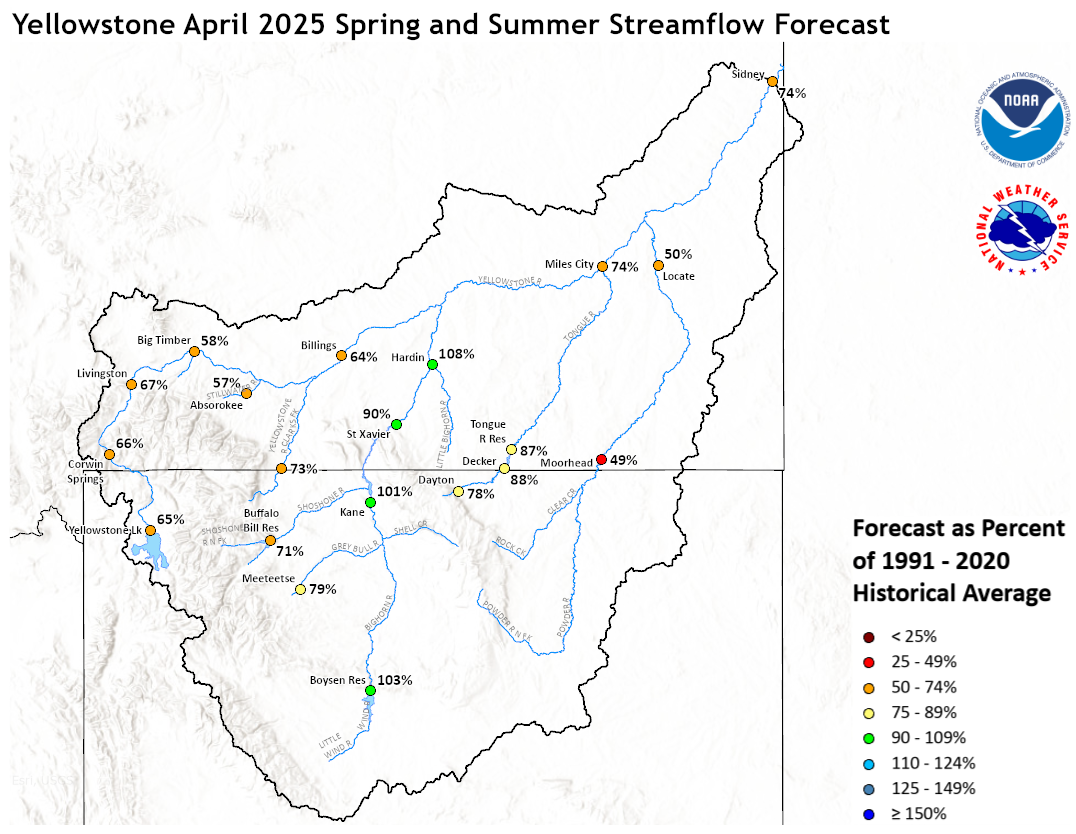
Yellowstone April 1, 2025 Spring and Summer Streamflow Forecasts
Platte Basin
The high elevation snow pack in the Upper North Platte Basin was
103 percent of average on April 1. The snow pack in the North Platte
Basin below Seminoe Reservoir was 98 percent of average. The snow
pack in the South Platte Basin was 97 percent of average.
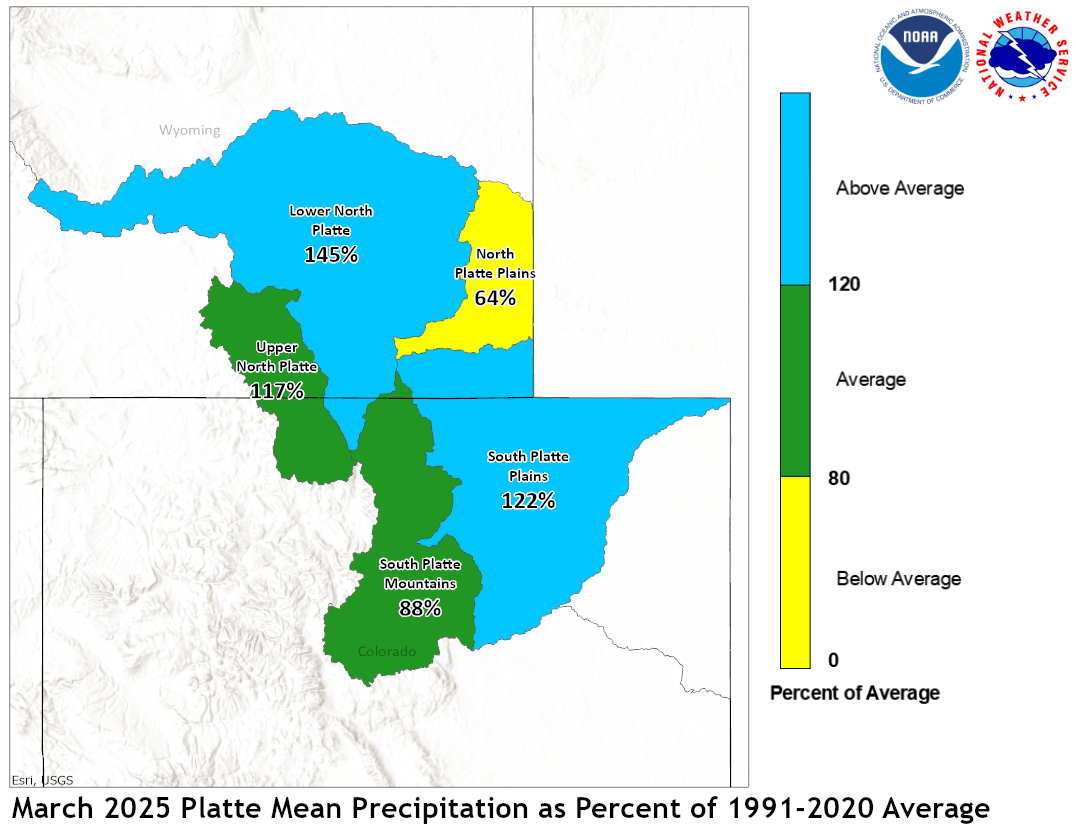
Precipitation during March in the Upper North Platte Basin was 117
percent of average. In the Lower North Platte Basin, precipitation
was 145 percent of average. The North Platte Plains below Guernsy
Reservoir had 64 percent. The South Platte Mountains had 88
percent whereas the Plains had 122 percent of average March
precipitation.
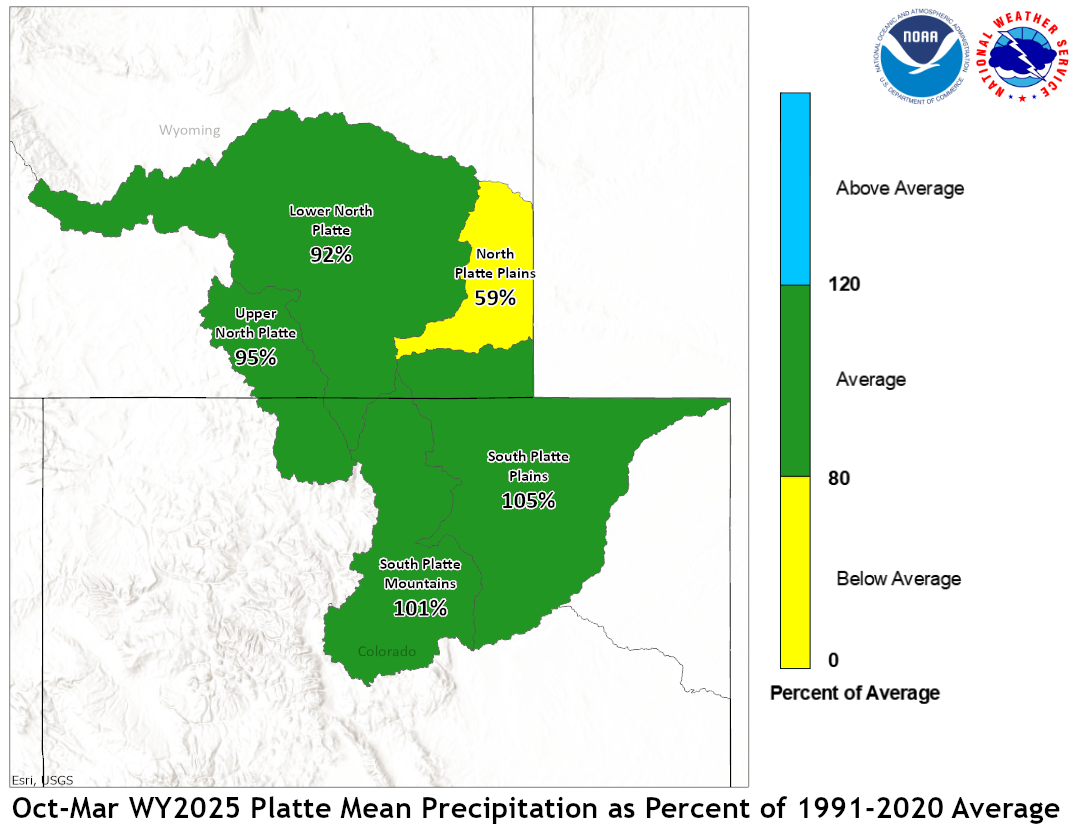
March 2025 Platte Mean Precip Oct-Mar WY2025 Platte Mean Precip
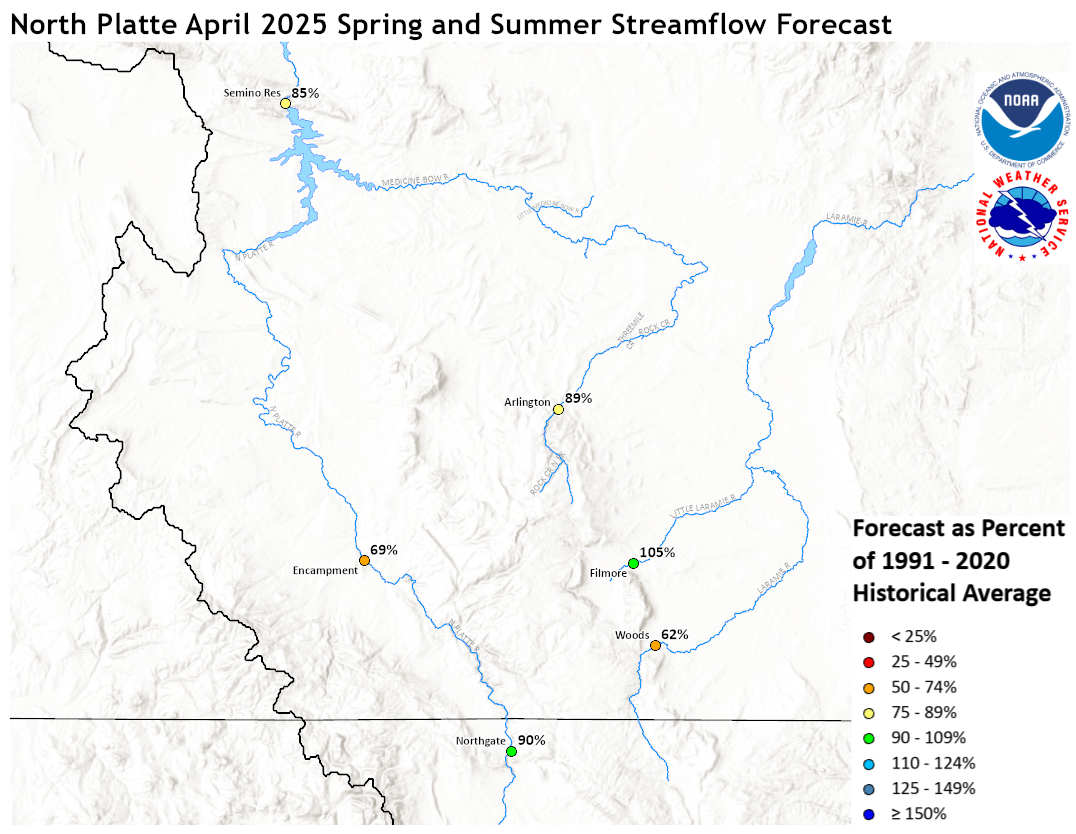
Stream flow in the Platte Basin is forecast to range from
below to above average during the upcoming Spring and Summer.
Runoff for streams above Seminoe Reservoir are expected to be
about 70 percent of average. Streams in the South Platte
Basin above South Platte, Colorado can expect 88 percent
of average flow. For the remainder of the South Platte
basin, flows are expected near 87 percent.
Stored water in the South Platte Basin was 102 percent of average
on April 1.
North Platte Streamflow Fcst South Platte Streamflow Fcst
WATER SUPPLY FORECAST
NWS MISSOURI BASIN RIVER FORECAST CENTER
PLEASANT HILL MISSOURI

1403 CDT SUNDAY APRIL 06, 2025

DATA CURRENT AS OF: APRIL 01, 2025

MISSOURI/YELLOWSTONE/PLATTE RIVER BASIN FORECASTS


                                          50%   %   10%   90%   AVG
FORECAST POINT                   PERIOD  (KAF) AVG (KAF) (KAF) (KAF)
--------------------------------------------------------------------

Boysen Resvr Inflow              Apr-Sep  387   54   735  194    720
 SBDW4

Boysen Resvr Inflow              Apr-Sep  916  103  1424  589    890
 SBDW4N

Bighorn R at Kane                Apr-Sep  810   82  1262  545    985
 LVEW4

Bighorn R at Kane                Apr-Sep 1461  101  2190  941   1440
 LVEW4N

Greybull R at Meeteetse          Apr-Sep  162   83   290   98    196
 MEEW4

Greybull R at Meeteetse          Apr-Sep  162   79   290   98    205
 MEEW4N

Buffalo Bill Resvr Inflow        Apr-Sep  564   69   752  427    815
 CDYW4

Buffalo Bill Resvr Inflow        Apr-Sep  649   71   830  510    910
 CDYW4N

Keyhole Resvr Inflow             Apr-Sep   10  250    37    3      4
 KEYW4

St. Mary R nr Babb               Apr-Sep  356   77   409  307    460
 SMYM8

St. Mary R nr Babb               Apr-Sep  338   63   394  290    535
 SMYM8N

St. Mary R at Intl Boundary      Apr-Sep  412  106   500  354    390
 SMBM8

St. Mary R at Intl Boundary      Apr-Sep  397   60   485  337    660
 SMBM8N

Milk R nr Western Crossing       Apr-Sep    9    8    32    5    113
 PDBM8

Milk R nr Western Crossing       Apr-Sep   13   32    45    6     41
 PDBM8N

Milk R nr Eastern Crossing       Apr-Sep   13    6    93    7    215
 ERNM8

Milk R nr Eastern Crossing       Apr-Sep   36   32   149   18    112
 ERNM8N

North Platte R nr Northgate      Apr-Sep  210   86   318  138    245
 NGTC2

North Platte R nr Northgate      Apr-Sep  265   90   373  188    295
 NGTC2N

Encampment R nr Encampment       Apr-Sep  103   66   140   76    156
 ECRW4

Encampment R nr Encampment       Apr-Sep  114   69   151   87    166
 ECRW4N

Rock Cr nr Arlington             Apr-Sep   47   89    56   37     53
 KCRW4

Rock Cr nr Arlington             Apr-Sep   47   89    57   37     53
 KCRW4N

Seminoe Resvr Inflow             Apr-Sep  605   79   830  422    765
 SETW4

Seminoe Resvr Inflow             Apr-Sep  780   85   986  585    920
 SETW4N

Laramie R nr Woods Landing       Apr-Sep   53   49    80   27    108
 WODW4

Laramie R nr Woods Landing       Apr-Sep   88   62   115   55    142
 WODW4N

Little Laramie R nr Filmore      Apr-Sep   58  105    71   44     55
 SMTW4

Little Laramie R nr Filmore      Apr-Sep   60  105    73   47     57
 SMTW4N

Antero Resvr Inflow              Apr-Sep   11   79    18    7     14
 ANRC2

Antero Resvr Inflow              Apr-Sep   11   79    18    7     14
 ANRC2N

Spinney Mountain Resvr Inflow    Apr-Sep   36   63    60   29     57
 SPYC2

Spinney Mountain Resvr Inflow    Apr-Sep   32   71    57   20     45
 SPYC2N

Elevenmile Canyon Resvr Inflow   Apr-Sep   36   61    47   31     59
 EVNC2

Elevenmile Canyon Resvr Inflow   Apr-Sep   35   70    61   21     50
 EVNC2N

Cheesman Lk Inflow               Apr-Sep   54   54    96   43    100
 CHEC2

Cheesman Lk Inflow               Apr-Sep   66   71   114   40     93
 CHEC2N

S Platte R at S Platte           Apr-Sep  319  133   476  299    240
 SPTC2

S Platte R at S Platte           Apr-Sep  135   66   250   92    205
 SPTC2N

Bear Cr at Morrison              Apr-Sep   32  123    58   18     26
 MRRC2

Bear Cr at Morrison              Apr-Sep   32  123    58   18     26
 MRRC2N

Clear Cr at Golden               Apr-Sep  101   86   154   77    118
 GLDC2

Clear Cr at Golden               Apr-Sep  114   87   170   88    131
 GLDC2N

St. Vrain Cr at Lyons            Apr-Sep   47   59    88   35     79
 LNSC2

St. Vrain Cr at Lyons            Apr-Sep   68   62   120   54    109
 LNSC2N

Boulder Cr nr Orodell            Apr-Sep   31   66    59   22     47
 OROC2

Boulder Cr nr Orodell            Apr-Sep   46   88    75   35     52
 OROC2N

S Boulder Cr nr Eldorado Sprgs   Apr-Sep   23   66    42   13     35
 BELC2

S Boulder Cr nr Eldorado Sprgs   Apr-Sep   23   58    54   13     40
 BELC2N

Cache La Poudre at Canyon Mouth  Apr-Sep  163  151   281  103    108
 FTDC2

Cache La Poudre at Canyon Mouth  Apr-Sep  210  100   329  137    210
 FTDC2N

Lima Resvr Inflow                Apr-Sep   32   42    52   26     76
 LRRM8

Lima Resvr Inflow                Apr-Sep   32   41    52   26     79
 LRRM8N

Clark Canyon Resvr Inflow        Apr-Sep   50   45    62   45    110
 CLKM8

Clark Canyon Resvr Inflow        Apr-Sep   89   45   125   76    198
 CLKM8N

Beaverhead R at Barretts         Apr-Sep  121   61   134  117    199
 BARM8

Beaverhead R at Barretts         Apr-Sep  119   42   159  106    280
 BARM8N

Ruby R Resvr Inflow              Apr-Sep   64   73    82   56     88
 ALRM8

Ruby R Resvr Inflow              Apr-Sep   64   66    82   56     97
 ALRM8N

Big Hole R nr Melrose            Apr-Sep  503   85   701  424    595
 MLRM8

Big Hole R nr Melrose            Apr-Sep  567   86   766  487    660
 MLRM8N

Hebgen Resvr Inflow              Apr-Sep  438   94   499  377    465
 HBDM8

Hebgen Resvr Inflow              Apr-Sep  438   94   499  377    465
 HBDM8N

Ennis Resvr Inflow               Apr-Sep  702   98   822  649    715
 ELMM8

Ennis Resvr Inflow               Apr-Sep  754  103   888  666    730
 ELMM8N

Gallatin R nr Gateway            Apr-Sep  358   75   447  297    475
 GLGM8

Gallatin R nr Gateway            Apr-Sep  358   75   447  297    475
 GLGM8N

Gallatin R at Logan              Apr-Sep  353   70   498  279    505
 LOGM8

Gallatin R at Logan              Apr-Sep  504   78   624  423    650
 LOGM8N

Missouri R at Toston             Apr-Sep 1514   73  2191 1307   2060
 TOSM8

Missouri R at Toston             Apr-Sep 2223   79  2895 1996   2830
 TOSM8N

Missouri R at Fort Benton        Apr-Sep 1878   61  2514 1737   3060
 FBNM8

Missouri R at Fort Benton        Apr-Sep 3443   84  4507 3024   4100
 FBNM8N

Missouri R nr Virgelle           Apr-Sep 2023   59  2676 1860   3420
 VRGM8

Missouri R nr Virgelle           Apr-Sep 3889   85  5027 3429   4560
 VRGM8N

Missouri R nr Landusky           Apr-Sep 2411   66  3190 2219   3680
 LDKM8

Missouri R nr Landusky           Apr-Sep 4335   89  5636 3887   4890
 LDKM8N

Missouri R below Fort Peck Dam   Apr-Sep 2741   71  3526 2493   3840
 FPKM8

Missouri R below Fort Peck Dam   Apr-Sep 4772   92  6102 4234   5180
 FPKM8N

Gibson Resvr Inflow              Apr-Sep  346   77   497  276    450
 AGSM8

Gibson Resvr Inflow              Apr-Sep  346   77   497  276    450
 AGSM8N

Marias R nr Shelby               Apr-Sep  257   59   411  193    435
 SHLM8

Marias R nr Shelby               Apr-Sep  305   62   459  238    490
 SHLM8N

Musselshell R at Harlowton       Apr-Sep   43   54    76   25     80
 HLWM8

Musselshell R at Harlowton       Apr-Sep   55   58    93   36     95
 HLWM8N

Yellowstone R at Yellowstone Lk  Apr-Sep  396   49   483  322    815
 YLOW4

Yellowstone R at Yellowstone Lk  Apr-Sep  548   65   652  430    840
 YLOW4N

Yellowstone R at Corwin Sprgs    Apr-Sep 1144   58  1436  985   1980
 CORM8

Yellowstone R at Corwin Sprgs    Apr-Sep 1366   66  1693 1153   2070
 CORM8N

Yellowstone R at Livingston      Apr-Sep 1290   56  1619 1108   2290
 LIVM8

Yellowstone R at Livingston      Apr-Sep 1628   67  2014 1376   2440
 LIVM8N

Yellowstone R at Billings        Apr-Sep 2086   51  2897 1678   4070
 BILM8

Yellowstone R at Billings        Apr-Sep 3079   64  3878 2620   4790
 BILM8N

Yellowstone R at Miles City      Apr-Sep 3375   58  4668 2799   5850
 MILM8

Yellowstone R at Miles City      Apr-Sep 5725   74  7238 4629   7690
 MILM8N

Yellowstone R at Sidney          Apr-Sep 3194   56  4616 2557   5710
 SIDM8

Yellowstone R at Sidney          Apr-Sep 5932   74  7590 4731   8060
 SIDM8N

Boulder R at Big Timber          Apr-Sep  174   52   259  133    335
 BTMM8

Boulder R at Big Timber          Apr-Sep  216   58   298  176    375
 BTMM8N

Stillwater R nr Absarokee        Apr-Sep  282   52   391  225    540
 SRAM8

Stillwater R nr Absarokee        Apr-Sep  339   57   447  285    595
 SRAM8N

Clks Fk Yellowstone R nr Belfry  Apr-Sep  434   70   560  359    620
 BFYM8

Clks Fk Yellowstone R nr Belfry  Apr-Sep  505   73   630  432    695
 BFYM8N

Bighorn R nr St. Xavier          Apr-Sep  961   67  1481  786   1430
 STXM8

Bighorn R nr St. Xavier          Apr-Sep 2215   90  3206 1555   2460
 STXM8N

Little Bighorn R nr Hardin       Apr-Sep  137  108   189   90    127
 HRDM8

Little Bighorn R nr Hardin       Apr-Sep  137  108   189   90    127
 HRDM8N

Tongue R nr Dayton               Apr-Sep   73   76   101   53     96
 DAYW4

Tongue R nr Dayton               Apr-Sep   79   78   107   58    101
 DAYW4N

Tongue R nr Decker               Apr-Sep  164   70   240  108    235
 DSLM8

Tongue R nr Decker               Apr-Sep  212   88   287  153    240
 DSLM8N

Tongue R Resvr Inflow            Apr-Sep  165   70   251  109    235
 DKRM8

Tongue R Resvr Inflow            Apr-Sep  213   87   298  153    245
 DKRM8N

Powder R at Moorhead             Apr-Sep   97   43   259   51    225
 MHDM8

Powder R at Moorhead             Apr-Sep  132   49   298   75    270
 MHDM8N

Powder R nr Locate               Apr-Sep  110   42   277   55    260
 LOCM8

Powder R nr Locate               Apr-Sep  152   50   343   84    305
 LOCM8N


Locations with an `N` suffix indicate natural flows excluding
stream augmentations.

KAF: Thousands of Acre-feet

%AVG: Current 50%/AVG

AVG: Average(50%) seasonal runoff voulme as simulated by the river
forecast model considering acontinuous simulation of the basin
response to historic climate data (observed precipitation and
temperatures) over the period of 1991-2020.

The 50%, 10% and 90% columns indicate the probability that the
actual volume will exceed the forecast for the valid time period.

Beginning April 1, May and June official forecasts include observed
runoff volume up to official forecast date.

For more information, please visit: www.weather.gov/mbrfc/water

