May 1, 2019 Spring and Summer Streamflow Forecasts
Upper Missouri Basin
The high elevation snow pack in the Upper Missouri Basin as of May 1
was near to above average. The snow pack above Fort Peck, Montana was
115 percent. The snow pack in the St. Mary Basin was 89 percent, and the
Milk River Basin was 92 percent.
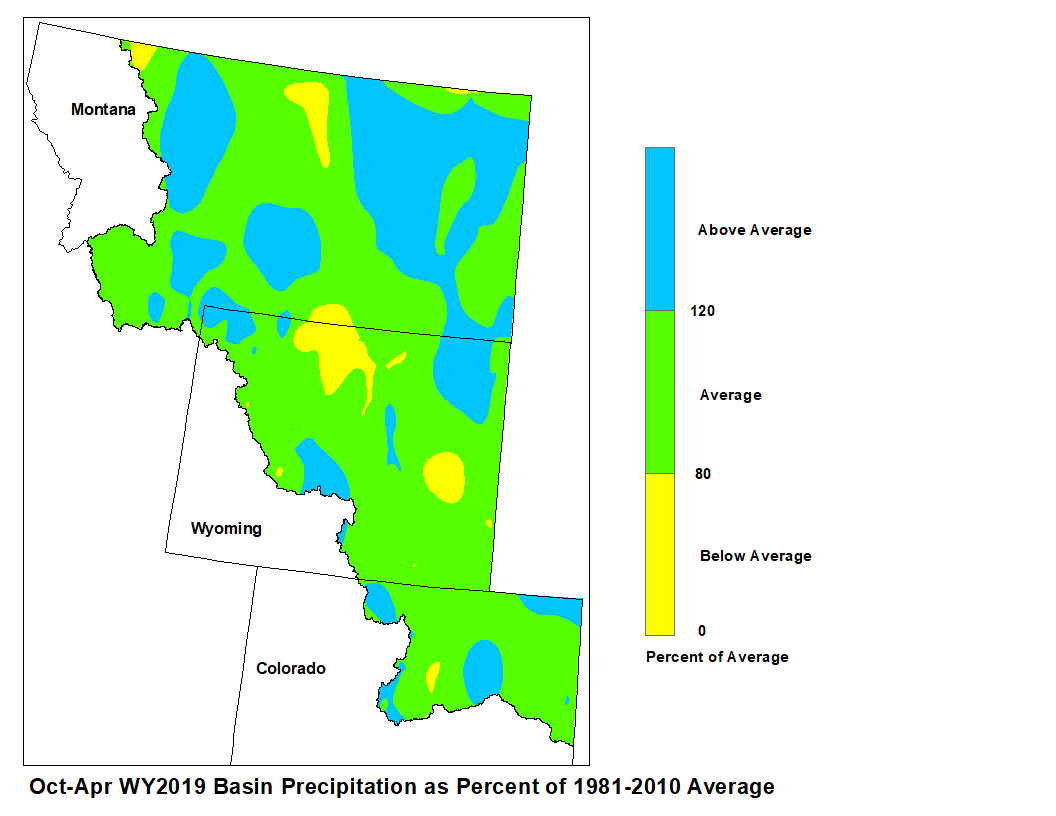
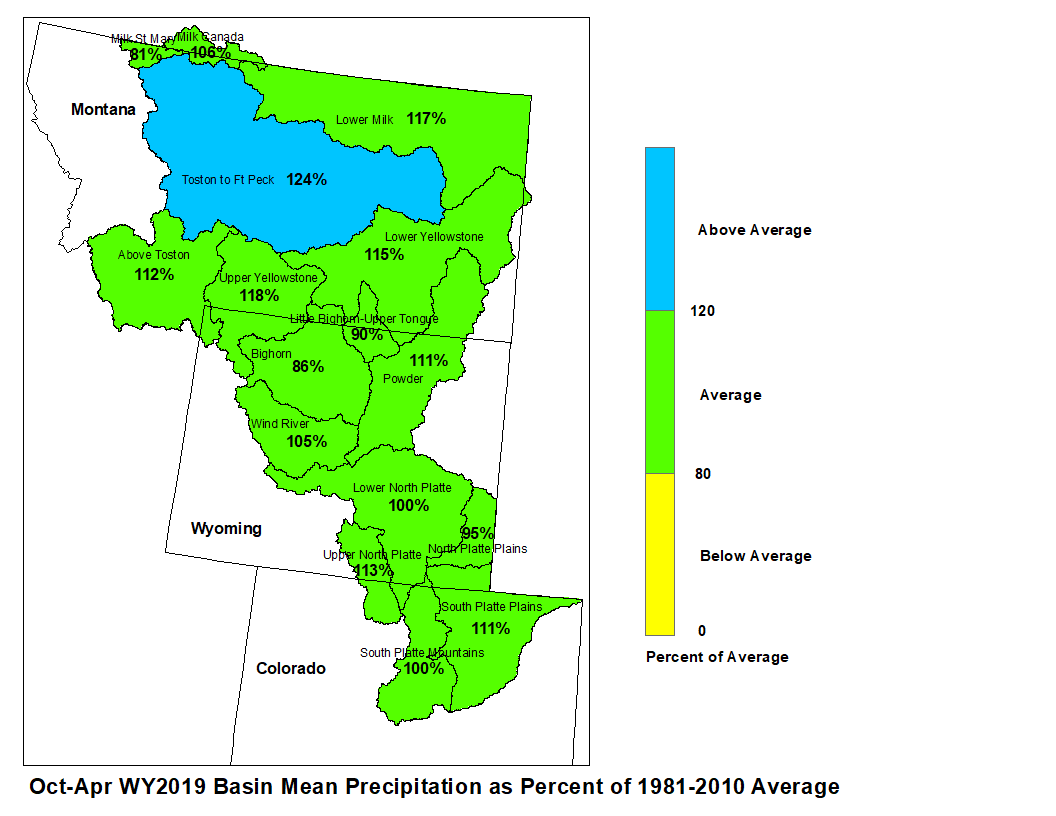
April precipitation across the Upper Missouri Basin was above average.
Basin precipitation summaries for the Missouri Basin include: Milk St. Mary,
111 percent; Milk Canada, 82 percent; Lower Milk, 113 percent; above Toston,
123 percent; Toston to Ft. Peck, 131 percent.
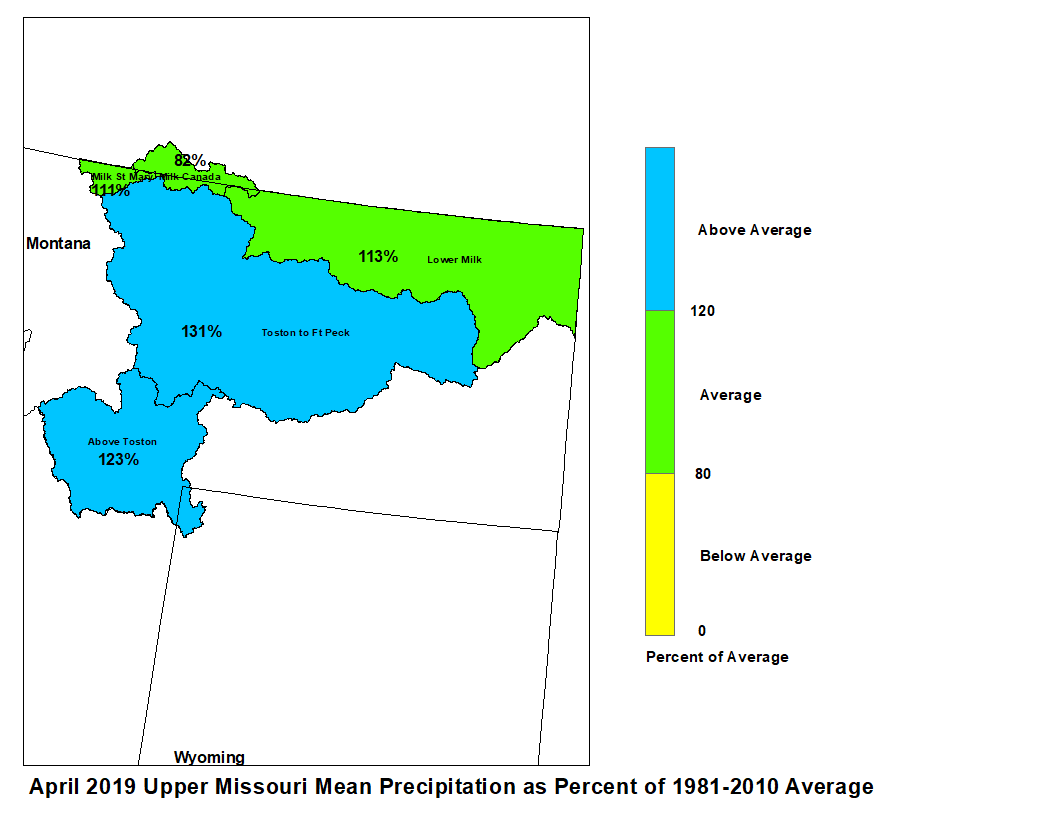
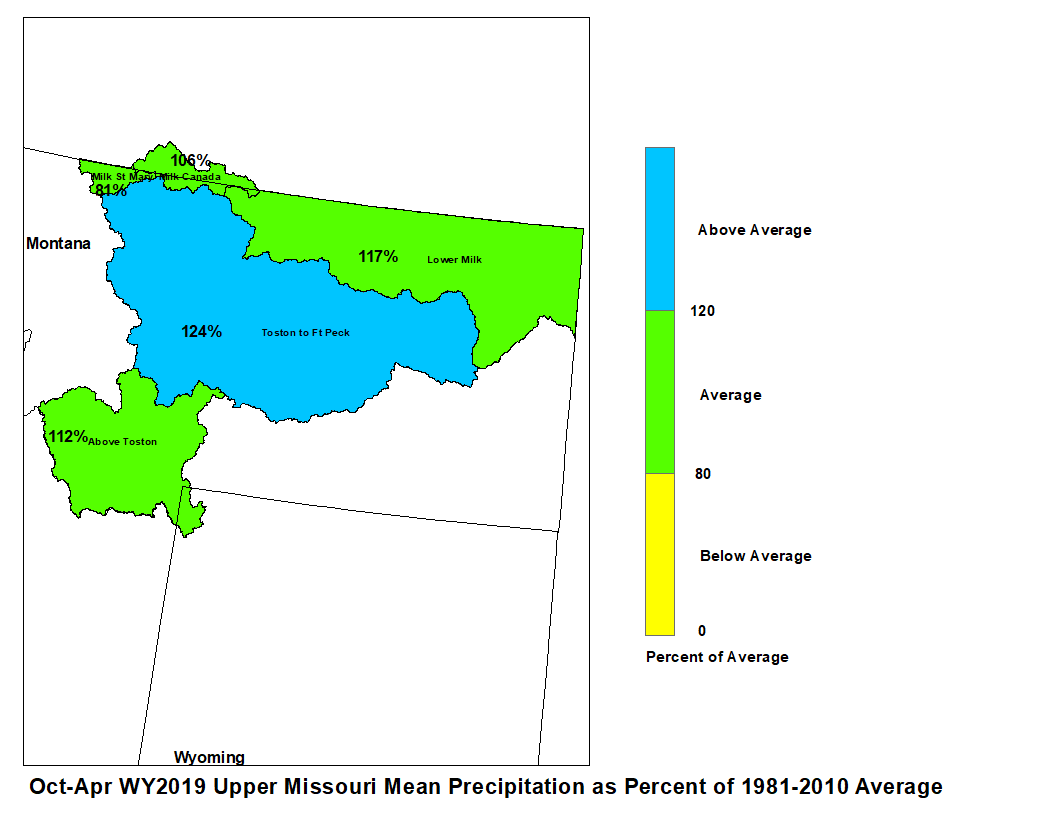
April 2019 Upper Missouri Mean Precip Oct-Apr WY2019 Upper Missouri Mean Precip
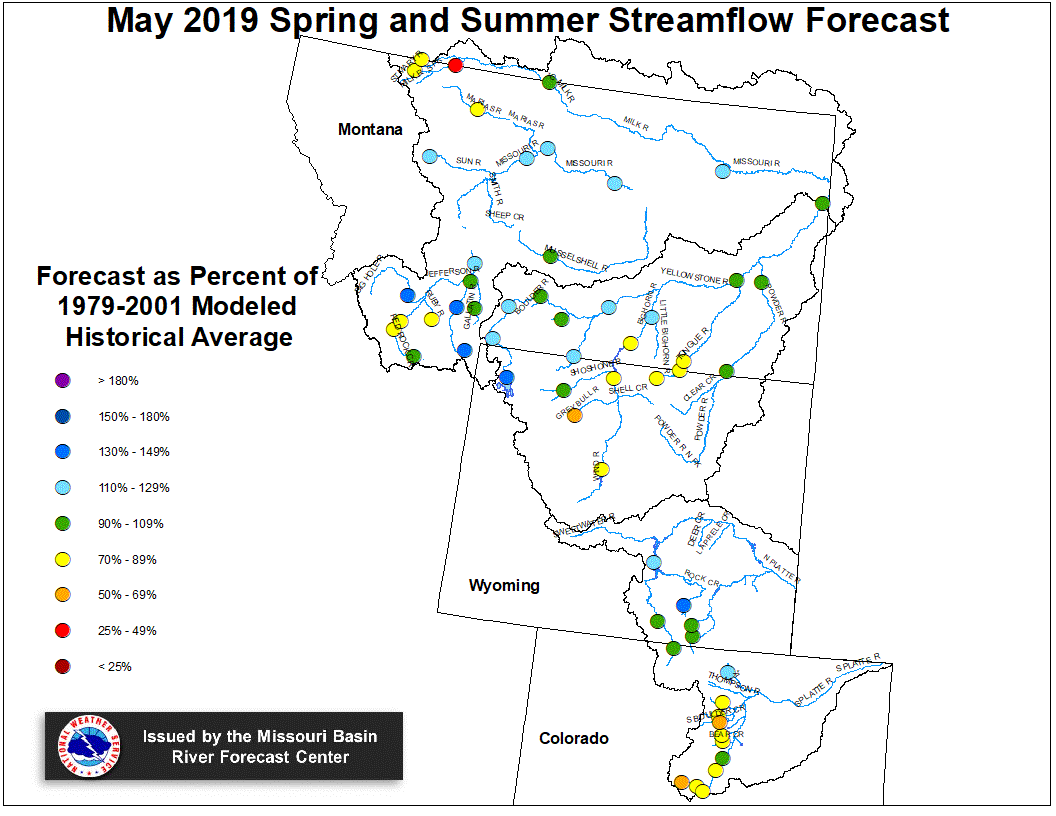
Stream flow in the Upper Missouri Basin is forecast to be
near to above average during the upcoming Spring and Summer.
The St. Mary River is forecast to have 81 percent of average
May-September flows. Runoff is expected to range around
122 percent of average for the Missouri Basin above Fort Peck,
Montana.
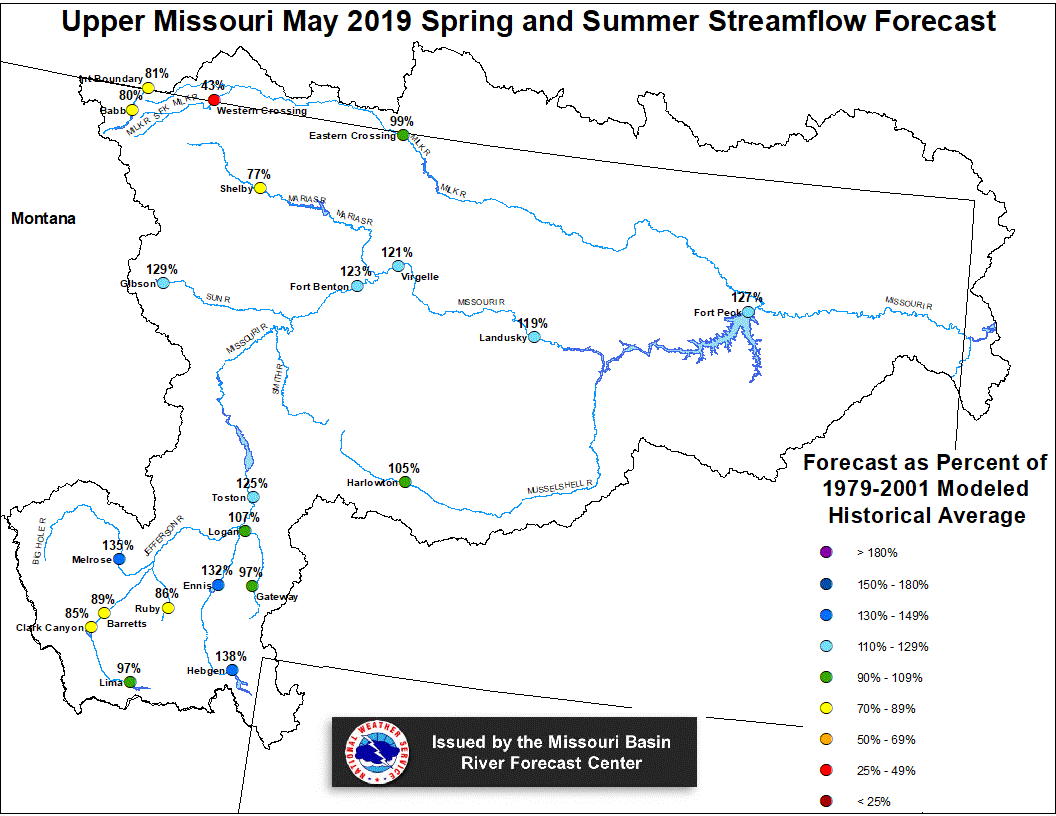
Upper Missouri May 1, 2019 Spring and Summer Streamflow Forecasts
Of the four major irrigation reservoirs in Montana; Lima
Reservoir had 121 percent average storage, Clark Canyon was
holding 124 percent of average water, Gibson Reservoir had 87
percent of average stored water, and Fresno Reservoir had
111 percent of average stored water.
The major hydroelectric reservoirs in Montana (Canyon Ferry and
Fort Peck), had monthend storage in the average to above
average range; 101 and 125 percent of average water, respectively.
Yellowstone Basin
The high elevation snow pack in the Yellowstone Basin was near to below average
on May 1. The snow pack in the Upper Yellowstone Basin was 103 percent
of average. The snow packs in the Wind, Bighorn, and Shoshone Basins were 108,
81, and 106 percent of average, respectively. The snow packs in the Tongue
and Powder basins were 73 and 76 percent of average, respectively.
Precipitation during April was near to above average. The upper Yellowstone
River Basin received 136 percent of average precipitation while the
Lower Yellowstone River Basin reported 131 percent of average. The
Bighorn Basin received 89 percent of average precipitation while the
Wind River Basin received 135 percent of average. The Little Bighorn -
Upper Tongue Basin received 95 percent of average and the Powder River
had 105 percent of average precipitation.
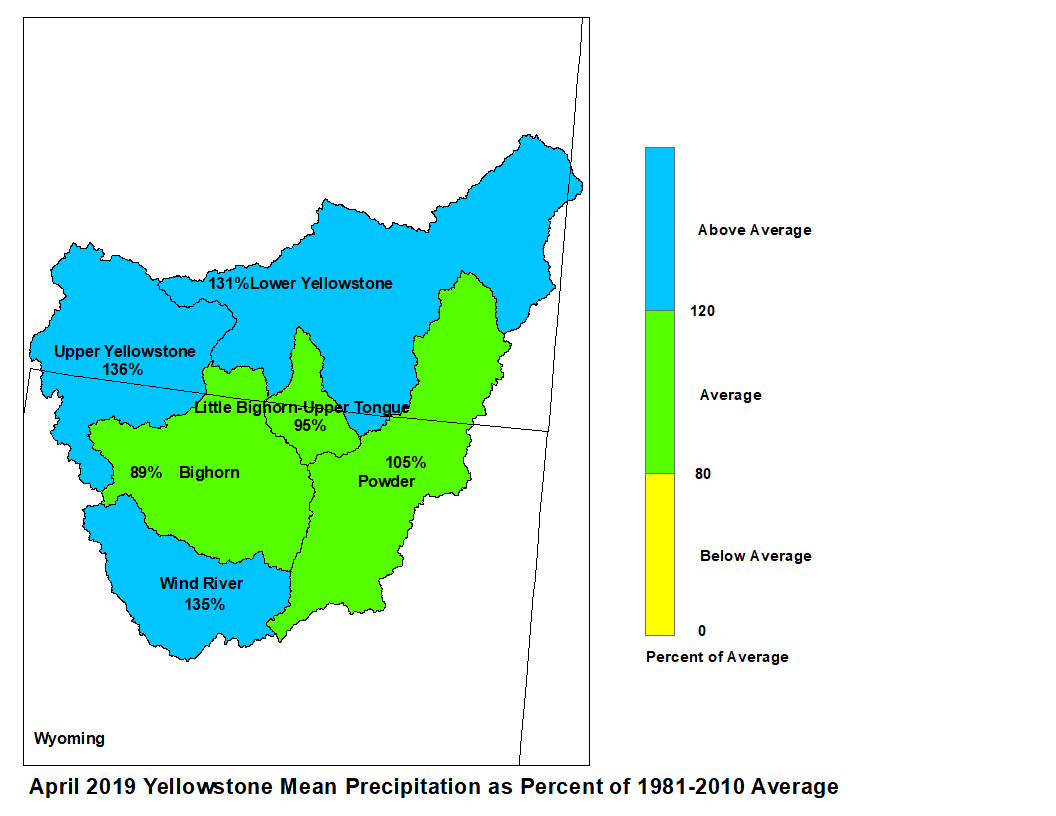
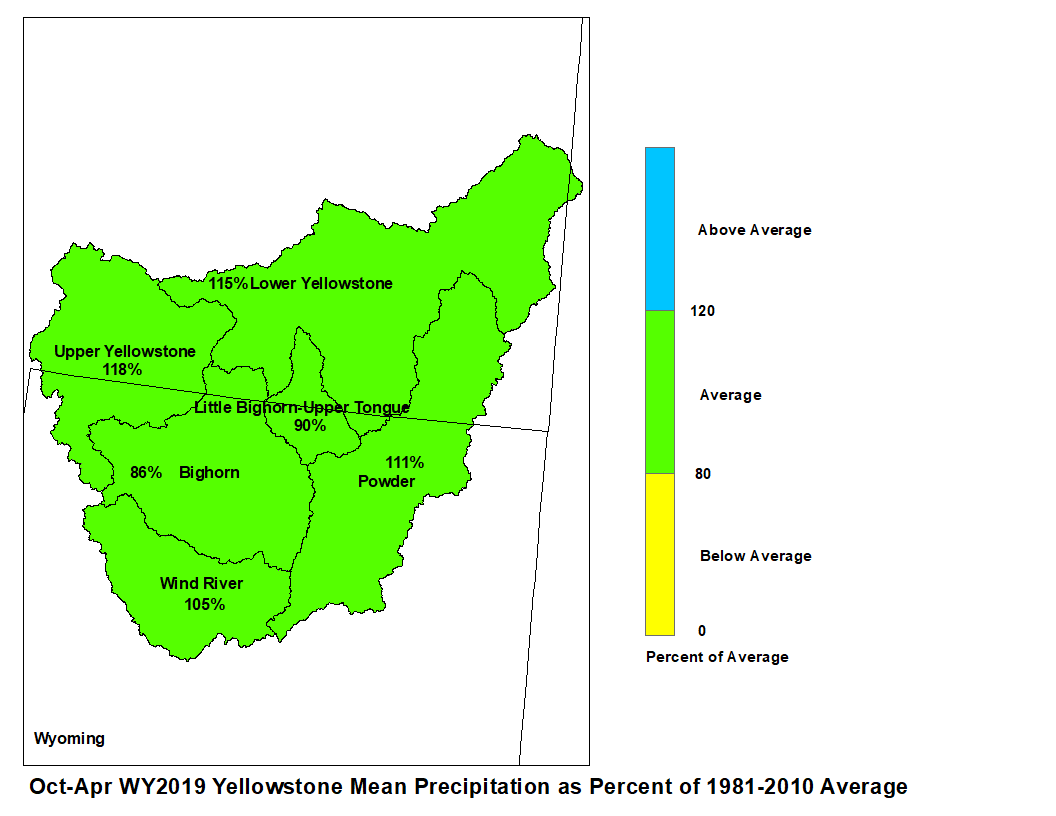
April 2019 Yellowstone Mean Precip Oct-Apr WY2019 Yellowstone Mean Precip
Forecast stream flow in the Yellowstone Basin is near average
for the upcoming Spring and Summer. Stream flow for the
Yellowstone River above Sidney, Montana is forecast to be about
115 percent of average. Flow in the Tongue Basin is expected to be
80 percent of average. Flows in the Powder River are expected
to be about 93 percent of average.
Monthend storage at Boysen Reservoir was 113 percent of average.
Stored water in Buffalo Bill Reservoir was 118 percent of average.
Monthend storage was 100 percent of average at Bighorn Reservoir.
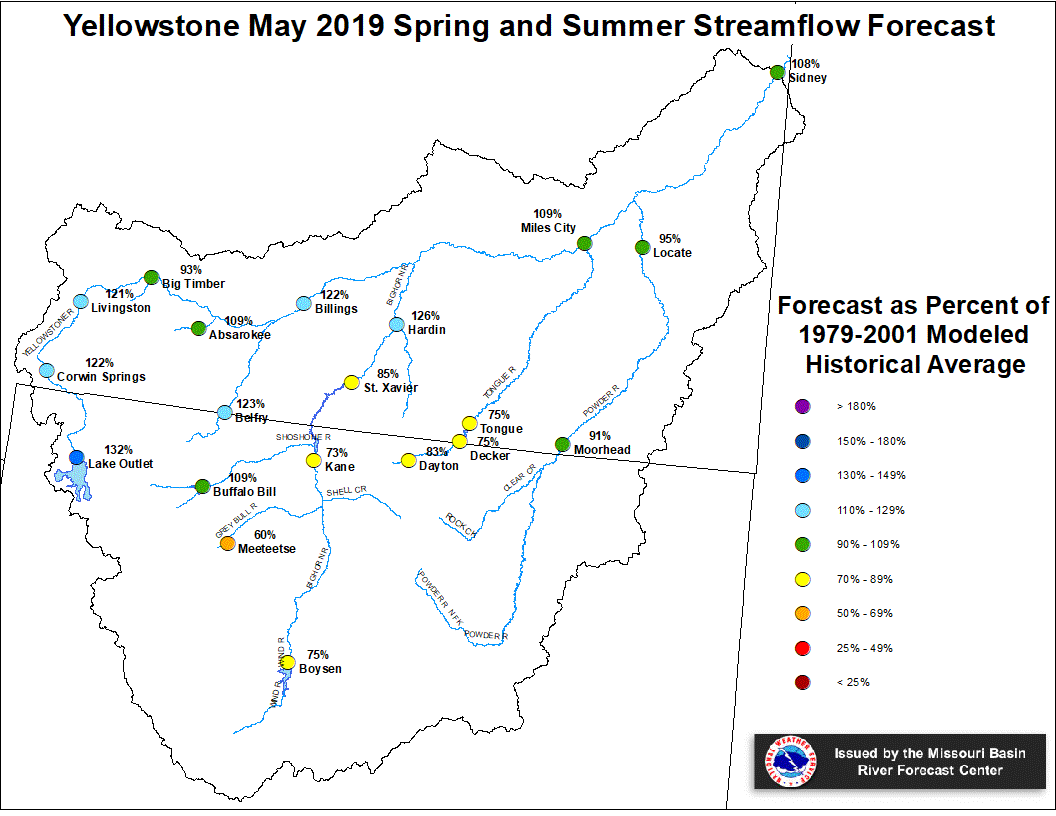
Yellowstone May 1, 2019 Spring and Summer Streamflow Forecasts
Platte Basin
The high elevation snow pack in the Upper North Platte Basin was
105 percent of average on May 1. The snow pack in the North Platte
Basin below Seminoe Reservoir was 108 percent of average. The snow
pack in the South Platte Basin was 101 percent of average.
Precipitation during April in the Upper North Platte Basin was 115
percent of average. In the Lower North Platte Basin, precipitation
was 94 percent of average. The North Platte Plains below Guernsey
Reservoir had 77 percent. The South Platte Mountains had 75
percent whereas the Plains had 62 percent of average April
precipitation.
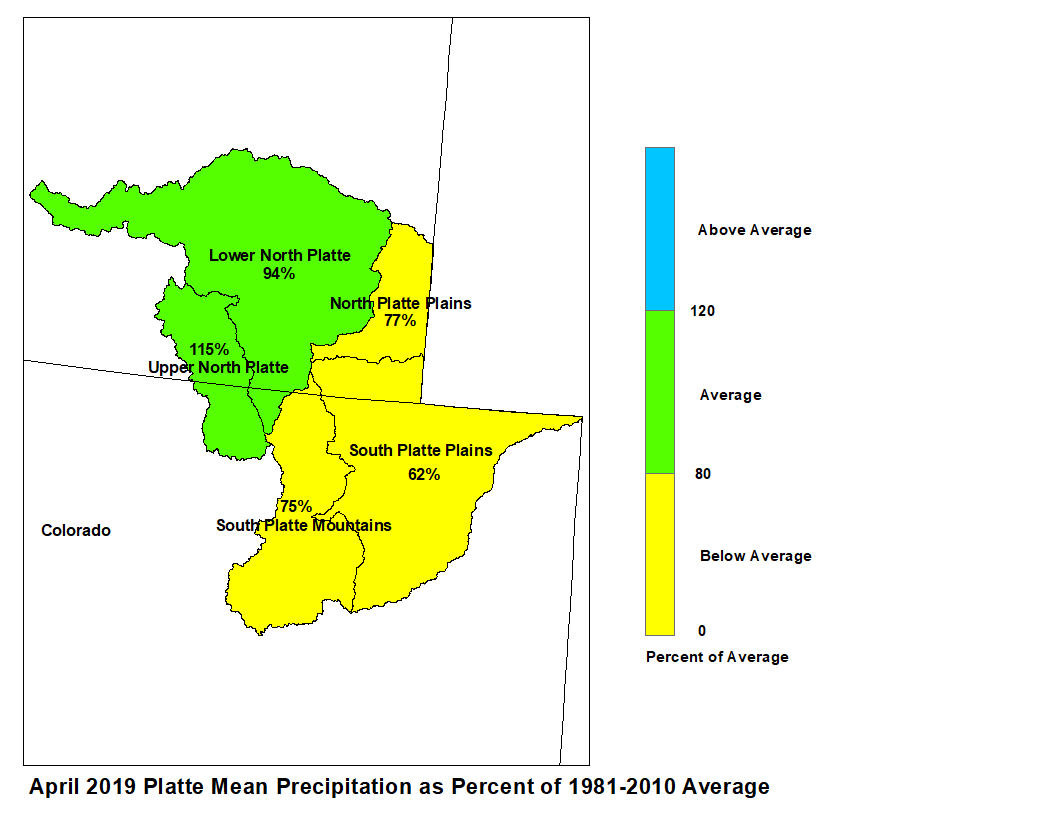
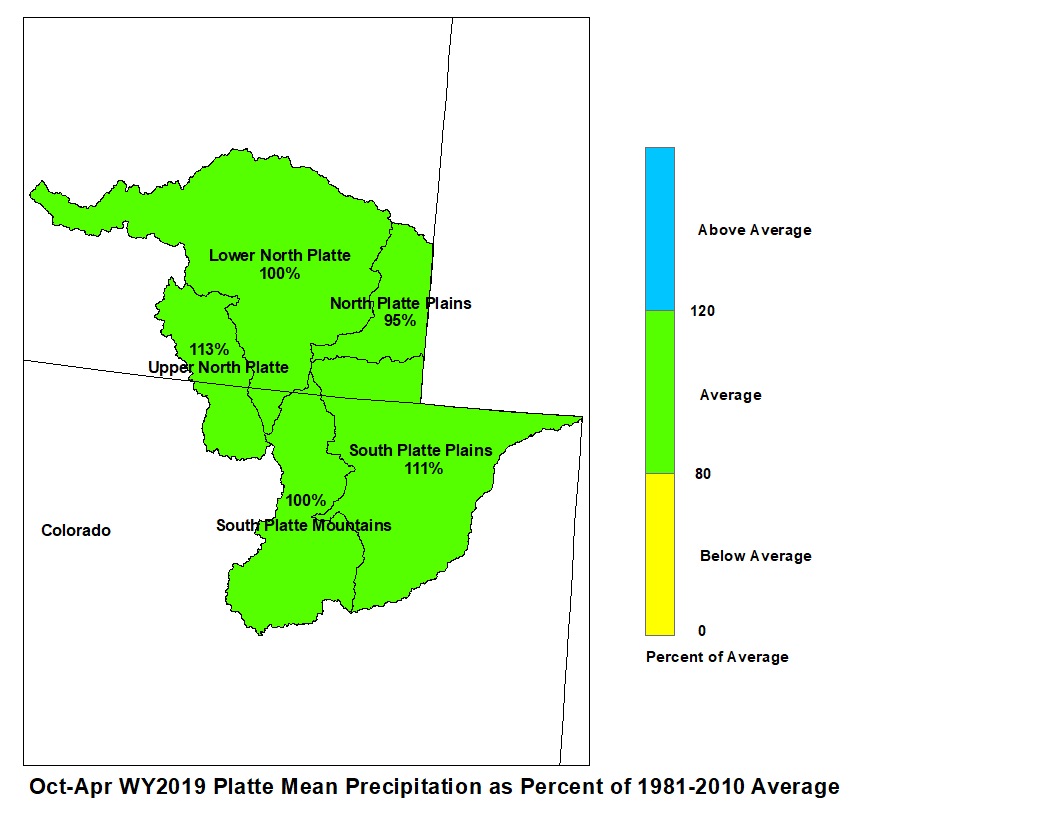
April 2019 Platte Mean Precip Oct-Apr WY2019 Platte Mean Precip
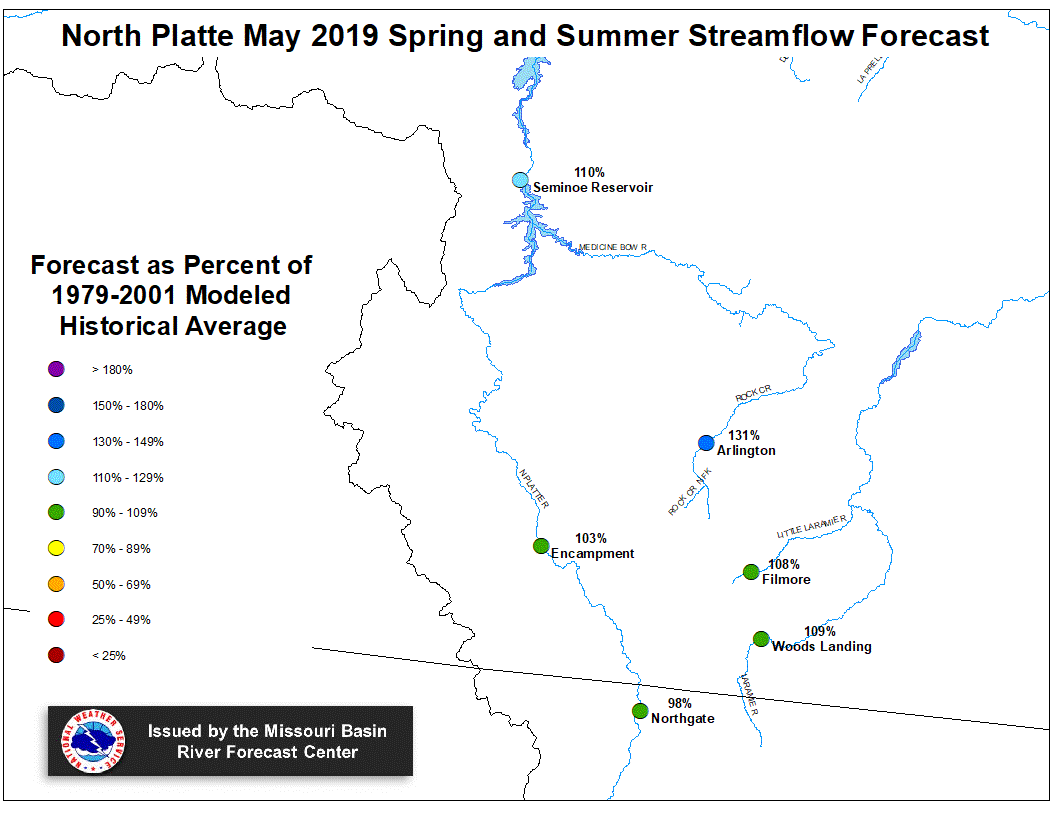
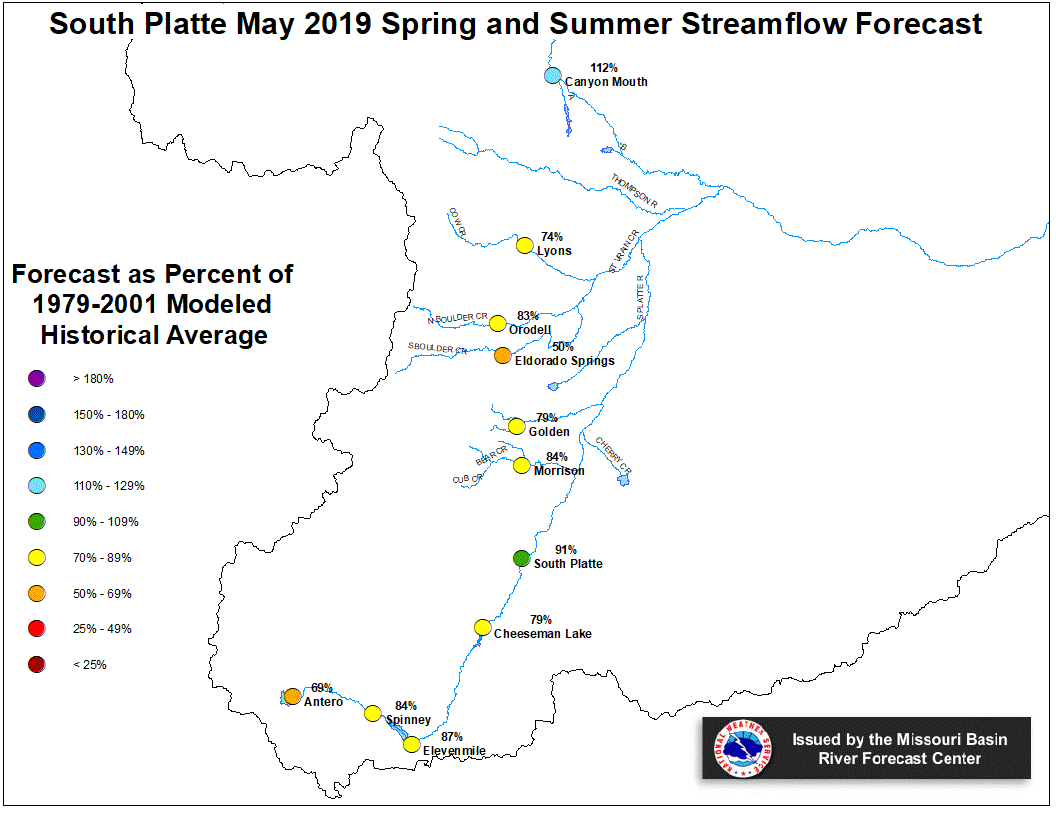
Stream flow in the Platte Basin is forecast to be near
average during the upcoming Spring and Summer. Runoff
for streams above Seminoe Reservoir are expected to be
about 111 percent of average. Streams in the South Platte
Basin above South Platte, Colorado can expect 91 percent
of average flow. For the remainder of the South Platte
basin, flows are expected near 80 percent.
Stored water in the South Platte Basin was 103 percent of average
on May 1.
North Platte Streamflow Fcst South Platte Streamflow Fcst
000
FGUS63 KKRF 012109
ESPKRF

WATER SUPPLY FORECAST
NWS MISSOURI BASIN RIVER FORECAST CENTER
PLEASANT HILL MISSOURI

1610 CDT WEDNESDAY MAY 01 2019

DATA CURRENT AS OF: MAY 01 2019

MISSOURI/YELLOWSTONE/PLATTE RIVER BASIN FORECASTS


                                        50%   %   10%   90%   AVG
                                PERIOD (KAF) AVG (KAF) (KAF) (KAF)
-------------------------------------------------------------------
BOYSEN RESERVOIR INFLOW         MAY-SEP 745  75%  1169  559   996
SBDW4N
BIGHORN R AT KANE               MAY-SEP 1138 73%  1724  858   1569
LVEW4N
GREYBULL R NR MEETEETSE         MAY-SEP 137  60%  211   95    228
MEEW4N
BUFFALO BILL RESERVOIR INFLOW   MAY-SEP 718  109% 881   590   660
CDYW4N
ST MARY R NR BABB               MAY-SEP 323  80%  395   273   404
SMYM8N
ST MARY R AT INT BOUNDARY       MAY-SEP 378  81%  470   318   465
SMBM8N
MILK R NR CUTBANK               MAY-SEP 12   43%  47    6     28
PDBM8N
MILK R AT EASTERN CROSSING      MAY-SEP 50   99%  122   29    50
ERNM8N
NORTH PLATTE R NR NORTHGATE     MAY-SEP 278  98%  397   210   283
NGTC2
ENCAMPMENT R NR ENCAMPMENT      MAY-SEP 140  103% 167   115   137
ERCW4
ENCAMPMENT R NR ENCAMPMENT      MAY-SEP 147  102% 174   122   144
ECRW4N
ROCK CK NR ARLINGTON            MAY-SEP 64   131% 72    57    49
KCRW4
ROCK CK NR ARLINGTON            MAY-SEP 64   131% 72    57    49
KCRW4N
SEMINOE RESERVOIR INFLOW WY     MAY-SEP 855  112% 1097  666   765
SETW4
SEMINOE RESERVOIR INFLOW WY     MAY-SEP 1014 110% 1258  834   918
SETW4N
LARAMIE R NR WOODS              MAY-SEP 69   111% 112   48    62
WODW4
LARAMIE R NR WOODS              MAY-SEP 104  109% 147   83    96
WODW4N
LITTLE LARAMIE R NR FILMORE     MAY-SEP 54   109% 69    44    50
SMTW4
LITTLE LARAMIE R NR FILMORE     MAY-SEP 56   108% 71    46    52
SMTW4N
ANTERO RESERVOIR INFLOW         MAY-SEP 10   69%  14    8     15
ANRC2N
SPINNEY MOUNTAIN RES INFLOW     MAY-SEP 40   84%  59    27    47
SPYC2N
ELEVENMILE CANYON RES INFLOW    MAY-SEP 44   87%  63    30    51
EVNC2N
CHEESMAN LAKE INFLOW            MAY-SEP 76   79%  107   60    96
CHEC2N
SOUTH PLATTE R AT SOUTH PLATTE  MAY-SEP 153  91%  210   126   169
SPTC2N
BEAR CK AT MORRISON             MAY-SEP 14   84%  19    10    16
MRRC2N
CLEAR CK AT GOLDEN              MAY-SEP 91   79%  114   80    116
GLDC2N
ST VRAIN CK AT LYONS            MAY-SEP 65   74%  87    56    87
LNSC2N
BOULDER CK NR ORODELL           MAY-SEP 38   83%  54    36    46
OROC2N
S BOULDER CK NR ELDORADO SPR    MAY-SEP 18   50%  29    14    35
BELC2N
CACHE LA POUDRE AT CANYON MOUTH MAY-SEP 212  112% 284   182   189
FTDC2N
LIMA RESERVOIR INFLOW           MAY-SEP 49   97%  77    34    51
LRRM8N
CLARK CANYON RESERVOIR INFLOW   MAY-SEP 99   85%  162   77    117
CLKM8N
BEAVERHEAD R AT BARRETTS        MAY-SEP 127  89%  198   103   143
BARM8N
RUBY R RESERVOIR INFLOW         MAY-SEP 67   86%  85    53    78
ALRM8N
BIG HOLE R NR MELROSE           MAY-SEP 590  139% 805   505   425
MLRM8
BIG HOLE R NR MELROSE           MAY-SEP 645  135% 860   560   478
MLRM8N
HEBGEN RESERVOIR INFLOW         MAY-SEP 462  138% 537   406   335
HBDM8N
ENNIS RESERVOIR INFLOW          MAY-SEP 792  132% 915   683   599
ELMM8N
GALLATIN R NR GATEWAY           MAY-SEP 406  97%  517   332   418
GLGM8
GALLATIN R NR GATEWAY           MAY-SEP 406  97%  517   332   418
GLGM8N
GALLATIN R AT LOGAN             MAY-SEP 419  108% 587   323   388
LOGM8
GALLATIN R AT LOGAN             MAY-SEP 558  107% 703   480   522
LOGM8N
MISSOURI R AT TOSTON            MAY-SEP 2646 125% 3214  284   2116
TOSM8N
MISSOURI R AT FORT BENTON       MAY-SEP 4067 123% 4991  557   3317
FBNM8N
MISSOURI R NR VIRGELLE          MAY-SEP 4478 121% 5662  951   3696
VRGM8N
MISSOURI R NR LANDUSKY          MAY-SEP 4690 119% 6298  144   3928
LDKM8N
MISSOURI R BLW FT PECK DAM      MAY-SEP 5322 127% 7153  669   4176
FPKM8N
GIBSON RESERVOIR INFLOW         MAY-SEP 400  129% 581   345   310
AGSM8N
MARIAS R NR SHELBY              MAY-SEP 250  77% 398    188   324
SHLM8N
MUSSELSHELL R AT HARLOWTON      MAY-SEP 93   105% 142   62    89
HLWM8N
YELLOWSTONE R AT YELLOWSTONE LK MAY-SEP 744  119% 825   635   625
YLOW4APR
YELLOWSTONE R AT YELLOWSTONE LK MAY-SEP 919  132% 1008  779   697
YLOW4N
YELLOWSTONE R AT CORWIN SPRINGS MAY-SEP 1696 116% 1956  508   1464
CORM8
YELLOWSTONE R AT CORWIN SPRINGS MAY-SEP 1976 122% 2225  749   1623
CORM8N
YELLOWSTONE R AT LIVINGSTON     MAY-SEP 1941 115% 2261  741   1680
LIVM8
YELLOWSTONE R AT LIVINGSTON     MAY-SEP 2277 121% 2589  43    1886
LIVM8N
YELLOWSTONE R AT BILLINGS       MAY-SEP 3682 127% 4522  167   2909
BILM8
YELLOWSTONE R AT BILLINGS       MAY-SEP 4635 122% 5453  109   3801
BILM8N
YELLOWSTONE R AT MILES CITY     MAY-SEP 7124 109% 8708  188   6537
MILM8N
YELLOWSTONE R AT SIDNEY         MAY-SEP 7360 108% 9299  397   6789
SIDM8N
BOULDER R AT BIG TIMBER         MAY-SEP 232  91%  287   193   254
BTMM8
BOULDER R AT BIG TIMBER         MAY-SEP 274  93%  328   234   295
BTMM8N
STILLWATER R NR ABSAROKEE       MAY-SEP 516  111% 637   439   463
SRAM8
STILLWATER R NR ABSAROKEE       MAY-SEP 569  109% 691   495   522
SRAM8N
CLARKS FK YELWSTONE R NR BELFRY MAY-SEP 592  126% 704   522   470
BFYM4
CLARKS FK YELWSTONE R NR BELFRY MAY-SEP 664  123% 776   595   539
BFYM4N
BIGHORN R NR ST XAVIER          MAY-SEP 1969 85%  2642  598   2309
STXM8N
LITTLE BIGHORN R NR HARDIN      MAY-SEP 108  126% 180   85    86
HRDM8N
TONGUE R NR DAYTON              MAY-SEP 64   83%  94    46    77
DAYW4N
TONGUE R NR DECKER              MAY-SEP 149  75%  268   108   199
DSLM8N
TONGUE R RESERVOIR INFLOW       MAY-SEP 151  75%  275   108   201
DKRM8N
POWDER R NR LOCATE              MAY-SEP 160  91%  380   111   175
MHDM8
POWDER R NR LOCATE              MAY-SEP 179  95%  490   127   189
LOCM8N

LOCATIONS WITH AN "N" SUFFIX INDICATE NATURAL FLOWS EXCLUDING
STREAM AUGMENTATIONS

KAF: THOUSANDS OF ACRE-FEET

%AVG: CURRENT 50%/AVG

AVG: AVERAGE (50%) SEASONAL RUNOFF VOLUME AS SIMULATED BY THE
RIVER FORECAST MODEL CONSIDERING A CONTINUOUS SIMULATION OF THE
BASIN RESPONSE TO HISTORIC CLIMATE DATA (OBSERVED PRECIPITATION
AND TEMPERATURES) OVER THE PERIOD OF 1981-2010

THE 50%, 10% AND 90% COLUMNS INDICATE THE PROBABILITY THAT THE
ACTUAL VOLUME WILL EXCEED THE FORECAST FOR THE VALID TIME PERIOD

FOR MORE INFORMATION PLEASE VISIT:  WWW.WEATHER.GOV/MBRFC/WATER


