May 1, 2024 Spring and Summer Streamflow Forecasts
Upper Missouri Basin
The high elevation snow pack in the Upper Missouri Basin as of May 1
was below average. The snow pack in the St. Mary Basin was 77 percent,
and the Milk River Basin was 65 percent.
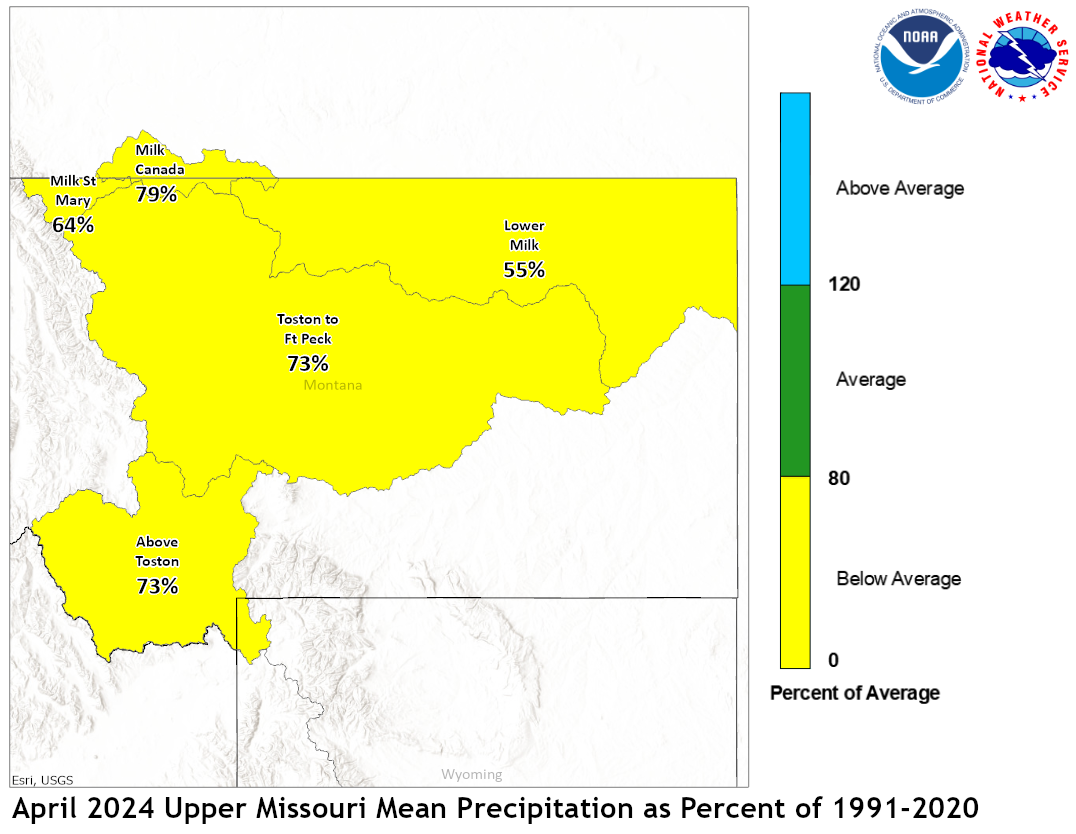
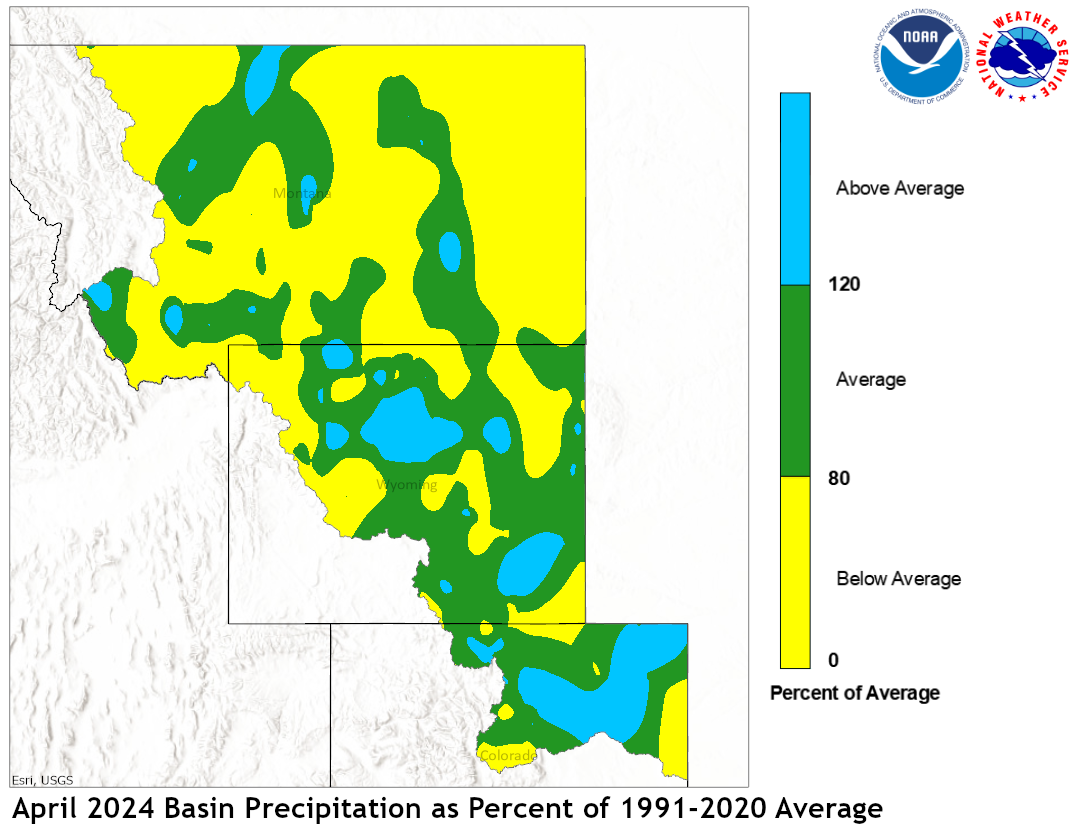
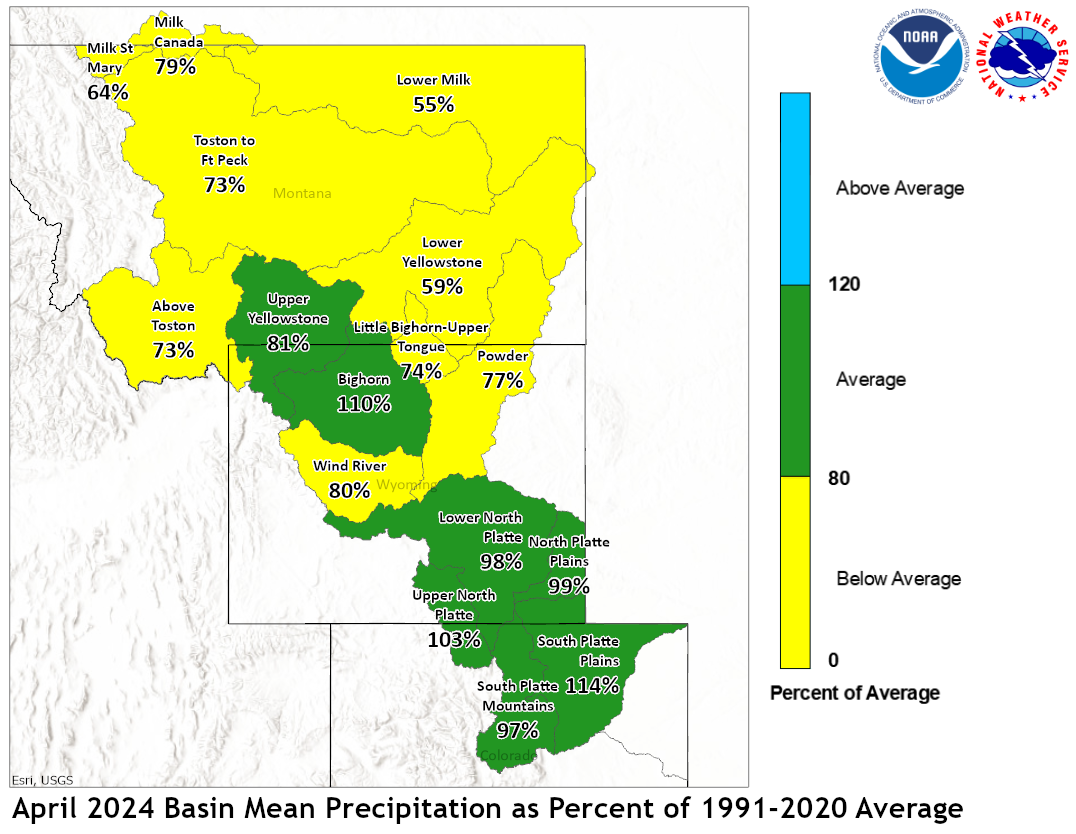
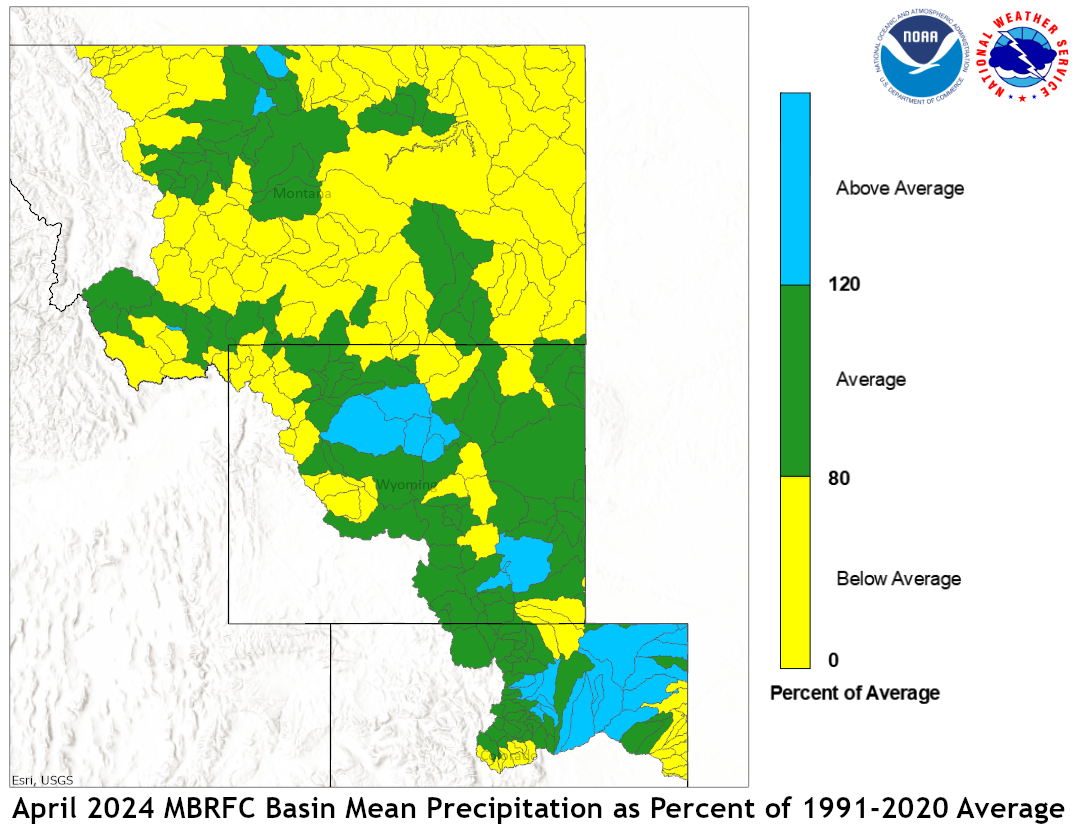
April precipitation across the Upper Missouri Basin was below average.
Basin precipitation summaries for the Missouri Basin include: Milk St. Mary,
64 percent; Milk Canada, 79 percent; Lower Milk, 55 percent; above Toston,
73 percent; Toston to Ft. Peck, 73 percent.
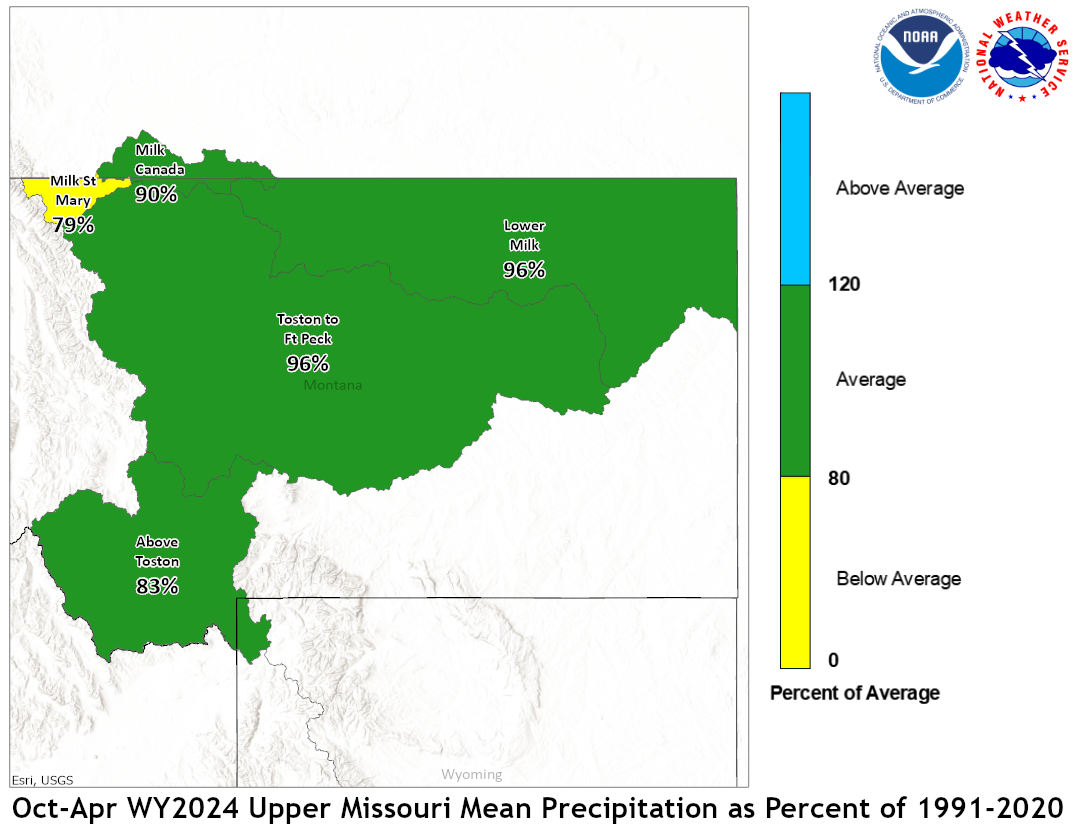
April 2024 Upper Missouri Mean Precip Oct-Apr WY2024 Upper Missouri Mean Precip
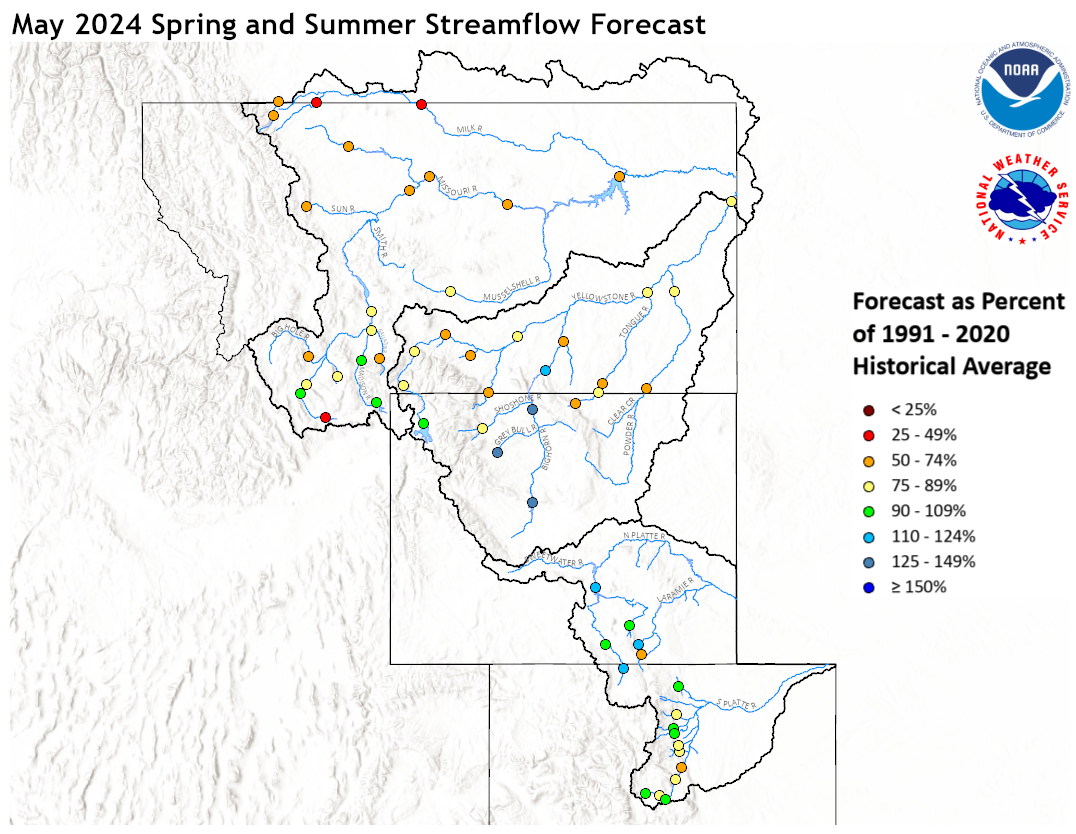
Stream flow in the Upper Missouri Basin is forecast to be
below to near average during the upcoming Spring and Summer.
The St. Mary River is forecast to have 57 percent of average
May-September flows. Runoff is expected to range around
47 percent of average for the Missouri Basin above Fort Peck,
Montana.
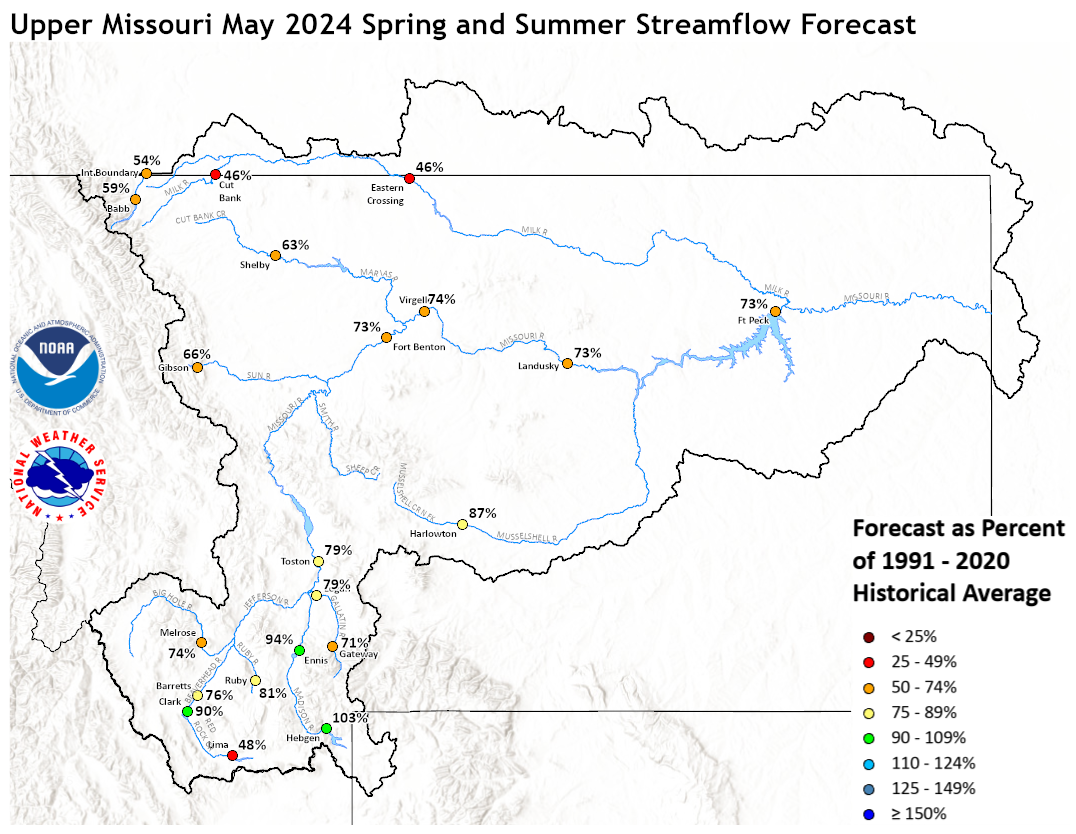
Upper Missouri May 1, 2024 Spring and Summer Streamflow Forecasts
Of the four major irrigation reservoirs in Montana; Lima
Reservoir had 123 percent average storage, Clark Canyon was
holding 112 percent of average water, Gibson Reservoir had 70
percent of average stored water, and Fresno Reservoir had
52 percent of average stored water.
Yellowstone Basin
The high elevation snow pack in the Yellowstone Basin was below average
on May 1. The snow pack in the Upper Yellowstone Basin was 74 percent
of average. The snow packs in the Wind, Bighorn, and Shoshone Basins were 96,
87, and 81 percent of average, respectively. The snow packs in the Tongue
and Powder basins were 79 and 70 percent of average, respectively.
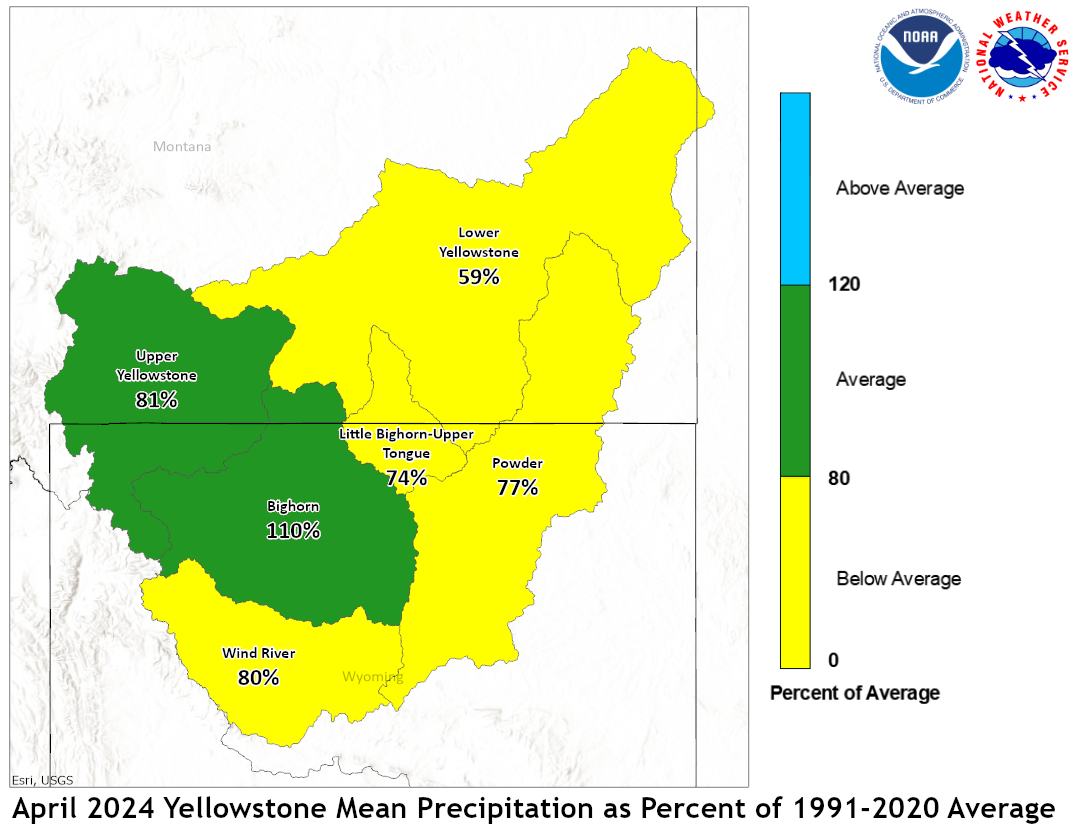
Precipitation during April was below to near average. The upper Yellowstone River
Basin received 81 percent of average precipitation while the Lower
Yellowstone River Basin reported 59 percent of average. The Bighorn
Basin received 110 percent of average precipitation while the
Wind River Basin received 80 percent of average. The Little Bighorn -
Upper Tongue Basin received 74 percent of average and the Powder River
had 77 percent of average precipitation.
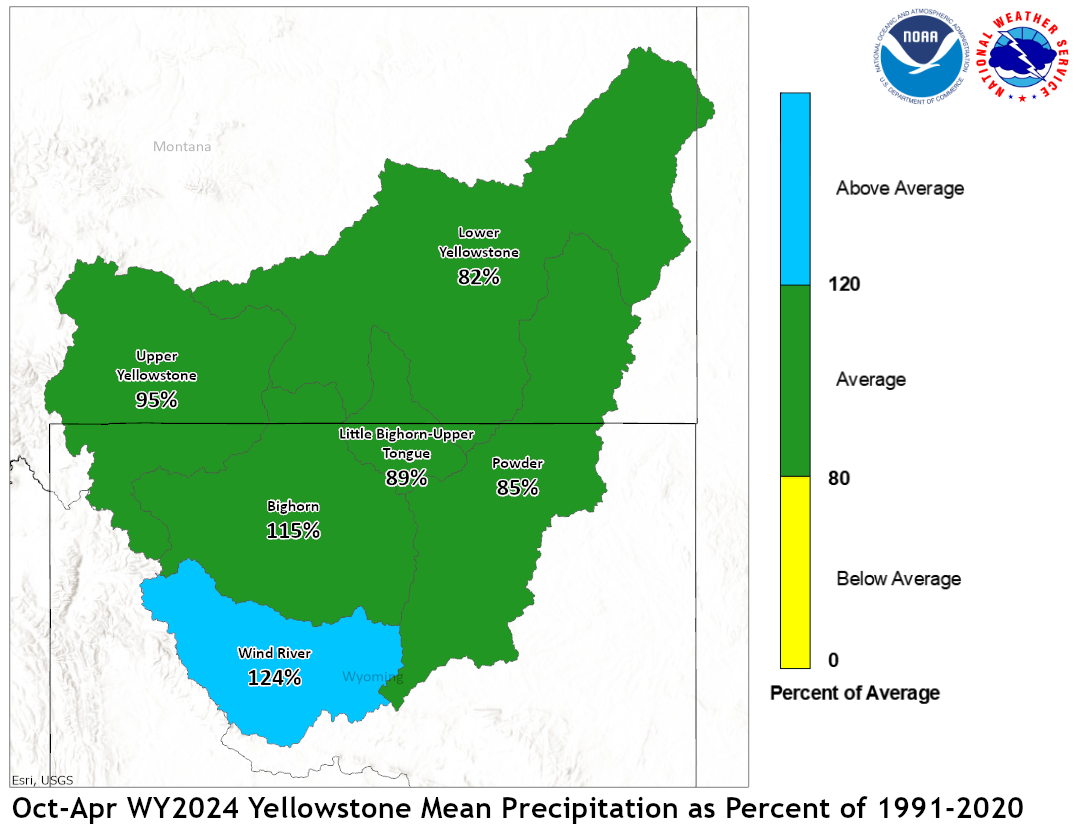
April 2024 Yellowstone Mean Precip Oct-Apr WY2024 Yellowstone Mean Precip
Forecast stream flow in the Yellowstone Basin is below to near average
for the upcoming Spring and Summer. Stream flow for the
Yellowstone River above Sidney, Montana is forecast to be about
80 percent of average. Flow in the Tongue Basin is expected to be
75 percent of average. Flows in the Powder River are expected
to be about 75 percent of average.
Monthend storage at Boysen Reservoir was 103 percent of average.
Stored water in Buffalo Bill Reservoir was 118 percent of average.
Monthend storage was 101 percent of average at Bighorn Reservoir.

Yellowstone May 1, 2024 Spring and Summer Streamflow Forecasts
Platte Basin
The high elevation snow pack in the Upper North Platte Basin was
97 percent of average on May 1. The snow pack in the North Platte
Basin below Seminoe Reservoir was 62 percent of average. The snow
pack in the South Platte Basin was 106 percent of average.
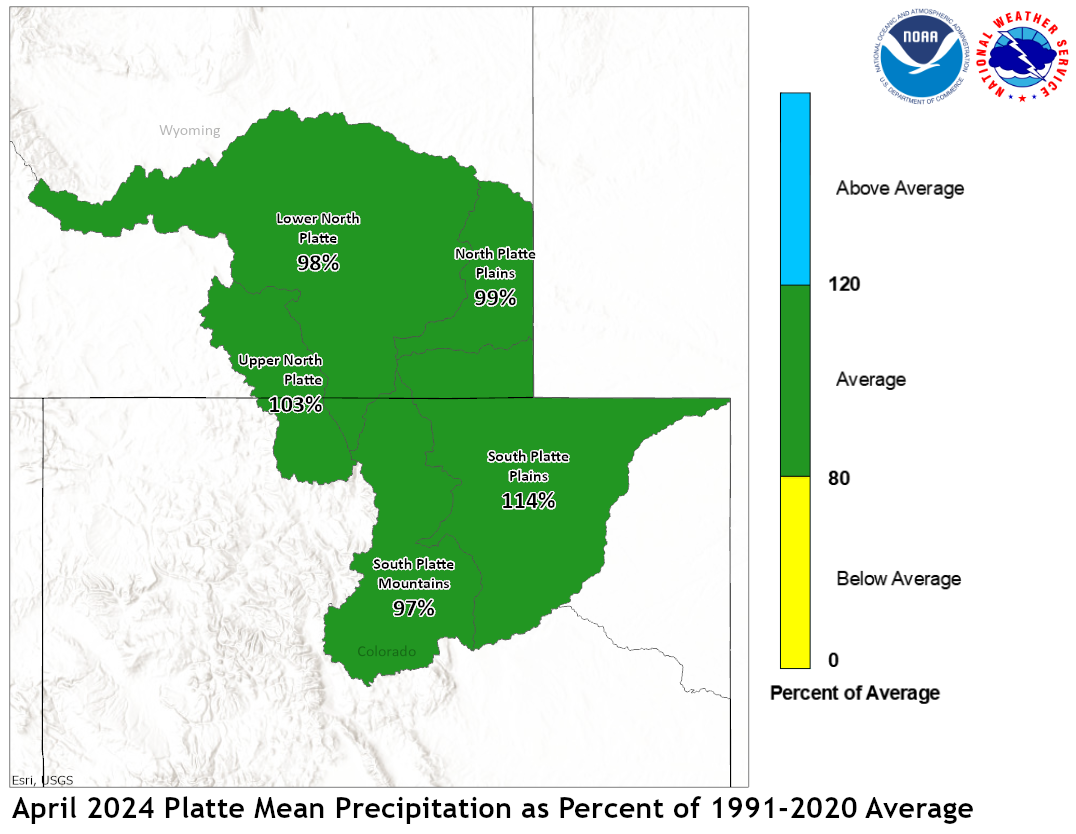
Precipitation during April in the Upper North Platte Basin was 103
percent of average. In the Lower North Platte Basin, precipitation
was 98 percent of average. The North Platte Plains below Guernsy
Reservoir had 99 percent. The South Platte Mountains had 97
percent whereas the Plains had 114 percent of average April
precipitation.
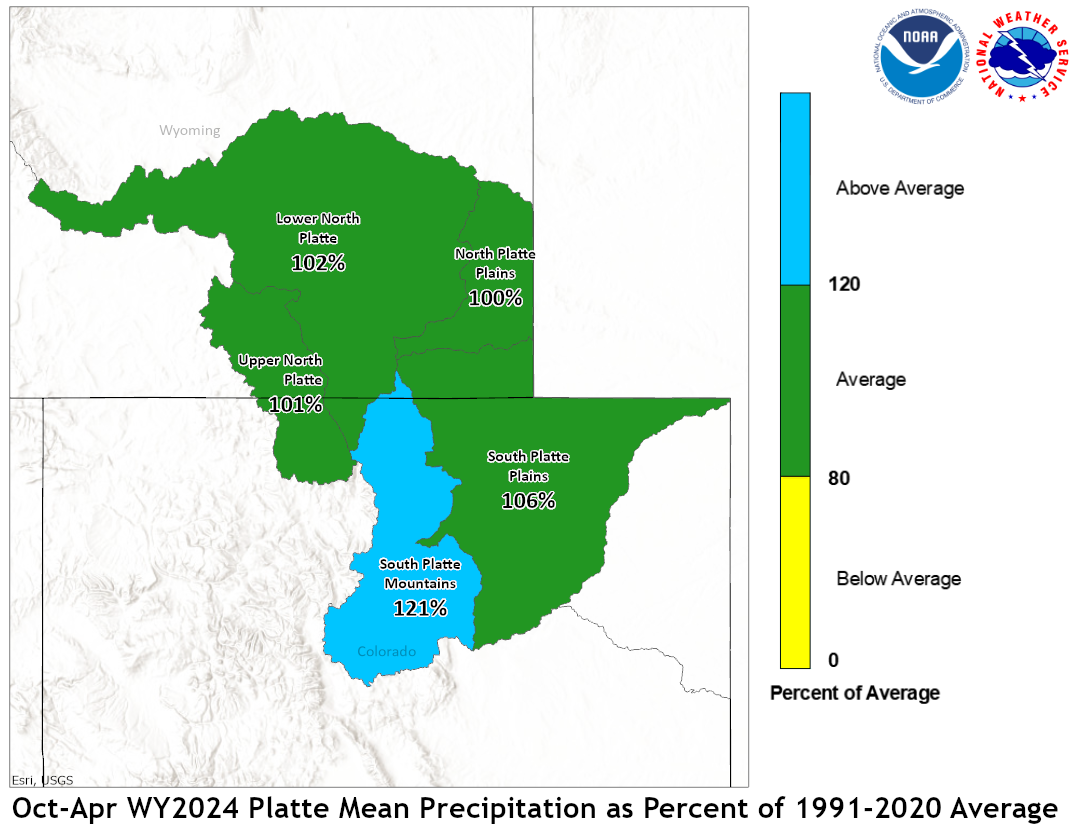
April 2024 Platte Mean Precip Oct-Apr WY2024 Platte Mean Precip
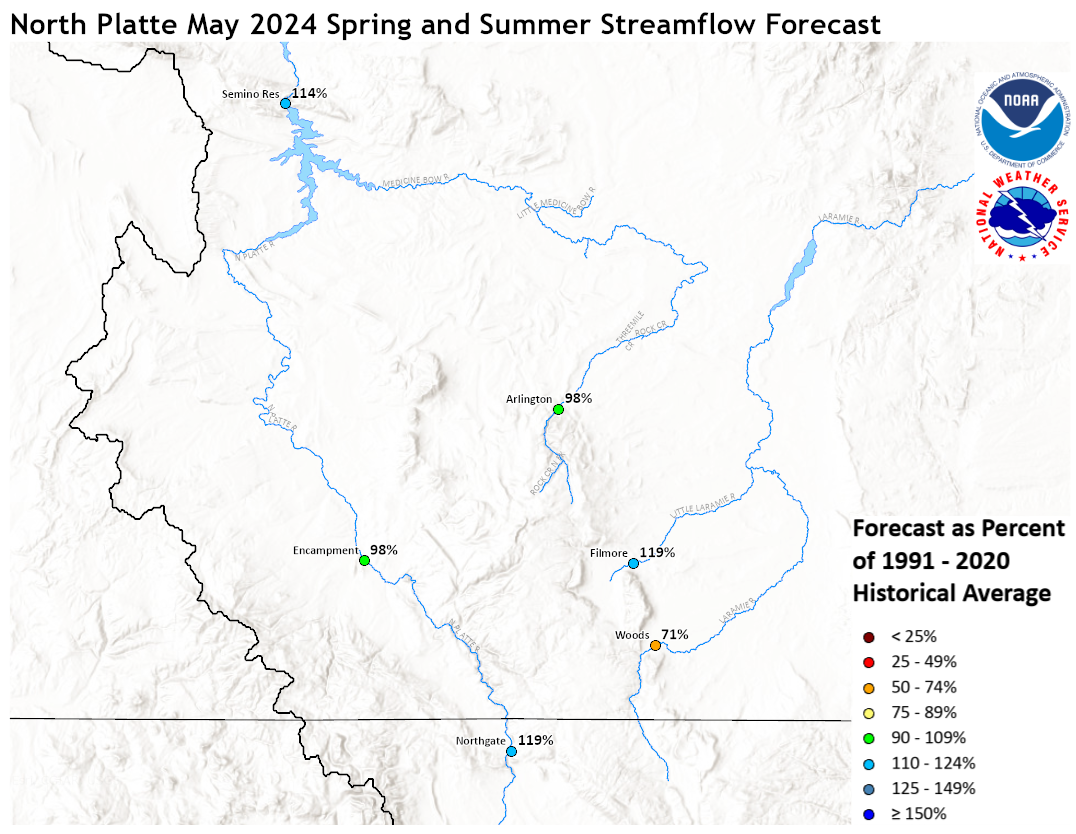
Stream flow in the Platte Basin is forecast to be near
to above average during the upcoming Spring and Summer. Runoff
for streams above Seminoe Reservoir are expected to be
about 110 percent of average. Streams in the South Platte
Basin above South Platte, Colorado can expect 90 percent
of average flow. For the remainder of the South Platte
basin, flows are expected near 80 percent.
Stored water in the South Platte Basin was 106 percent of average
on May 1.
North Platte Streamflow Fcst South Platte Streamflow Fcst
WATER SUPPLY FORECAST
NWS MISSOURI BASIN RIVER FORECAST CENTER
PLEASANT HILL MISSOURI

1122 CDT FRIDAY MAY 03, 2024

DATA CURRENT AS OF: MAY 01, 2024

MISSOURI/YELLOWSTONE/PLATTE RIVER BASIN FORECASTS


                                          50%   %   10%   90%   AVG
FORECAST POINT                   PERIOD  (KAF) AVG (KAF) (KAF) (KAF)
--------------------------------------------------------------------

Boysen Resvr Inflow              May-Sep  621   86   976  413    720
 SBDW4

Boysen Resvr Inflow              May-Sep 1110  125  1502  884    890
 SBDW4N

Bighorn R at Kane                May-Sep 1014  103  1474  805    985
 LVEW4

Bighorn R at Kane                May-Sep 1916  133  2557 1573   1440
 LVEW4N

Greybull R at Meeteetse          May-Sep  263  134   371  227    196
 MEEW4

Greybull R at Meeteetse          May-Sep  263  128   372  227    205
 MEEW4N

Buffalo Bill Resvr Inflow        May-Sep  645   79   812  556    815
 CDYW4

Buffalo Bill Resvr Inflow        May-Sep  733   81   895  650    910
 CDYW4N

Keyhole Resvr Inflow             May-Sep    4  100    11    3      4
 KEYW4

St. Mary R nr Babb               May-Sep  327   71   390  288    460
 SMYM8

St. Mary R nr Babb               May-Sep  311   58   375  271    535
 SMYM8N

St. Mary R at Intl Boundary      May-Sep  257   66   346  201    390
 SMBM8

St. Mary R at Intl Boundary      May-Sep  356   54   443  307    660
 SMBM8N

Milk R nr Western Crossing       May-Sep   14   12    37   11    113
 PDBM8

Milk R nr Western Crossing       May-Sep   19   46    49   13     41
 PDBM8N

Milk R nr Eastern Crossing       May-Sep  152   71   231  141    215
 ERNM8

Milk R nr Eastern Crossing       May-Sep   50   45   167   29    112
 ERNM8N

North Platte R nr Northgate      May-Sep  301  123   401  228    245
 NGTC2

North Platte R nr Northgate      May-Sep  350  119   449  276    295
 NGTC2N

Encampment R nr Encampment       May-Sep  154   99   176  130    156
 ECRW4

Encampment R nr Encampment       May-Sep  162   98   184  138    166
 ECRW4N

Rock Cr nr Arlington             May-Sep   52   98    59   45     53
 KCRW4

Rock Cr nr Arlington             May-Sep   52   98    59   46     53
 KCRW4N

Seminoe Resvr Inflow             May-Sep  892  117  1056  685    765
 SETW4

Seminoe Resvr Inflow             May-Sep 1045  114  1204  853    920
 SETW4N

Laramie R nr Woods Landing       May-Sep   64   59    98   41    108
 WODW4

Laramie R nr Woods Landing       May-Sep  100   70   134   77    142
 WODW4N

Little Laramie R nr Filmore      May-Sep   66  120    79   54     55
 SMTW4

Little Laramie R nr Filmore      May-Sep   68  119    81   56     57
 SMTW4N

Antero Resvr Inflow              May-Sep   14  100    18   11     14
 ANRC2

Antero Resvr Inflow              May-Sep   14  100    18   11     14
 ANRC2N

Spinney Mountain Resvr Inflow    May-Sep   51   89    71   41     57
 SPYC2

Spinney Mountain Resvr Inflow    May-Sep   40   89    61   31     45
 SPYC2N

Elevenmile Canyon Resvr Inflow   May-Sep   49   83    69   42     59
 EVNC2

Elevenmile Canyon Resvr Inflow   May-Sep   46   92    66   34     50
 EVNC2N

Cheesman Lk Inflow               May-Sep   79   79   114   63    100
 CHEC2

Cheesman Lk Inflow               May-Sep   80   86   117   61     93
 CHEC2N

S Platte R at S Platte           May-Sep  321  134   377  297    240
 SPTC2

S Platte R at S Platte           May-Sep  140   68   200  108    205
 SPTC2N

Bear Cr at Morrison              May-Sep   21   81    30   15     26
 MRRC2

Bear Cr at Morrison              May-Sep   21   81    30   15     26
 MRRC2N

Clear Cr at Golden               May-Sep   86   73   107   71    118
 GLDC2

Clear Cr at Golden               May-Sep   98   75   120   82    131
 GLDC2N

St. Vrain Cr at Lyons            May-Sep   65   82    93   55     79
 LNSC2

St. Vrain Cr at Lyons            May-Sep   87   80   119   75    109
 LNSC2N

Boulder Cr nr Orodell            May-Sep   40   85    58   35     47
 OROC2

Boulder Cr nr Orodell            May-Sep   56  108    74   50     52
 OROC2N

S Boulder Cr nr Eldorado Sprgs   May-Sep   34   97    43   31     35
 BELC2

S Boulder Cr nr Eldorado Sprgs   May-Sep   37   92    56   31     40
 BELC2N

Cache La Poudre at Canyon Mouth  May-Sep  173  160   241  136    108
 FTDC2

Cache La Poudre at Canyon Mouth  May-Sep  190   90   264  151    210
 FTDC2N

Lima Resvr Inflow                May-Sep   38   50    53   29     76
 LRRM8

Lima Resvr Inflow                May-Sep   38   48    53   29     79
 LRRM8N

Clark Canyon Resvr Inflow        May-Sep  130  118   188  114    110
 CLKM8

Clark Canyon Resvr Inflow        May-Sep  179   90   243  162    198
 CLKM8N

Beaverhead R at Barretts         May-Sep  190   95   203  174    199
 BARM8

Beaverhead R at Barretts         May-Sep  212   76   278  191    280
 BARM8N

Ruby R Resvr Inflow              May-Sep   78   89    92   66     88
 ALRM8

Ruby R Resvr Inflow              May-Sep   79   81    94   67     97
 ALRM8N

Big Hole R nr Melrose            May-Sep  423   71   606  351    595
 MLRM8

Big Hole R nr Melrose            May-Sep  488   74   670  417    660
 MLRM8N

Hebgen Resvr Inflow              May-Sep  477  103   539  437    465
 HBDM8

Hebgen Resvr Inflow              May-Sep  477  103   539  437    465
 HBDM8N

Ennis Resvr Inflow               May-Sep  646   90   749  595    715
 ELMM8

Ennis Resvr Inflow               May-Sep  684   94   789  628    730
 ELMM8N

Gallatin R nr Gateway            May-Sep  337   71   420  286    475
 GLGM8

Gallatin R nr Gateway            May-Sep  337   71   420  286    475
 GLGM8N

Gallatin R at Logan              May-Sep  364   72   488  302    505
 LOGM8

Gallatin R at Logan              May-Sep  511   79   626  457    650
 LOGM8N

Missouri R at Toston             May-Sep 1560   76  1946 1370   2060
 TOSM8

Missouri R at Toston             May-Sep 2249   79  2710 2074   2830
 TOSM8N

Missouri R at Fort Benton        May-Sep 1784   58  1995 1695   3060
 FBNM8

Missouri R at Fort Benton        May-Sep 3003   73  3667 2743   4100
 FBNM8N

Missouri R nr Virgelle           May-Sep 1926   56  2140 1805   3420
 VRGM8

Missouri R nr Virgelle           May-Sep 3382   74  4152 3084   4560
 VRGM8N

Missouri R nr Landusky           May-Sep 1949   53  2202 1784   3680
 LDKM8

Missouri R nr Landusky           May-Sep 3554   73  4337 3248   4890
 LDKM8N

Missouri R below Fort Peck Dam   May-Sep 2185   57  2500 1907   3840
 FPKM8

Missouri R below Fort Peck Dam   May-Sep 3806   73  4603 3453   5180
 FPKM8N

Gibson Resvr Inflow              May-Sep  299   66   415  250    450
 AGSM8

Gibson Resvr Inflow              May-Sep  299   66   415  249    450
 AGSM8N

Marias R nr Shelby               May-Sep  258   59   386  199    435
 SHLM8

Marias R nr Shelby               May-Sep  310   63   440  248    490
 SHLM8N

Musselshell R at Harlowton       May-Sep   67   84   115   44     80
 HLWM8

Musselshell R at Harlowton       May-Sep   83   87   131   59     95
 HLWM8N

Yellowstone R at Yellowstone Lk  May-Sep  769   94   821  669    815
 YLOW4

Yellowstone R at Yellowstone Lk  May-Sep  883  105   967  777    840
 YLOW4N

Yellowstone R at Corwin Sprgs    May-Sep 1527   77  1723 1318   1980
 CORM8

Yellowstone R at Corwin Sprgs    May-Sep 1731   84  1951 1518   2070
 CORM8N

Yellowstone R at Livingston      May-Sep 1673   73  1922 1457   2290
 LIVM8

Yellowstone R at Livingston      May-Sep 1933   79  2188 1711   2440
 LIVM8N

Yellowstone R at Billings        May-Sep 2676   66  3340 2366   4070
 BILM8

Yellowstone R at Billings        May-Sep 3583   75  4230 3230   4790
 BILM8N

Yellowstone R at Miles City      May-Sep 4300   74  5520 3714   5850
 MILM8

Yellowstone R at Miles City      May-Sep 6826   89  8151 6069   7690
 MILM8N

Yellowstone R at Sidney          May-Sep 4265   75  5538 3591   5710
 SIDM8

Yellowstone R at Sidney          May-Sep 7175   89  8582 6332   8060
 SIDM8N

Boulder R at Big Timber          May-Sep  158   47   197  130    335
 BTMM8

Boulder R at Big Timber          May-Sep  201   54   238  173    375
 BTMM8N

Stillwater R nr Absarokee        May-Sep  354   66   438  303    540
 SRAM8

Stillwater R nr Absarokee        May-Sep  414   70   495  363    595
 SRAM8N

Clks Fk Yellowstone R nr Belfry  May-Sep  444   72   548  385    620
 BFYM8

Clks Fk Yellowstone R nr Belfry  May-Sep  516   74   620  457    695
 BFYM8N

Bighorn R nr St. Xavier          May-Sep 1242   87  1848 1049   1430
 STXM8

Bighorn R nr St. Xavier          May-Sep 2860  116  3675 2423   2460
 STXM8N

Little Bighorn R nr Hardin       May-Sep   91   72   151   75    127
 HRDM8

Little Bighorn R nr Hardin       May-Sep   91   72   151   75    127
 HRDM8N

Tongue R nr Dayton               May-Sep   66   69    95   47     96
 DAYW4

Tongue R nr Dayton               May-Sep   71   70   101   53    101
 DAYW4N

Tongue R nr Decker               May-Sep  144   61   233  108    235
 DSLM8

Tongue R nr Decker               May-Sep  189   79   277  153    240
 DSLM8N

Tongue R Resvr Inflow            May-Sep  129   55   222   94    235
 DKRM8

Tongue R Resvr Inflow            May-Sep  177   72   269  141    245
 DKRM8N

Powder R at Moorhead             May-Sep  142   63   326  112    225
 MHDM8

Powder R at Moorhead             May-Sep  188   70   368  157    270
 MHDM8N

Powder R nr Locate               May-Sep  187   72   365  143    260
 LOCM8

Powder R nr Locate               May-Sep  236   77   406  188    305
 LOCM8N


Locations with an `N` suffix indicate natural flows excluding
stream augmentations.

KAF: Thousands of Acre-feet

%AVG: Current 50%/AVG

AVG: Average(50%) seasonal runoff voulme as simulated by the river
forecast model considering acontinuous simulation of the basin
response to historic climate data (observed precipitation and
temperatures) over the period of 1991-2020.

The 50%, 10% and 90% columns indicate the probability that the
actual volume will exceed the forecast for the valid time period.

Beginning April 1, May and June official forecasts include observed
runoff volume up to official forecast date.

For more information, please visit: www.weather.gov/mbrfc/water


$$


